Climate for Station: Lawrence, Kansas, United States
Loading live weather...
Climate Analysis & Overview
Lawrence, Kansas is experiencing a notable warming trend, with recent decades showing a sharper increase in temperatures compared to historical averages. The precipitation patterns have become more evenly distributed, suggesting a shift towards a more balanced hydrological cycle.
Climate Classification and Geographic Influence
Lawrence is located in the heart of the United States, classified under the Köppen climate system as a humid subtropical climate (Cfa). This classification is characterized by hot, humid summers and mild to cool winters. The city's position in the central plains means it is subject to continental climate influences, with significant temperature variations. The absence of nearby large bodies of water or mountain ranges allows for unimpeded air mass movements, contributing to the area's temperature extremes.
Temperature Trends: A Decade of Change
Over the past decade, Lawrence has experienced a marked warming trend. High temperatures have increased by 1.64°C (2.95°F), while low temperatures have risen even more sharply by 2.45°C (4.41°F). This recent warming surpasses the all-time trends, which show a more modest rise of 0.07°C (0.13°F) for highs and 0.12°C (0.22°F) for lows. The discrepancy between the 10-year and all-time trends highlights a recent acceleration in warming, aligning with broader regional and national climate observations.
Historical Extremes and Current Records
Lawrence's climate extremes are notable, with record temperatures reaching a sweltering 45.6°C (114.1°F) and plunging to a frigid -31.7°C (-25.1°F). These records underscore the city's susceptibility to extreme weather events, a characteristic feature of its continental climate. Such extremes are critical for understanding potential future challenges in climate adaptation and resilience planning.
Precipitation Patterns: A Shift Towards Even Distribution
The Precipitation Concentration Index (PCI) for Lawrence has decreased from a baseline of 12.85 to a current value of 11.22. This reduction indicates a more even distribution of rainfall throughout the year, as opposed to concentrated heavy rainfall events. While the change is not drastic, it suggests a shift towards a more stable precipitation regime, which could have implications for water management and agricultural practices in the region.
Regional Climate Goals and Implications
In line with the United States' climate goals, which aim to mitigate the impacts of climate change through emission reductions and sustainable practices, Lawrence's evolving climate profile presents both challenges and opportunities. The recent warming trends necessitate adaptive strategies to manage heat stress and energy demands. Meanwhile, the more even precipitation distribution could benefit agricultural productivity and water resource management, aligning with national efforts to enhance climate resilience.
Station Statistics
10-Year Trend
High: +1.92 °F/decade
Low: +2.32 °F/decade
Rain: -0.008 in/decade
25-Year Trend
High: +0.42 °F/decade
Low: +0.40 °F/decade
Rain: -0.002 in/decade
50-Year Trend
High: -0.02 °F/decade
Low: +0.01 °F/decade
Rain: -0.001 in/decade
All-Time Trend
High: +0.10 °F/decade
Low: +0.19 °F/decade
Rain: -0.000 in/decade
Percentage Above-Average Days
Last 12 Months: 60.3%
This Year: 61.0%
Precipitation Concentration Index (PCI) ℹ️
Last 12 Months: 11.0
Historical Average: 12.9
Percentile Rank of Last 12 Months ℹ️
High: 79th percentile
Low: 91st percentile
Rain: 62nd percentile
Change in Variance ℹ️
High: -6.1%
Low: -0.2%
Intraday: -9.0%
Data Coverage
78.3%
First Year of Data
1860
Station Location
Historical Weather Records
| Max High | Avg High | Min High | Max Avg | Avg Avg | Min Avg | Max Low | Avg Low | Min Low | Max Precipitation | Avg Precipitation | Max Snow | Avg Snow | |
|---|---|---|---|---|---|---|---|---|---|---|---|---|---|
| Record | 114.08 °F | — | -14.08 °F | 97.34 °F | — | -14.98 °F | 93.02 °F | — | -25.06 °F | 7.23 in | — | 20.00 in | — |
| January | 73.94 °F | 39.17 °F | -5.08 °F | 62.42 °F | 28.53 °F | -6.88 °F | 57.02 °F | 20.29 °F | -20.92 °F | 2.03 in | 0.03 in | 12.01 in | 0.17 in |
| February | 84.02 °F | 44.21 °F | -14.08 °F | 63.86 °F | 33.49 °F | -4.90 °F | 60.08 °F | 23.87 °F | -25.06 °F | 1.90 in | 0.04 in | 15.00 in | 0.18 in |
| March | 93.92 °F | 55.71 °F | 5.00 °F | 74.30 °F | 45.09 °F | 3.92 °F | 66.92 °F | 33.60 °F | -7.06 °F | 2.90 in | 0.08 in | 20.00 in | 0.11 in |
| April | 93.92 °F | 67.04 °F | 28.04 °F | 80.06 °F | 55.42 °F | 25.70 °F | 71.96 °F | 44.95 °F | 10.94 °F | 3.24 in | 0.11 in | 9.02 in | 0.02 in |
| May | 102.02 °F | 75.88 °F | 44.96 °F | 84.92 °F | 65.17 °F | 38.48 °F | 75.92 °F | 55.03 °F | 30.02 °F | 3.78 in | 0.15 in | 0.00 in | 0.00 in |
| June | 107.06 °F | 84.96 °F | 55.94 °F | 91.40 °F | 74.91 °F | 55.94 °F | 82.04 °F | 64.40 °F | 37.04 °F | 5.92 in | 0.16 in | 0.00 in | 0.00 in |
| July | 113.00 °F | 90.11 °F | 64.94 °F | 97.34 °F | 79.09 °F | 62.06 °F | 93.02 °F | 68.84 °F | 46.94 °F | 6.92 in | 0.13 in | 0.00 in | 0.00 in |
| August | 114.08 °F | 88.77 °F | 64.04 °F | 93.92 °F | 76.89 °F | 58.28 °F | 86.00 °F | 67.18 °F | 42.08 °F | 5.30 in | 0.13 in | 0.00 in | 0.00 in |
| September | 107.96 °F | 80.96 °F | 46.94 °F | 91.22 °F | 68.44 °F | 42.44 °F | 84.92 °F | 58.88 °F | 23.54 °F | 7.23 in | 0.12 in | 0.00 in | 0.00 in |
| October | 98.06 °F | 69.66 °F | 26.06 °F | 82.58 °F | 56.45 °F | 29.12 °F | 75.92 °F | 47.40 °F | 15.08 °F | 3.50 in | 0.09 in | 7.01 in | 0.01 in |
| November | 84.92 °F | 54.67 °F | 14.00 °F | 70.70 °F | 43.46 °F | 9.50 °F | 66.02 °F | 34.71 °F | 1.94 °F | 4.91 in | 0.06 in | 9.49 in | 0.05 in |
| December | 75.92 °F | 42.56 °F | -7.06 °F | 68.18 °F | 32.71 °F | -14.98 °F | 59.00 °F | 24.76 °F | -20.92 °F | 3.05 in | 0.05 in | 14.02 in | 0.15 in |
Data Visualisations
Remove WatermarksCurrent Year Climate Trends vs Historical
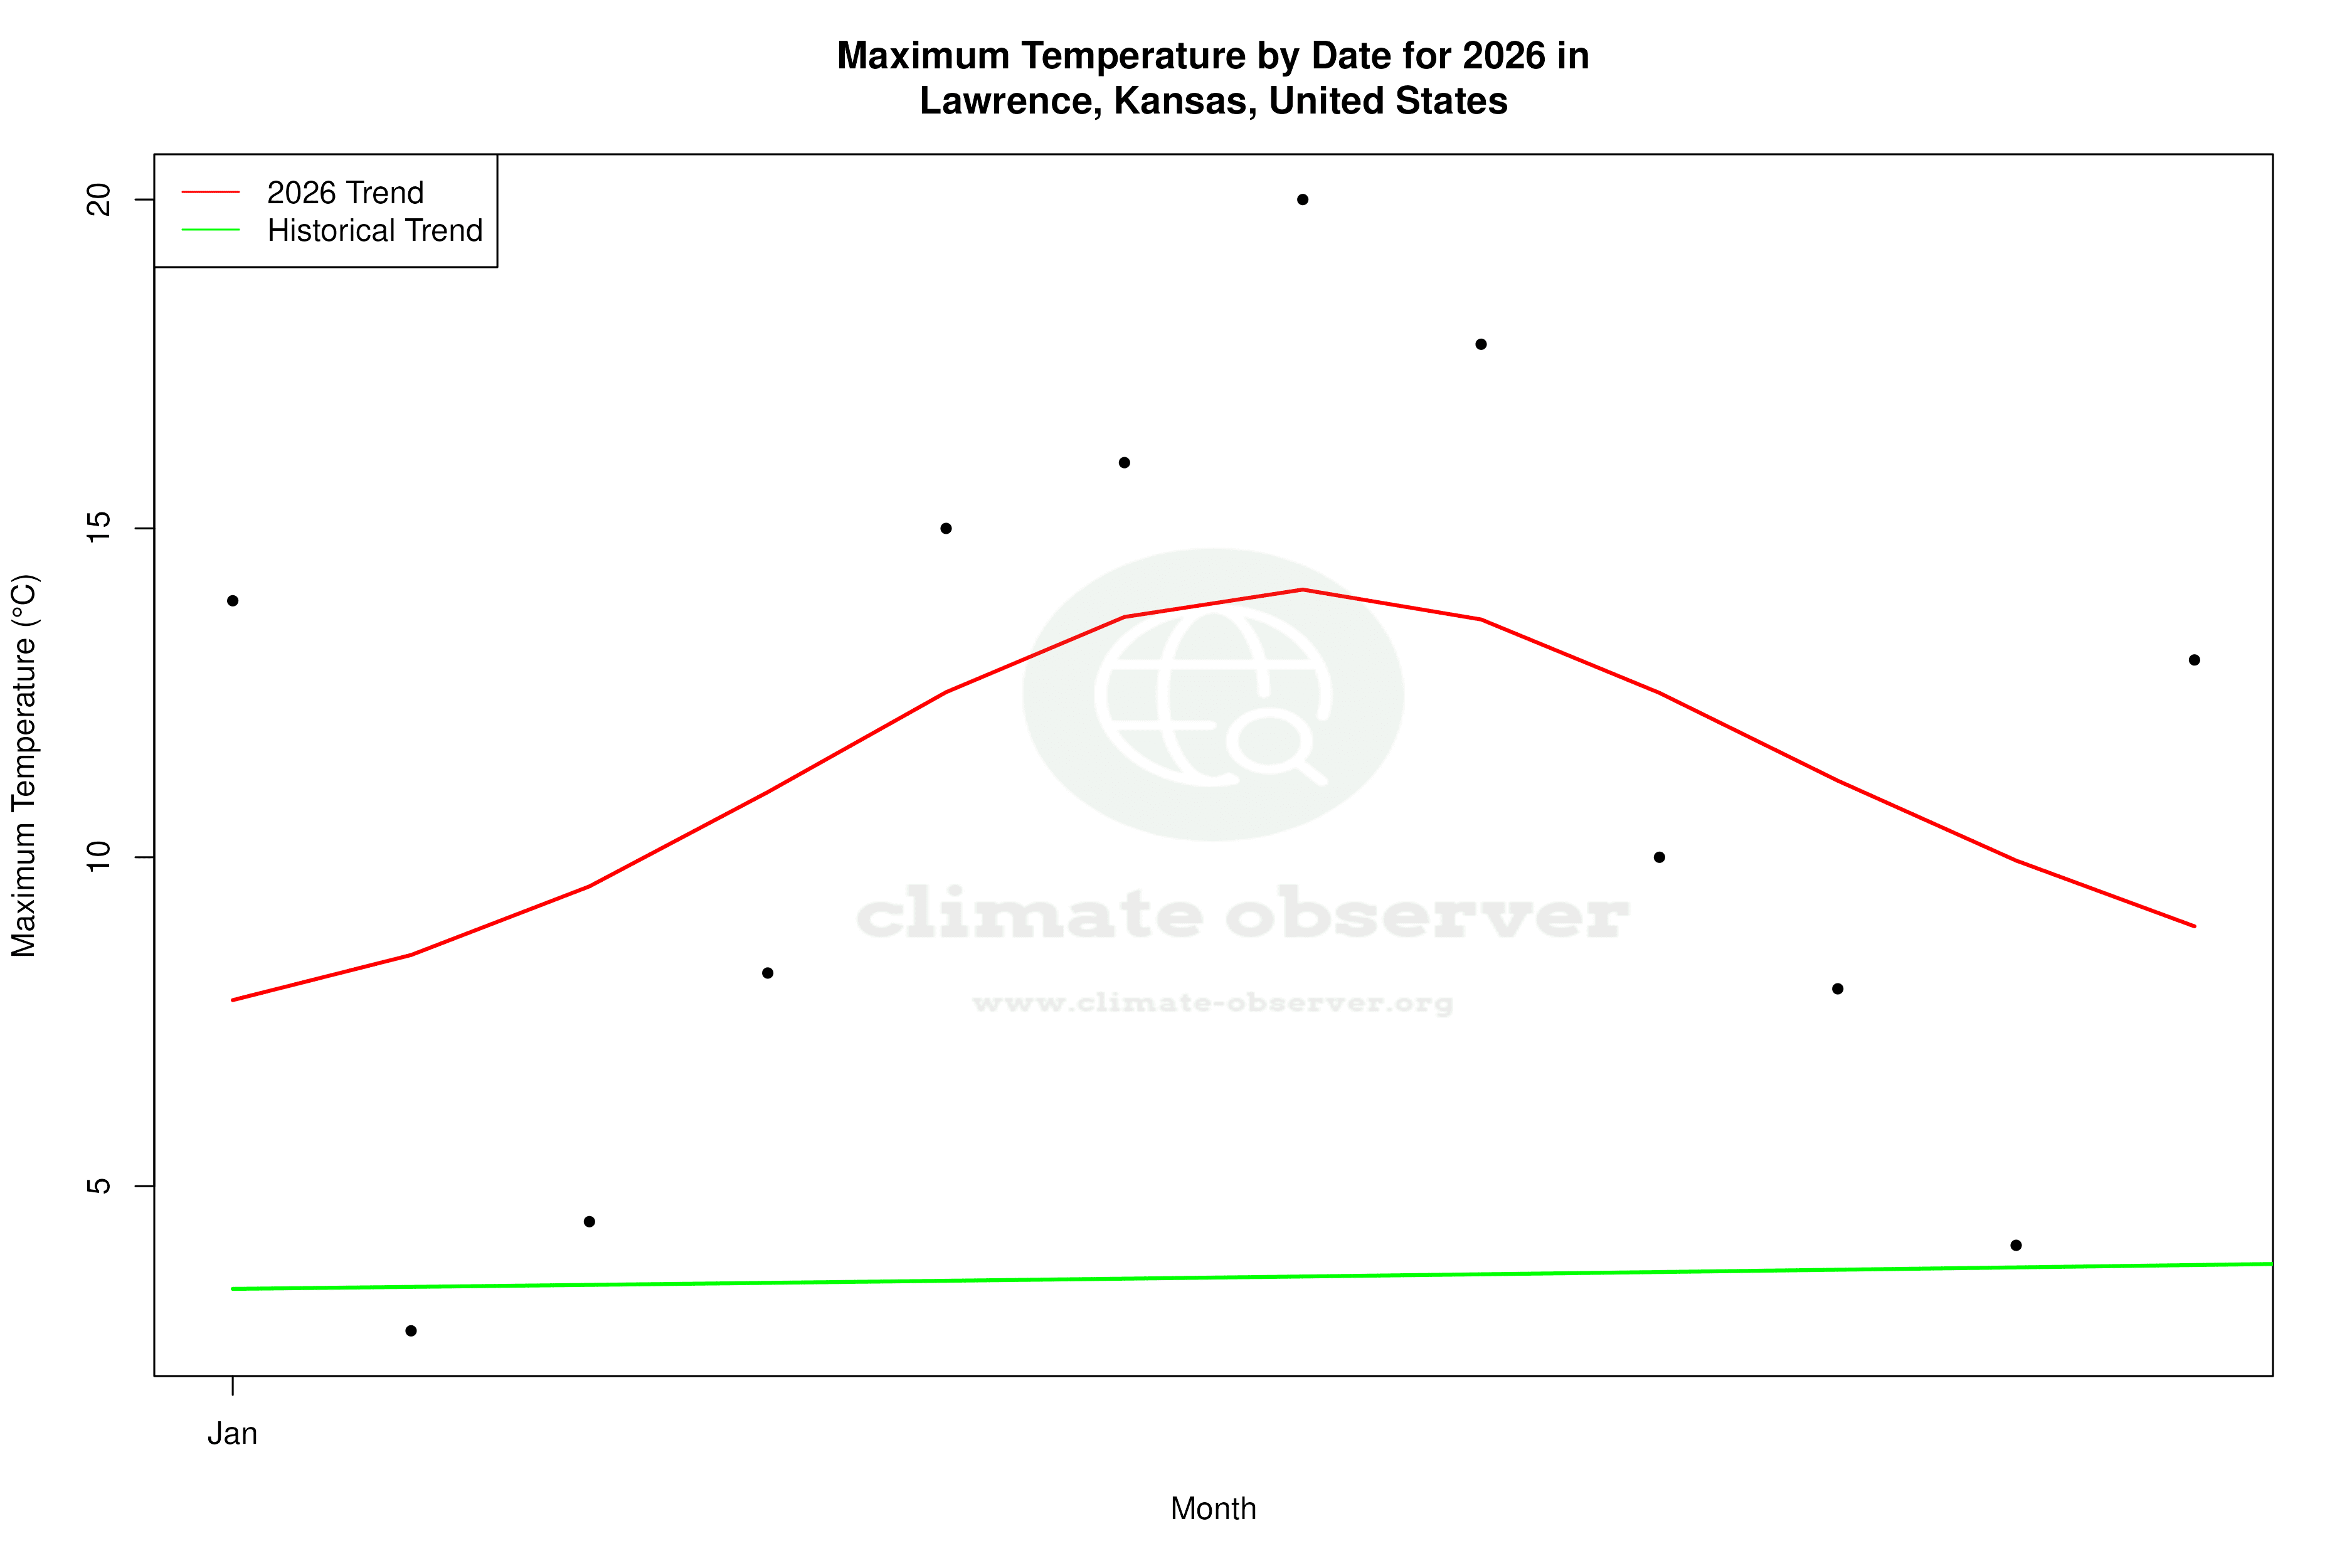


Max Temperature this Year | 1 of 6
Climate 12-Month Moving Averages


Max Temperature 12-Month MA | 1 of 6
Daily Data Points and Averages Throughout the Year


Average Max Temperature Throughout Year | 1 of 5
