Climate for Station: Jeanerette 5 Nw, Louisiana, United States
Loading live weather...
Climate Analysis & Overview
The climate profile of Jeanerette 5 Nw reveals nuanced thermal trends with a recent cooling pattern in high temperatures over the past decade, juxtaposed against a long-term slight warming trend in low temperatures. Precipitation patterns have become more evenly distributed, reflecting broader climate shifts in the region.
Subtropical Climate Dynamics
Jeanerette 5 Nw, located in Iberia Parish, Louisiana, is characterised by a humid subtropical climate, typical of the southeastern United States. This classification is marked by hot, humid summers and mild winters, influenced by proximity to the Gulf of Mexico. The local geography, including the nearby Atchafalaya Basin, plays a critical role in moderating temperatures and influencing precipitation patterns.
Temperature Trends: A Cooling Decade
Over the past decade, high temperatures at this station have shown a cooling trend of 0.22°C (0.40°F). This contrasts with the all-time trend, which indicates a slight cooling of 0.11°C (0.20°F) in high temperatures. Conversely, low temperatures have experienced a more pronounced cooling in the last ten years, with a decrease of 0.59°C (1.06°F), yet the all-time data suggests a minor warming trend of 0.04°C (0.07°F). These patterns highlight the complex interplay between short-term climate variability and long-term trends.
Precipitation Patterns: More Evenly Distributed
The Precipitation Concentration Index (PCI) for Jeanerette 5 Nw has decreased from a baseline of 11.78 to a current value of 10.23. This indicates that precipitation is now more evenly distributed throughout the year. A PCI below 10 suggests a very even distribution, while values above 20 would indicate highly concentrated rainfall events. This shift towards more evenly spread precipitation could be beneficial for agriculture and water management in the region.
Record Extremes: A Tale of Contrasts
Jeanerette 5 Nw has experienced significant temperature extremes, with a record high of 40.6°C (105.1°F) and a record low of -16.1°C (3.0°F). These records underscore the station's capacity for climatic extremes, which are not uncommon in this part of Louisiana, where the climate is influenced by both tropical and polar air masses.
Regional Climate Context
The observed climatic trends at Jeanerette 5 Nw align with broader regional patterns in the southeastern United States, where climate goals focus on mitigating the impacts of extreme weather and improving resilience. Recent weather events, such as hurricanes and flooding, have underscored the importance of understanding and adapting to these climatic shifts. As the climate continues to evolve, monitoring stations like Jeanerette 5 Nw provide critical data to inform policy and planning efforts.
Station Statistics
10-Year Trend
High: +1.65 °F/decade
Low: +0.06 °F/decade
Rain: -0.086 in/decade
25-Year Trend
High: +0.75 °F/decade
Low: +0.95 °F/decade
Rain: -0.002 in/decade
50-Year Trend
High: +0.42 °F/decade
Low: +0.50 °F/decade
Rain: -0.002 in/decade
All-Time Trend
High: -0.19 °F/decade
Low: +0.09 °F/decade
Rain: +0.001 in/decade
Percentage Above-Average Days
Last 12 Months: 62.2%
This Year: 52.5%
Precipitation Concentration Index (PCI) ℹ️
Last 12 Months: 11.7
Historical Average: 11.1
Percentile Rank of Last 12 Months ℹ️
High: 86th percentile
Low: 94th percentile
Rain: 13th percentile
Change in Variance ℹ️
High: -10.4%
Low: -0.6%
Intraday: -15.2%
Data Coverage
80.2%
First Year of Data
1969
Station Location
Historical Weather Records
| Max High | Avg High | Min High | Max Avg | Avg Avg | Min Avg | Max Low | Avg Low | Min Low | Max Precipitation | Avg Precipitation | Max Snow | Avg Snow | |
|---|---|---|---|---|---|---|---|---|---|---|---|---|---|
| Record | 105.08 °F | — | 12.92 °F | 92.66 °F | — | 16.18 °F | 82.94 °F | — | 3.02 °F | 10.15 in | — | 12.52 in | — |
| January | 89.06 °F | 62.20 °F | 24.98 °F | 75.56 °F | 51.24 °F | 19.76 °F | 73.04 °F | 41.80 °F | 6.98 °F | 4.44 in | 0.16 in | 0.31 in | 0.00 in |
| February | 84.92 °F | 65.18 °F | 12.92 °F | 73.76 °F | 55.12 °F | 21.58 °F | 75.02 °F | 44.98 °F | 3.02 °F | 6.80 in | 0.15 in | 12.52 in | 0.01 in |
| March | 89.96 °F | 71.50 °F | 35.96 °F | 78.80 °F | 61.60 °F | 33.62 °F | 73.04 °F | 50.77 °F | 21.02 °F | 5.75 in | 0.13 in | 0.00 in | 0.00 in |
| April | 93.02 °F | 78.38 °F | 50.00 °F | 80.29 °F | 68.18 °F | 44.65 °F | 77.00 °F | 57.82 °F | 30.02 °F | 10.15 in | 0.15 in | 0.00 in | 0.00 in |
| May | 98.06 °F | 84.64 °F | 64.04 °F | 85.59 °F | 75.50 °F | 56.25 °F | 78.98 °F | 64.90 °F | 42.08 °F | 6.30 in | 0.16 in | 0.00 in | 0.00 in |
| June | 104.00 °F | 89.68 °F | 75.02 °F | 90.39 °F | 80.94 °F | 69.13 °F | 82.94 °F | 70.89 °F | 55.94 °F | 5.75 in | 0.20 in | 0.00 in | 0.00 in |
| July | 104.00 °F | 90.94 °F | 75.92 °F | 89.20 °F | 82.11 °F | 74.48 °F | 82.04 °F | 72.53 °F | 60.98 °F | 8.00 in | 0.24 in | 0.00 in | 0.00 in |
| August | 105.08 °F | 91.12 °F | 75.02 °F | 92.66 °F | 82.17 °F | 68.92 °F | 82.04 °F | 72.05 °F | 59.43 °F | 6.57 in | 0.20 in | 0.00 in | 0.00 in |
| September | 100.94 °F | 87.86 °F | 64.94 °F | 92.12 °F | 78.15 °F | 59.29 °F | 80.96 °F | 67.81 °F | 42.08 °F | 8.83 in | 0.17 in | 0.00 in | 0.00 in |
| October | 98.06 °F | 80.82 °F | 50.27 °F | 82.90 °F | 69.96 °F | 41.07 °F | 78.98 °F | 57.39 °F | 28.94 °F | 6.78 in | 0.12 in | 0.00 in | 0.00 in |
| November | 93.02 °F | 71.40 °F | 35.06 °F | 78.08 °F | 60.81 °F | 36.99 °F | 78.08 °F | 48.74 °F | 21.92 °F | 6.05 in | 0.14 in | 0.00 in | 0.00 in |
| December | 89.06 °F | 64.49 °F | 17.96 °F | 75.56 °F | 54.16 °F | 16.18 °F | 75.02 °F | 43.55 °F | 10.04 °F | 5.65 in | 0.16 in | 2.01 in | 0.00 in |
Data Visualisations
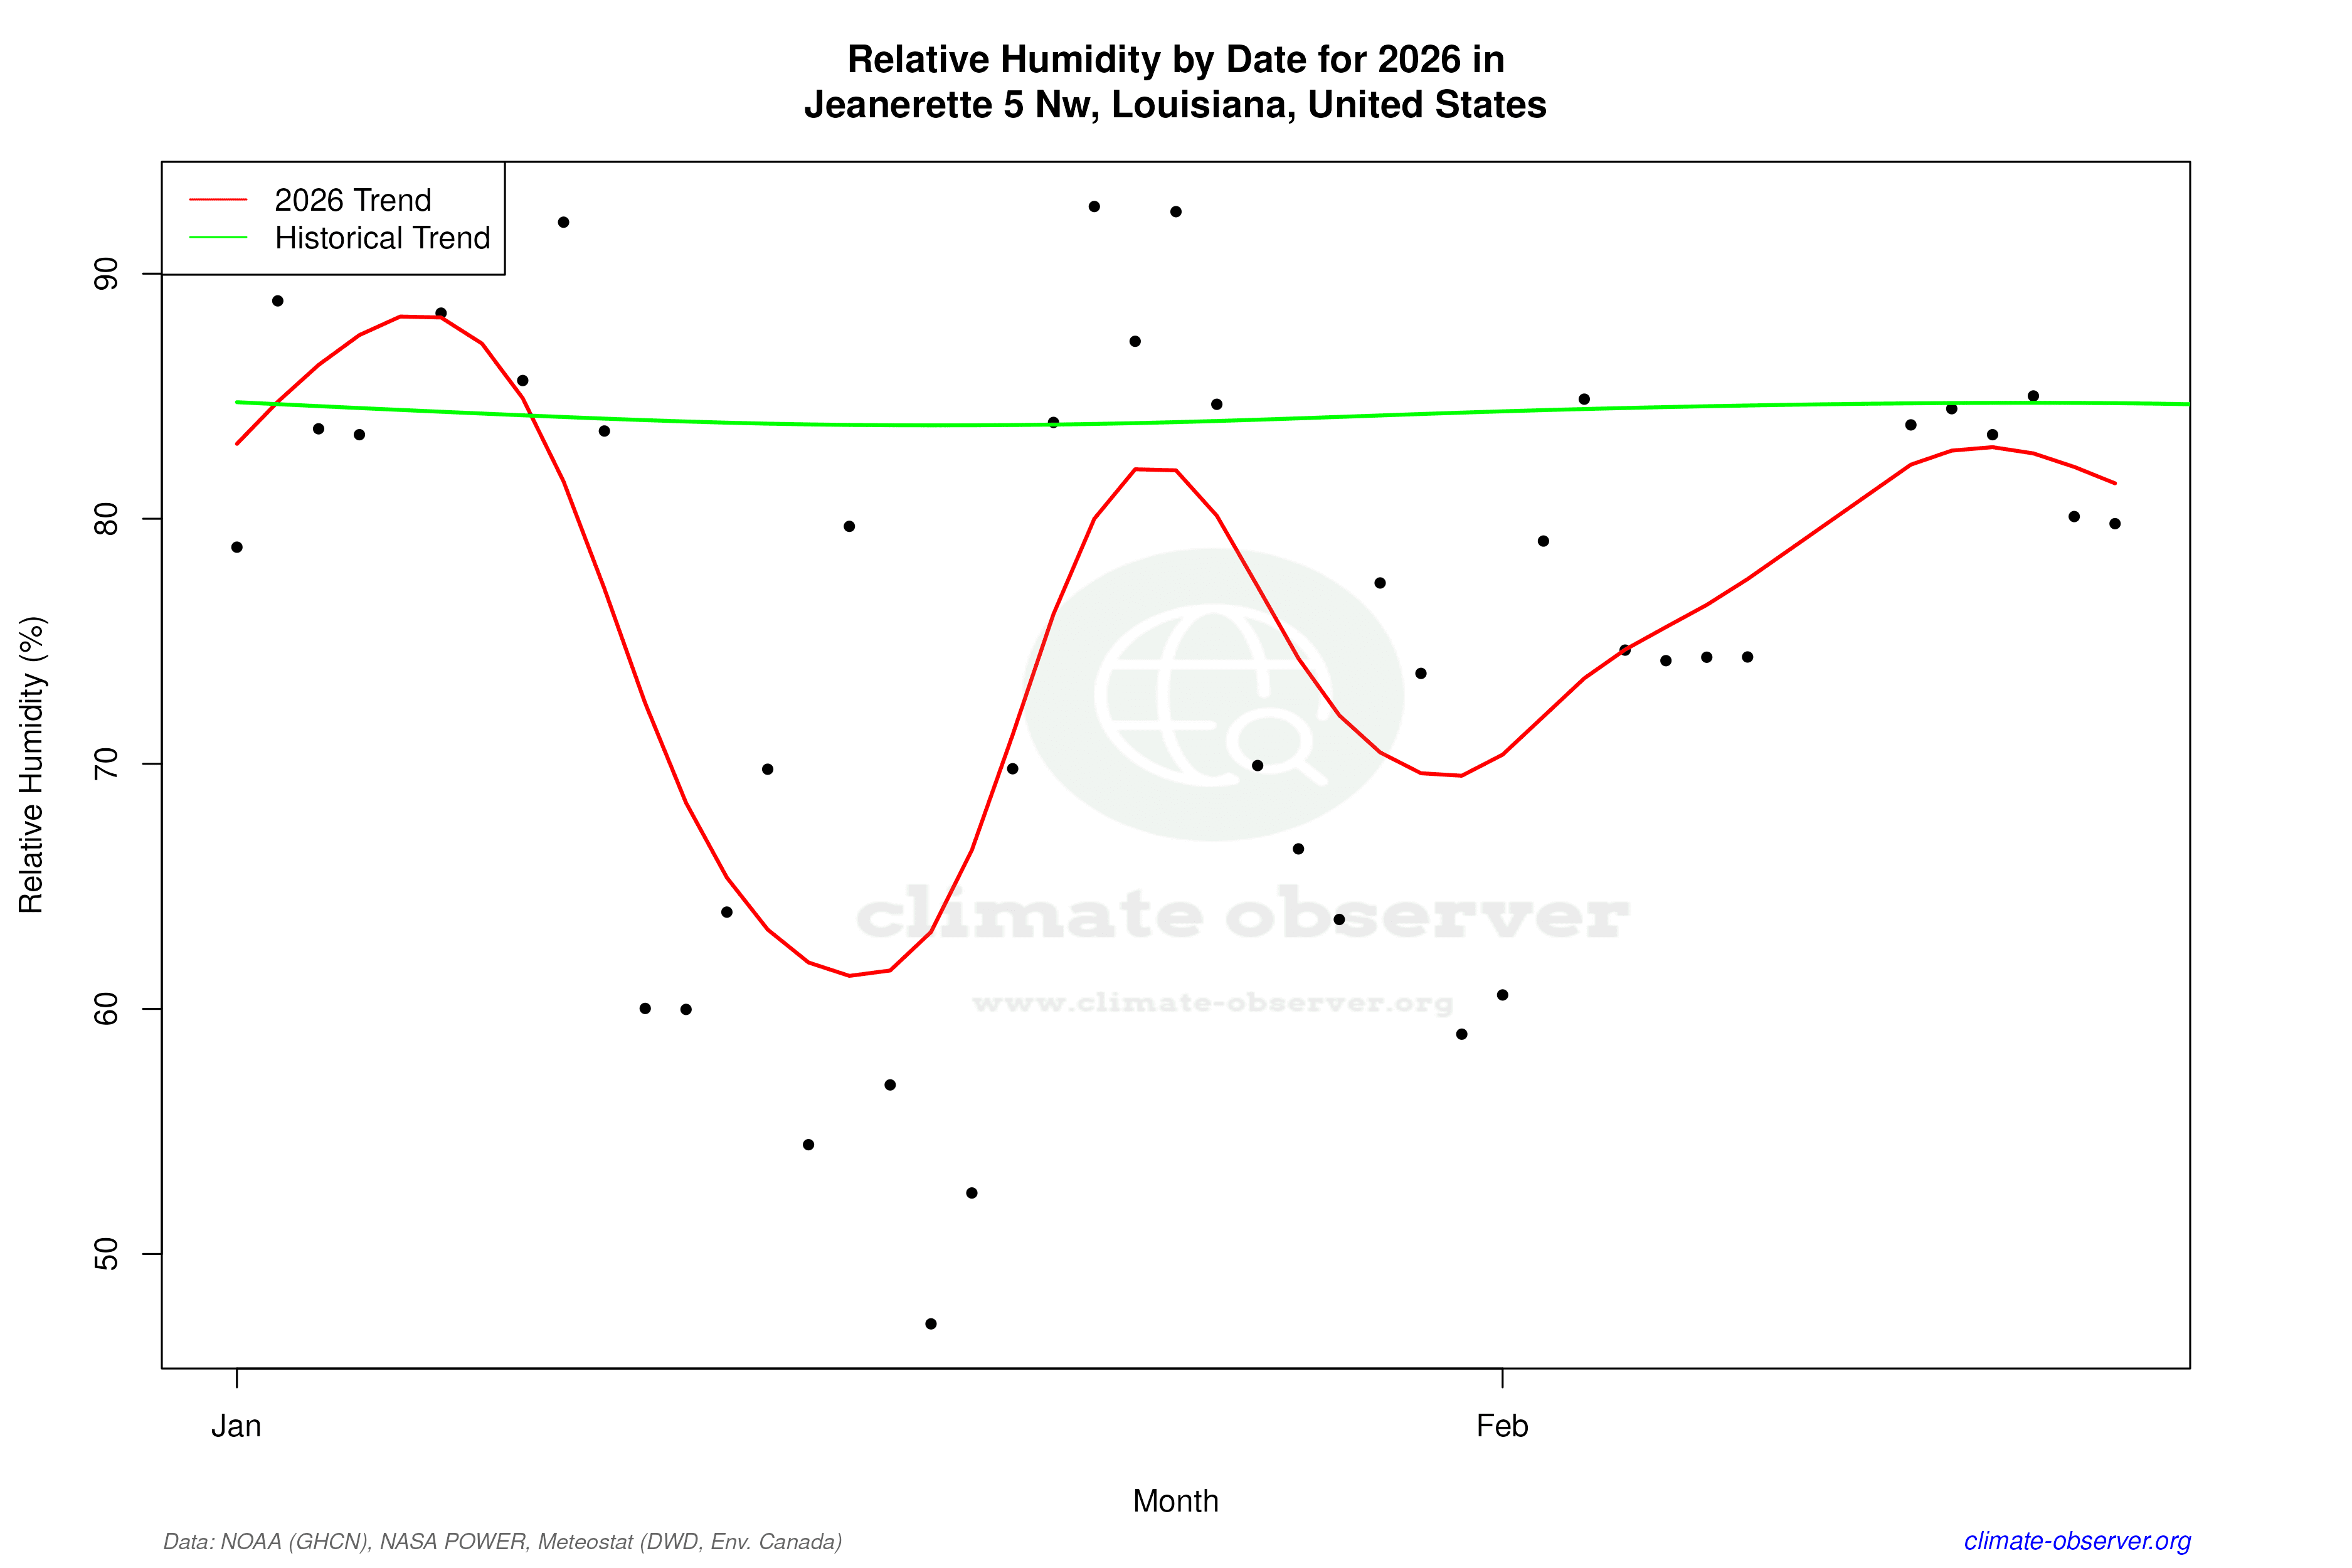
Remove WatermarksCurrent Year Climate Trends vs Historical

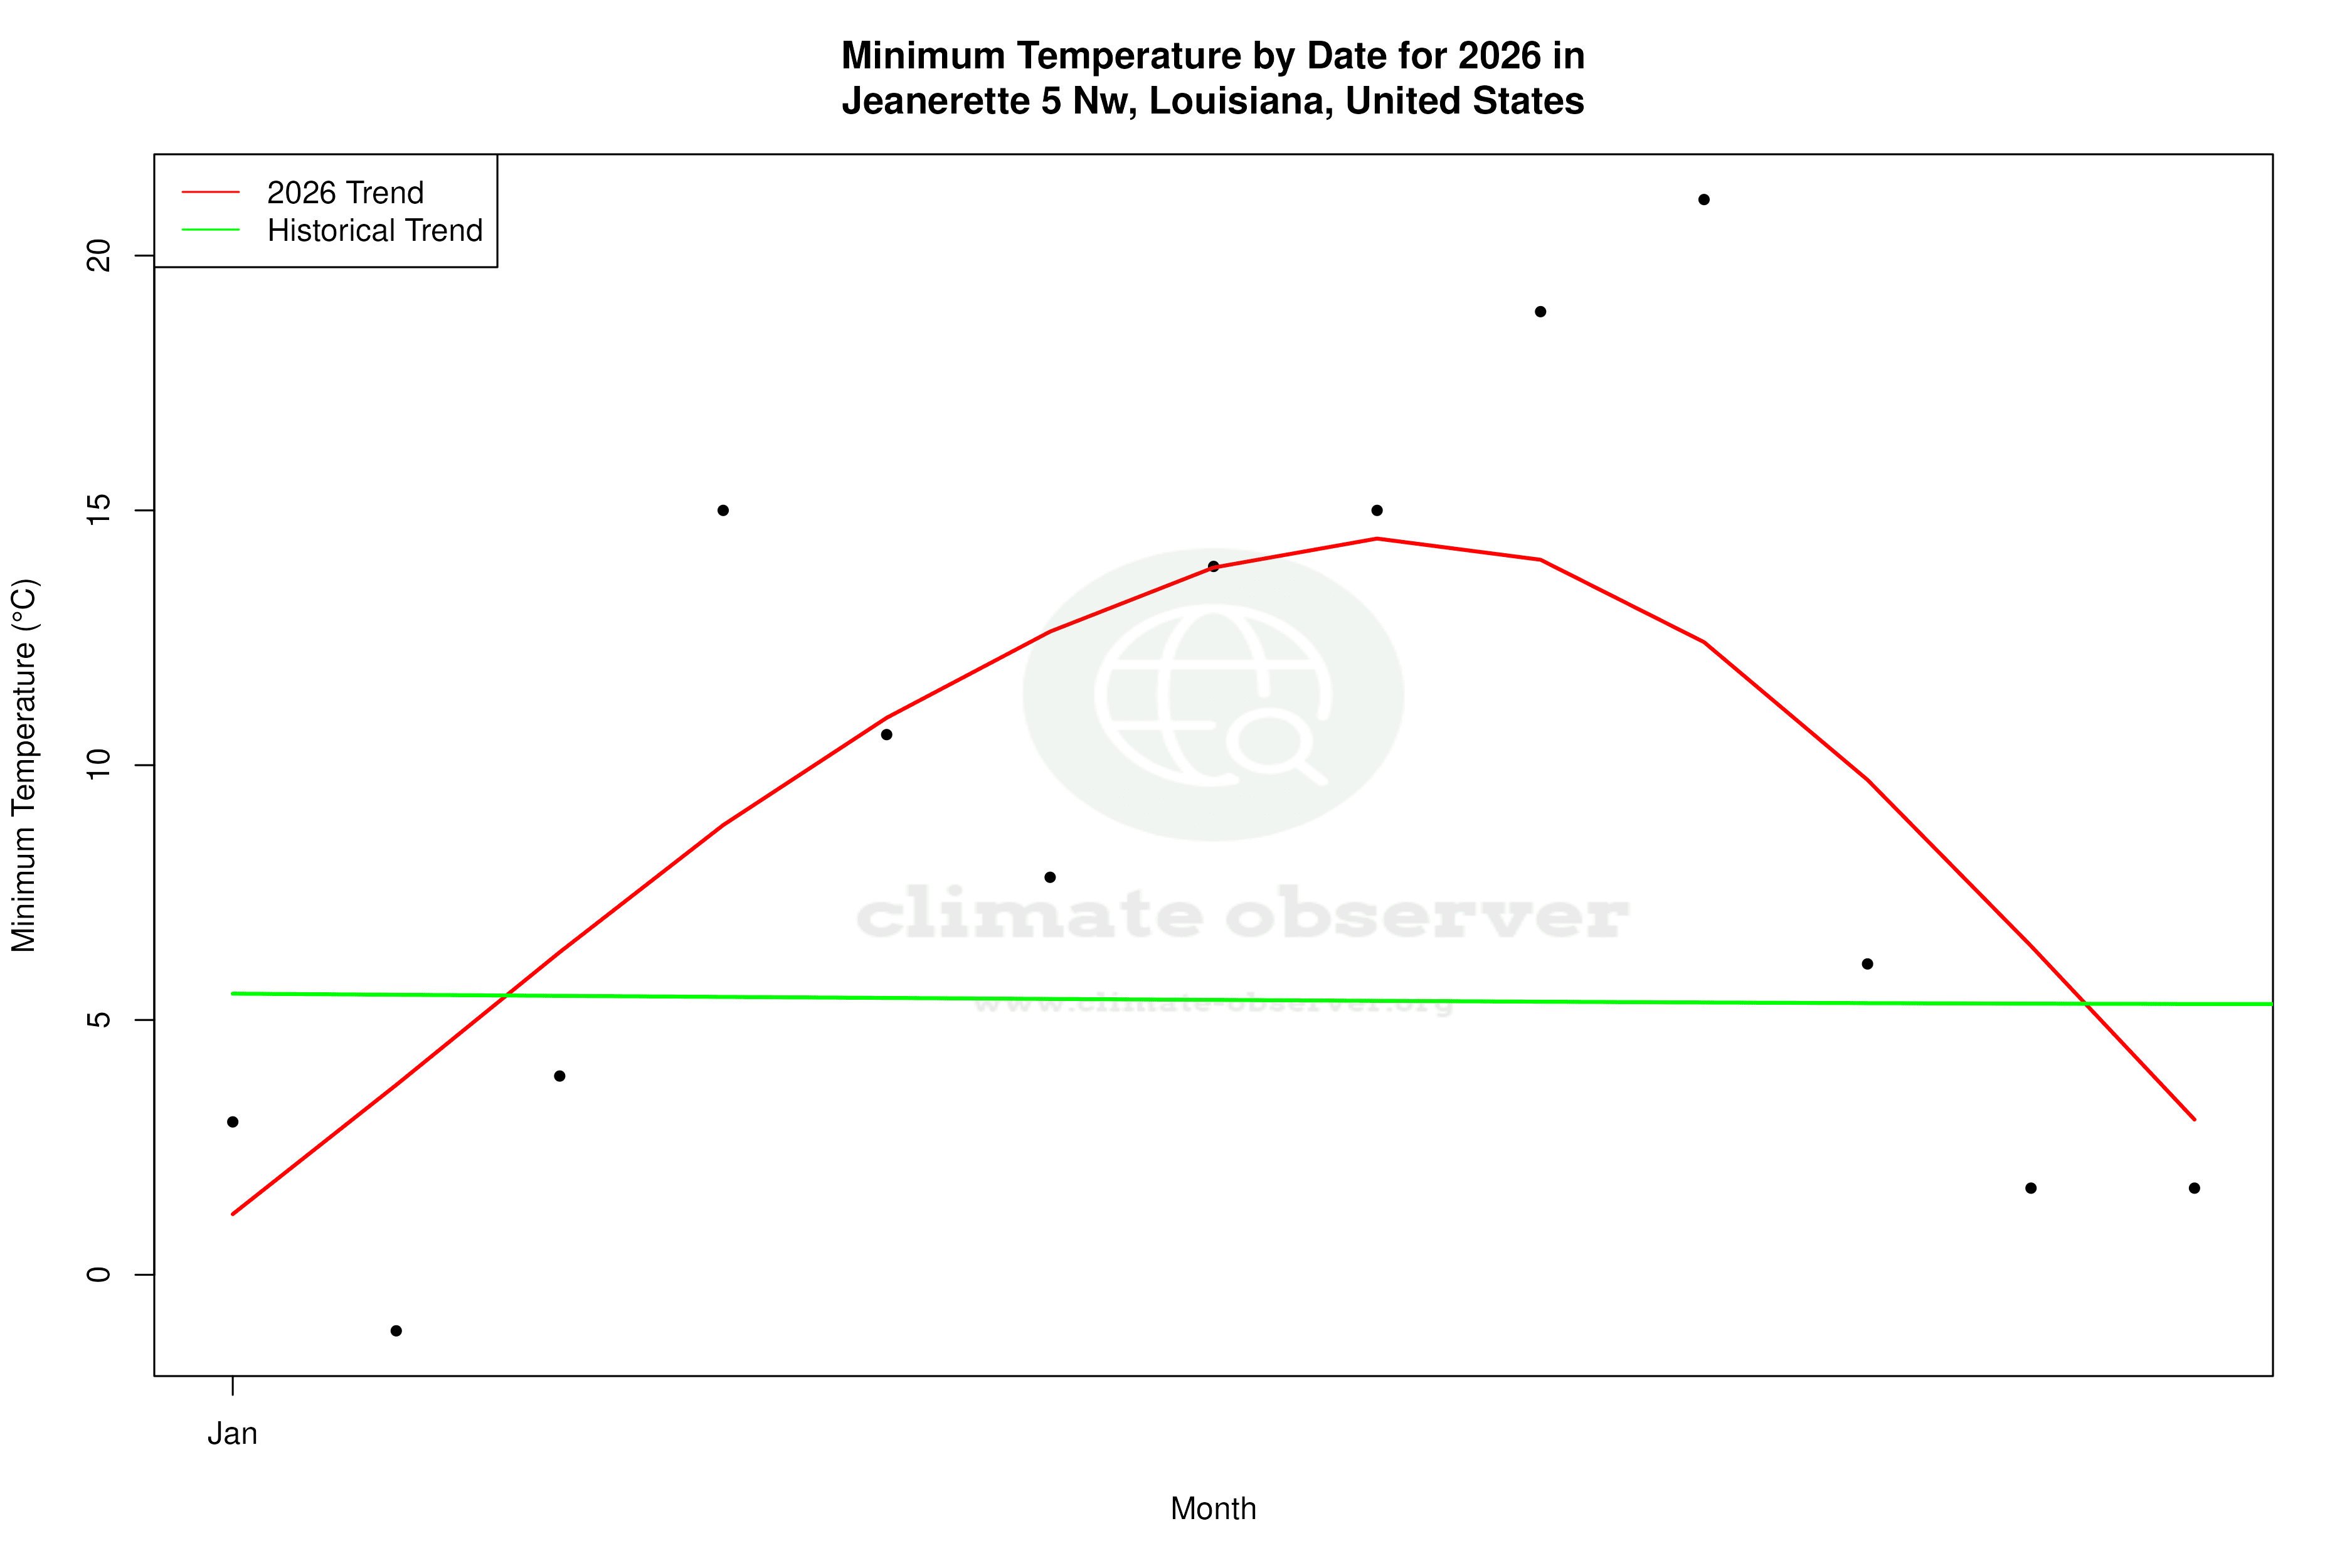


Max Temperature this Year | 1 of 6
Climate 12-Month Moving Averages


Max Temperature 12-Month MA | 1 of 6
Daily Data Points and Averages Throughout the Year


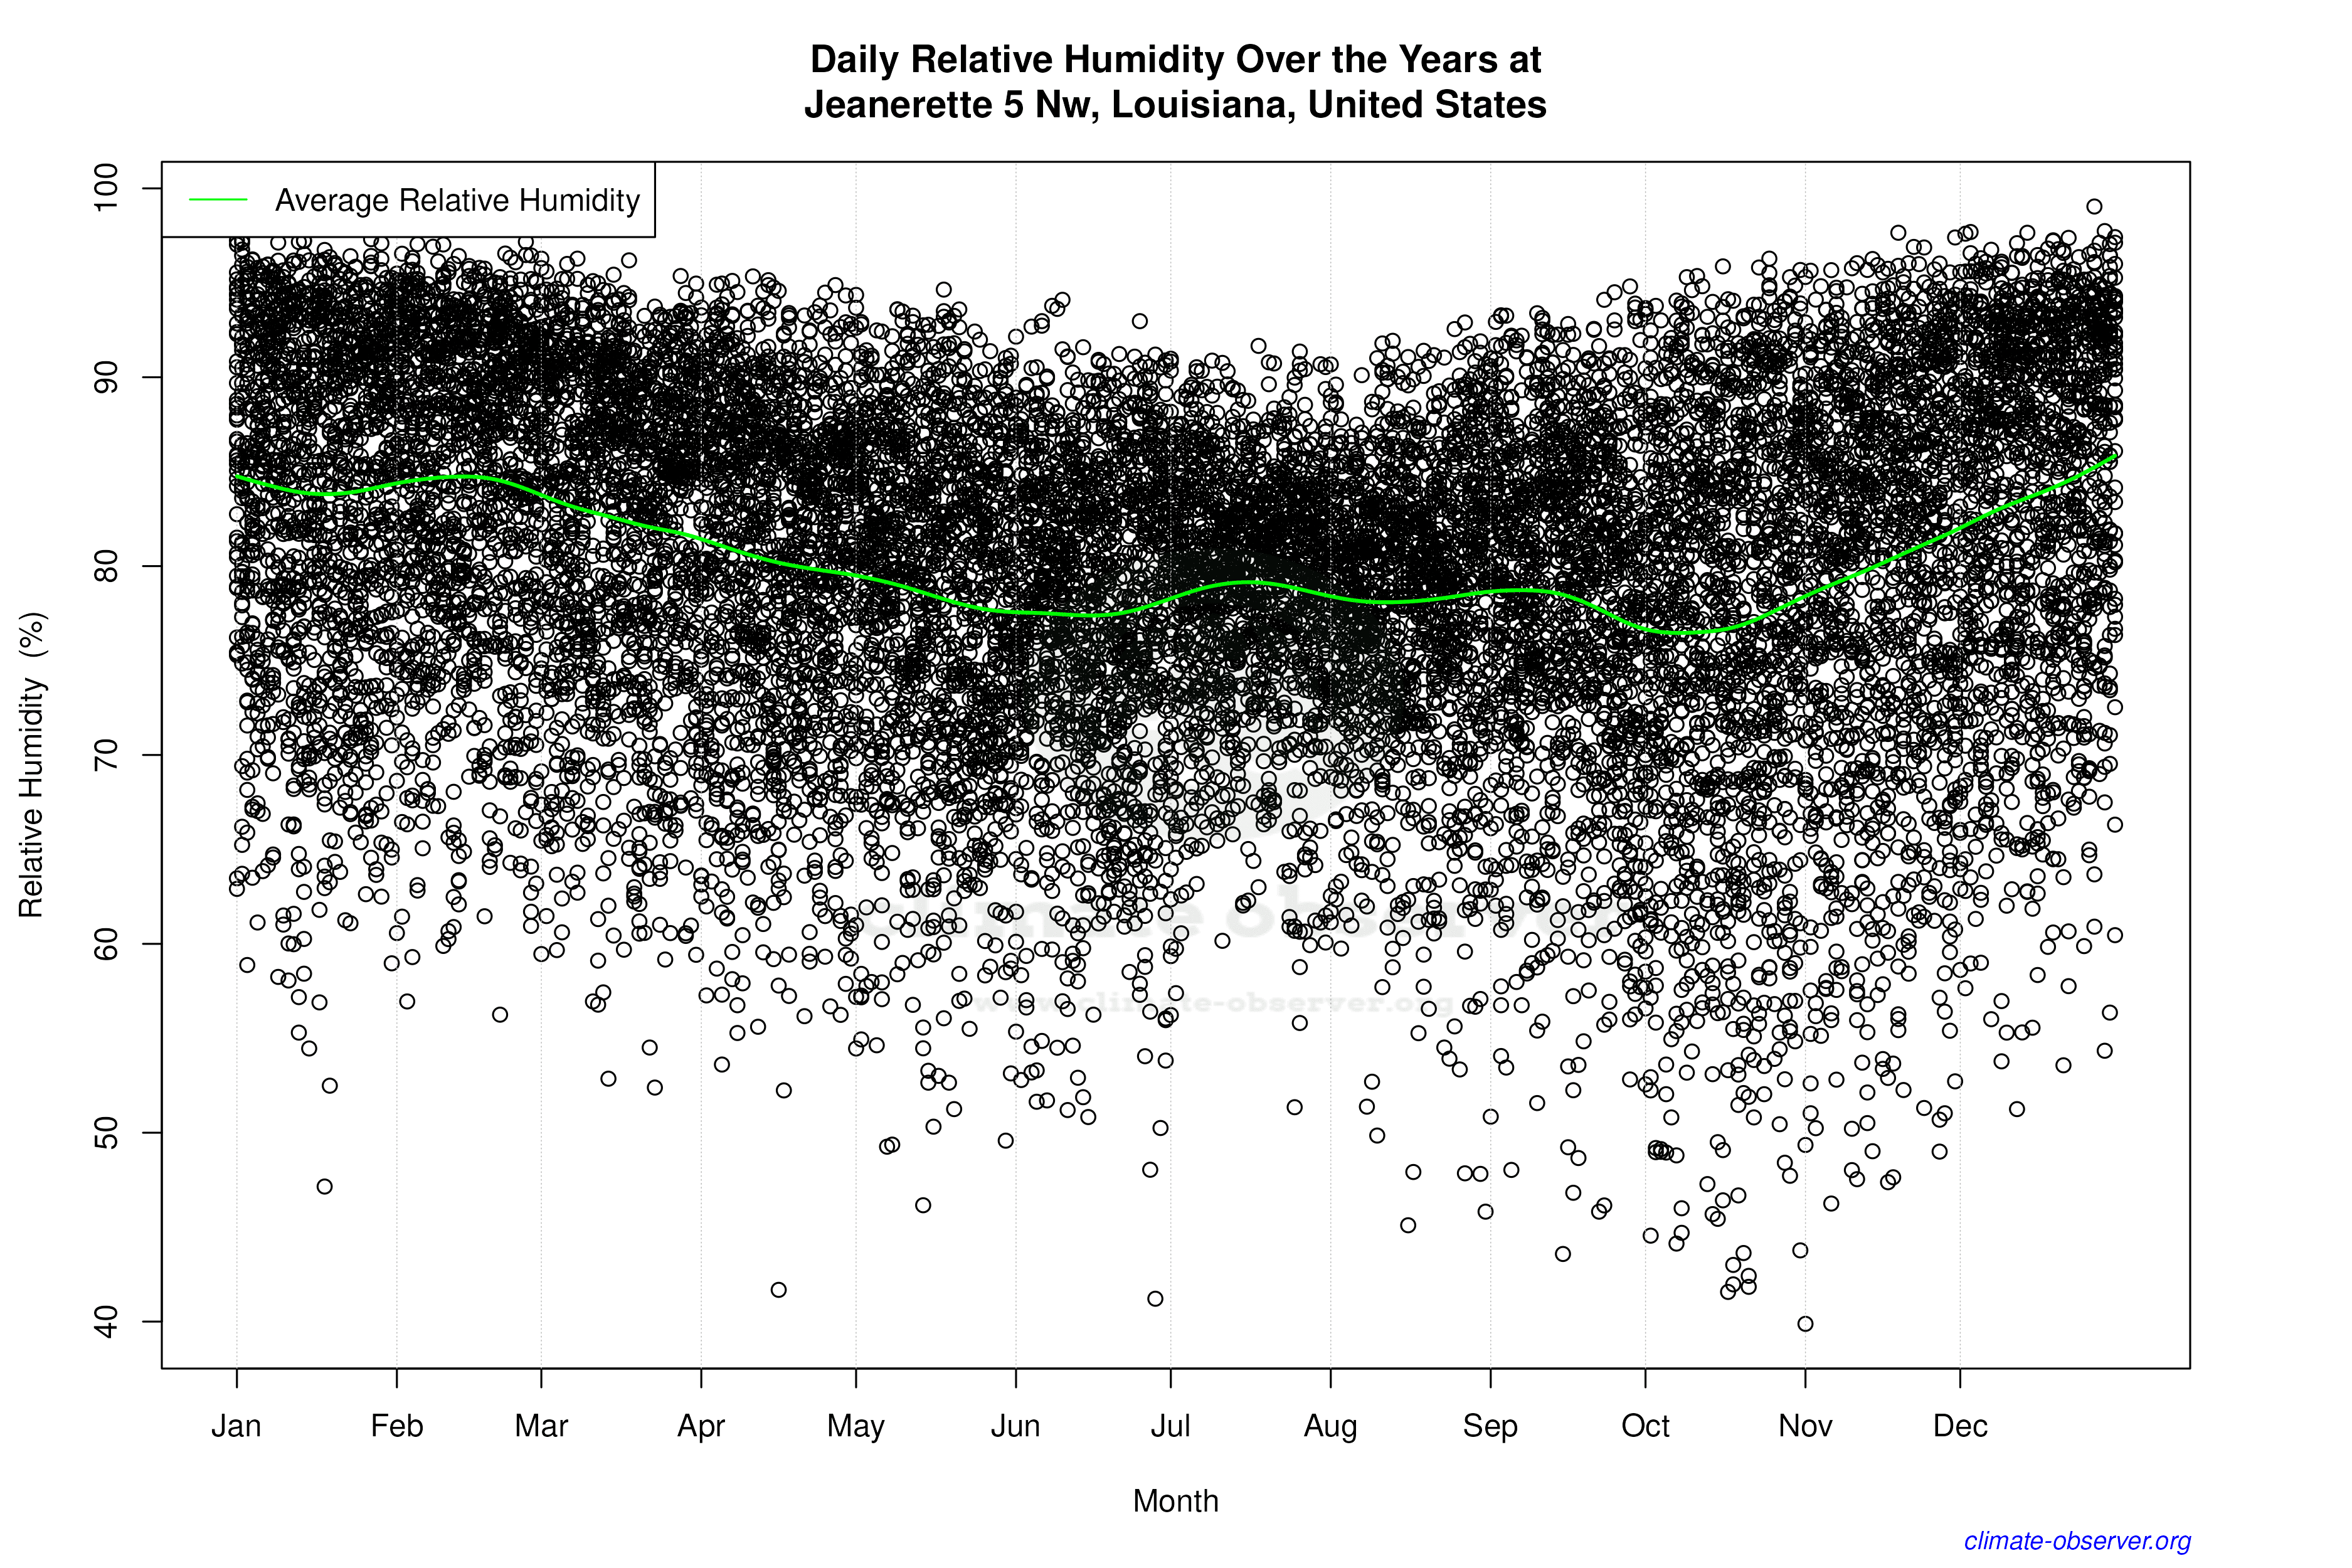

Average Max Temperature Throughout Year | 1 of 5
