Climate for Station: Blue Hill Coop, Massachusetts, United States
Loading live weather...
Climate Analysis & Overview
Blue Hill Coop's climate is characterised by a consistent warming trend over the past decades, with both high and low temperatures rising. While precipitation has become more evenly distributed, the overall warming trend aligns with regional climate goals to understand and mitigate climate impacts.
Regional Warming Patterns
Located at 42.2122°N, -71.1136°W, Blue Hill Coop in Milton, Massachusetts, experiences a Humid Continental climate (Dfb) according to the Köppen classification. This climate type is marked by cold winters and warm summers. The local geography, including the proximity to the Atlantic Ocean, influences both temperature and precipitation patterns. Over the past decade, the station has recorded a warming trend with high temperatures increasing by 0.33°C (0.59°F) and low temperatures by 0.26°C (0.47°F). This recent trend is more pronounced than the all-time trend, which shows a rise of 0.15°C (0.27°F) for highs and 0.13°C (0.24°F) for lows, indicating a consistent warming pattern over time.
Temperature Extremes and Records
The station's historical temperature records reveal a maximum of 38.3°C (100.9°F) and a minimum of -29.4°C (-20.9°F). These extremes highlight the variability inherent in the region's climate. The warming trends observed at Blue Hill Coop are consistent with broader regional patterns across the northeastern United States, where climate models predict continued warming. This aligns with national climate goals to monitor and adapt to these changes.
Precipitation Distribution Shifts
The Precipitation Concentration Index (PCI) is a measure of how precipitation is distributed over time, with higher values indicating more concentrated rainfall events. Blue Hill Coop's PCI has decreased from a baseline of 11.6 to a current value of 10.7, suggesting a more even distribution of precipitation. This marginal change indicates that rainfall is becoming less concentrated in intense events, which could have implications for local water management and agriculture.
Implications for Climate Adaptation
The observed trends at Blue Hill Coop are critical for understanding local climate dynamics. The consistent warming of both high and low temperatures suggests a need for adaptation strategies in line with regional climate resilience goals. The more even distribution of precipitation may reduce the risk of flooding from intense storms, a positive shift amidst the challenges posed by rising temperatures. As the northeastern United States continues to experience these shifts, ongoing monitoring and research at stations like Blue Hill Coop will be essential for informed decision-making and policy development.
Station Statistics
10-Year Trend
High: +0.59 °F/decade
Low: +0.36 °F/decade
Rain: -0.006 in/decade
25-Year Trend
High: +0.98 °F/decade
Low: +0.73 °F/decade
Rain: -0.010 in/decade
50-Year Trend
High: +0.57 °F/decade
Low: +0.65 °F/decade
Rain: +0.000 in/decade
All-Time Trend
High: +0.29 °F/decade
Low: +0.26 °F/decade
Rain: +0.001 in/decade
Percentage Above-Average Days
Last 12 Months: 52.1%
This Year: 56.3%
Precipitation Concentration Index (PCI) ℹ️
Last 12 Months: 9.0
Historical Average: 10.9
Percentile Rank of Last 12 Months ℹ️
High: 90th percentile
Low: 87th percentile
Rain: 17th percentile
Change in Variance ℹ️
High: -2.1%
Low: +2.6%
Intraday: -6.9%
Data Coverage
88.5%
First Year of Data
1885
Station Location
Historical Weather Records
| Max High | Avg High | Min High | Max Avg | Avg Avg | Min Avg | Max Low | Avg Low | Min Low | Max Precipitation | Avg Precipitation | Max Snow | Avg Snow | |
|---|---|---|---|---|---|---|---|---|---|---|---|---|---|
| Record | 100.94 °F | — | -2.92 °F | 90.50 °F | — | -2.92 °F | 78.98 °F | — | -20.92 °F | 8.07 in | — | 103.31 in | — |
| January | 68.00 °F | 33.86 °F | -0.94 °F | 62.60 °F | 28.92 °F | -2.92 °F | 55.04 °F | 18.39 °F | -14.98 °F | 3.10 in | 0.14 in | 21.42 in | 0.54 in |
| February | 71.06 °F | 35.02 °F | -0.94 °F | 62.60 °F | 30.72 °F | 0.50 °F | 48.92 °F | 18.86 °F | -20.92 °F | 3.10 in | 0.14 in | 103.31 in | 0.63 in |
| March | 89.06 °F | 43.30 °F | 8.96 °F | 72.86 °F | 38.16 °F | 10.04 °F | 57.92 °F | 26.84 °F | -5.08 °F | 3.49 in | 0.15 in | 17.60 in | 0.39 in |
| April | 93.92 °F | 55.01 °F | 21.02 °F | 76.64 °F | 48.12 °F | 19.04 °F | 64.04 °F | 36.64 °F | 6.08 °F | 3.47 in | 0.13 in | 15.00 in | 0.10 in |
| May | 96.08 °F | 66.35 °F | 35.96 °F | 84.20 °F | 58.06 °F | 40.28 °F | 71.96 °F | 46.68 °F | 26.96 °F | 3.75 in | 0.12 in | 5.00 in | 0.00 in |
| June | 98.96 °F | 74.68 °F | 44.96 °F | 88.70 °F | 67.24 °F | 46.76 °F | 78.08 °F | 55.70 °F | 30.92 °F | 3.92 in | 0.12 in | 0.00 in | 0.00 in |
| July | 100.04 °F | 80.20 °F | 55.04 °F | 89.60 °F | 73.07 °F | 55.94 °F | 78.98 °F | 61.86 °F | 44.06 °F | 4.46 in | 0.12 in | 0.00 in | 0.00 in |
| August | 100.94 °F | 78.13 °F | 55.94 °F | 90.50 °F | 71.37 °F | 51.98 °F | 78.98 °F | 60.55 °F | 32.00 °F | 8.07 in | 0.13 in | 0.00 in | 0.00 in |
| September | 98.96 °F | 71.03 °F | 48.92 °F | 82.94 °F | 64.08 °F | 42.98 °F | 73.04 °F | 53.76 °F | 28.04 °F | 5.23 in | 0.13 in | 0.20 in | 0.00 in |
| October | 87.98 °F | 60.46 °F | 32.00 °F | 75.92 °F | 53.92 °F | 29.30 °F | 68.00 °F | 43.56 °F | 19.94 °F | 5.92 in | 0.13 in | 6.81 in | 0.02 in |
| November | 80.96 °F | 49.04 °F | 17.96 °F | 71.78 °F | 44.20 °F | 19.22 °F | 62.96 °F | 33.65 °F | 5.00 °F | 4.26 in | 0.14 in | 15.98 in | 0.08 in |
| December | 73.94 °F | 37.80 °F | -2.92 °F | 64.76 °F | 33.84 °F | 0.86 °F | 53.96 °F | 23.08 °F | -18.94 °F | 3.94 in | 0.14 in | 20.31 in | 0.36 in |
Data Visualisations
Remove WatermarksCurrent Year Climate Trends vs Historical


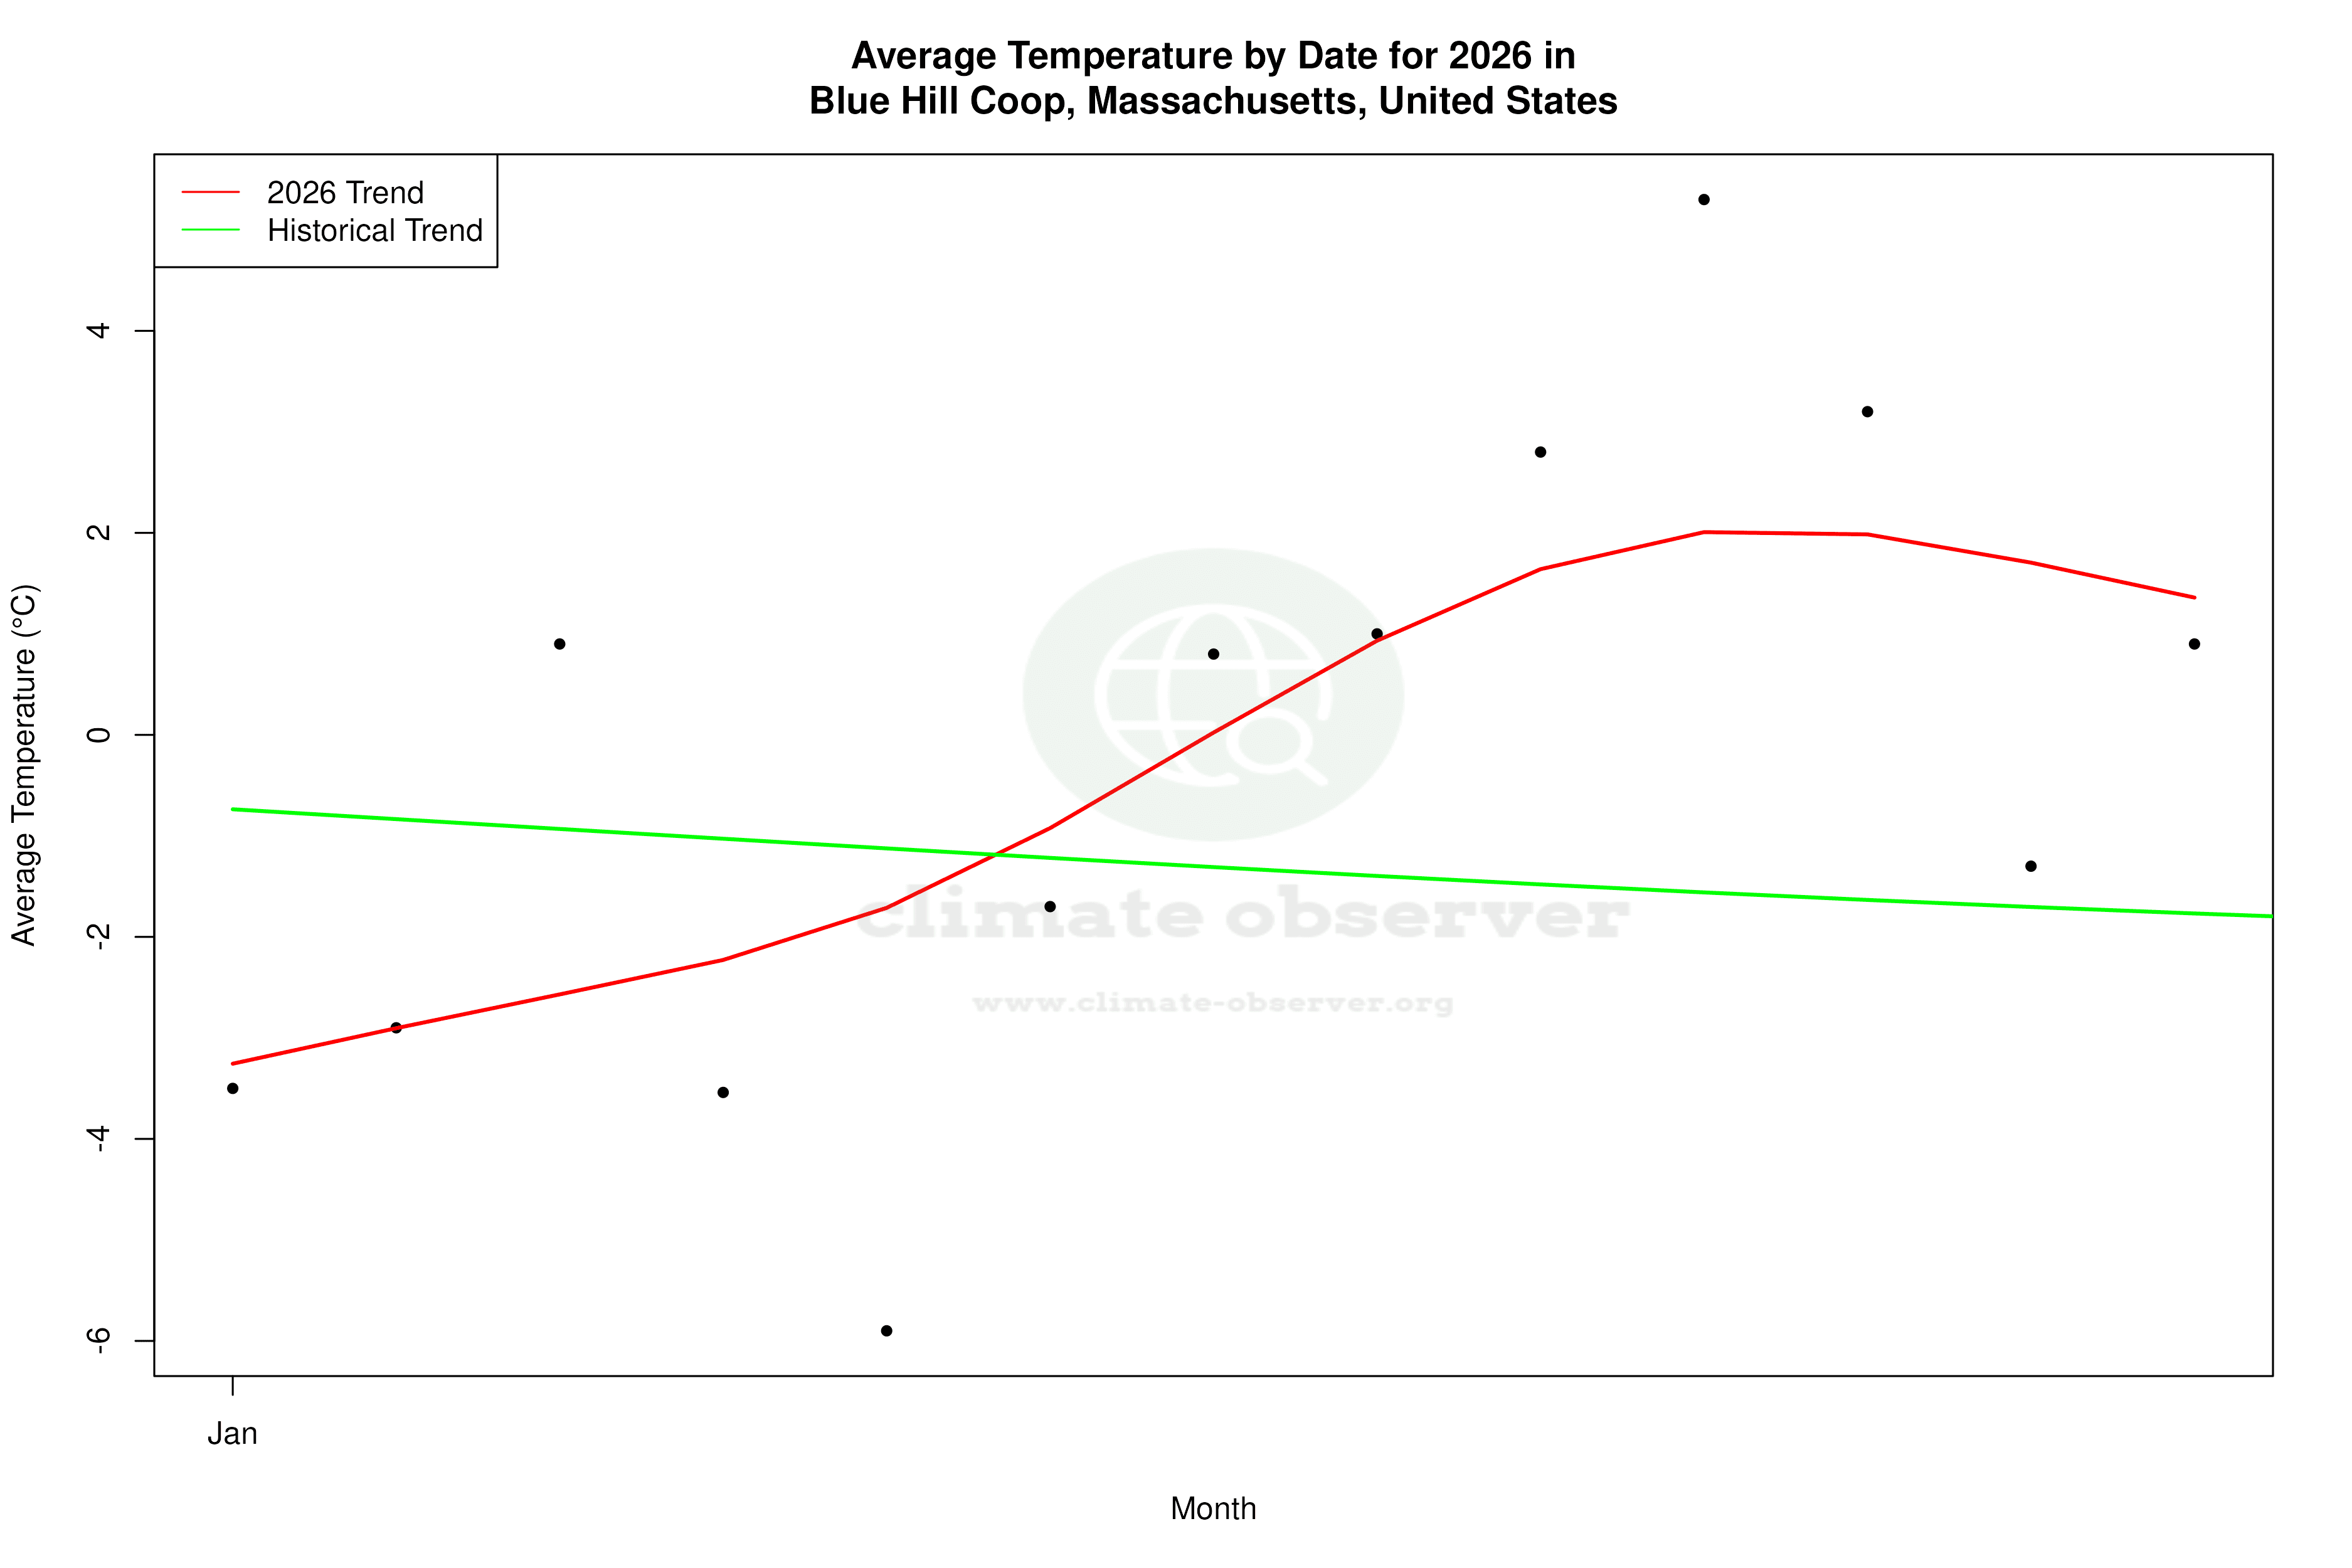


Max Temperature this Year | 1 of 6
Climate 12-Month Moving Averages


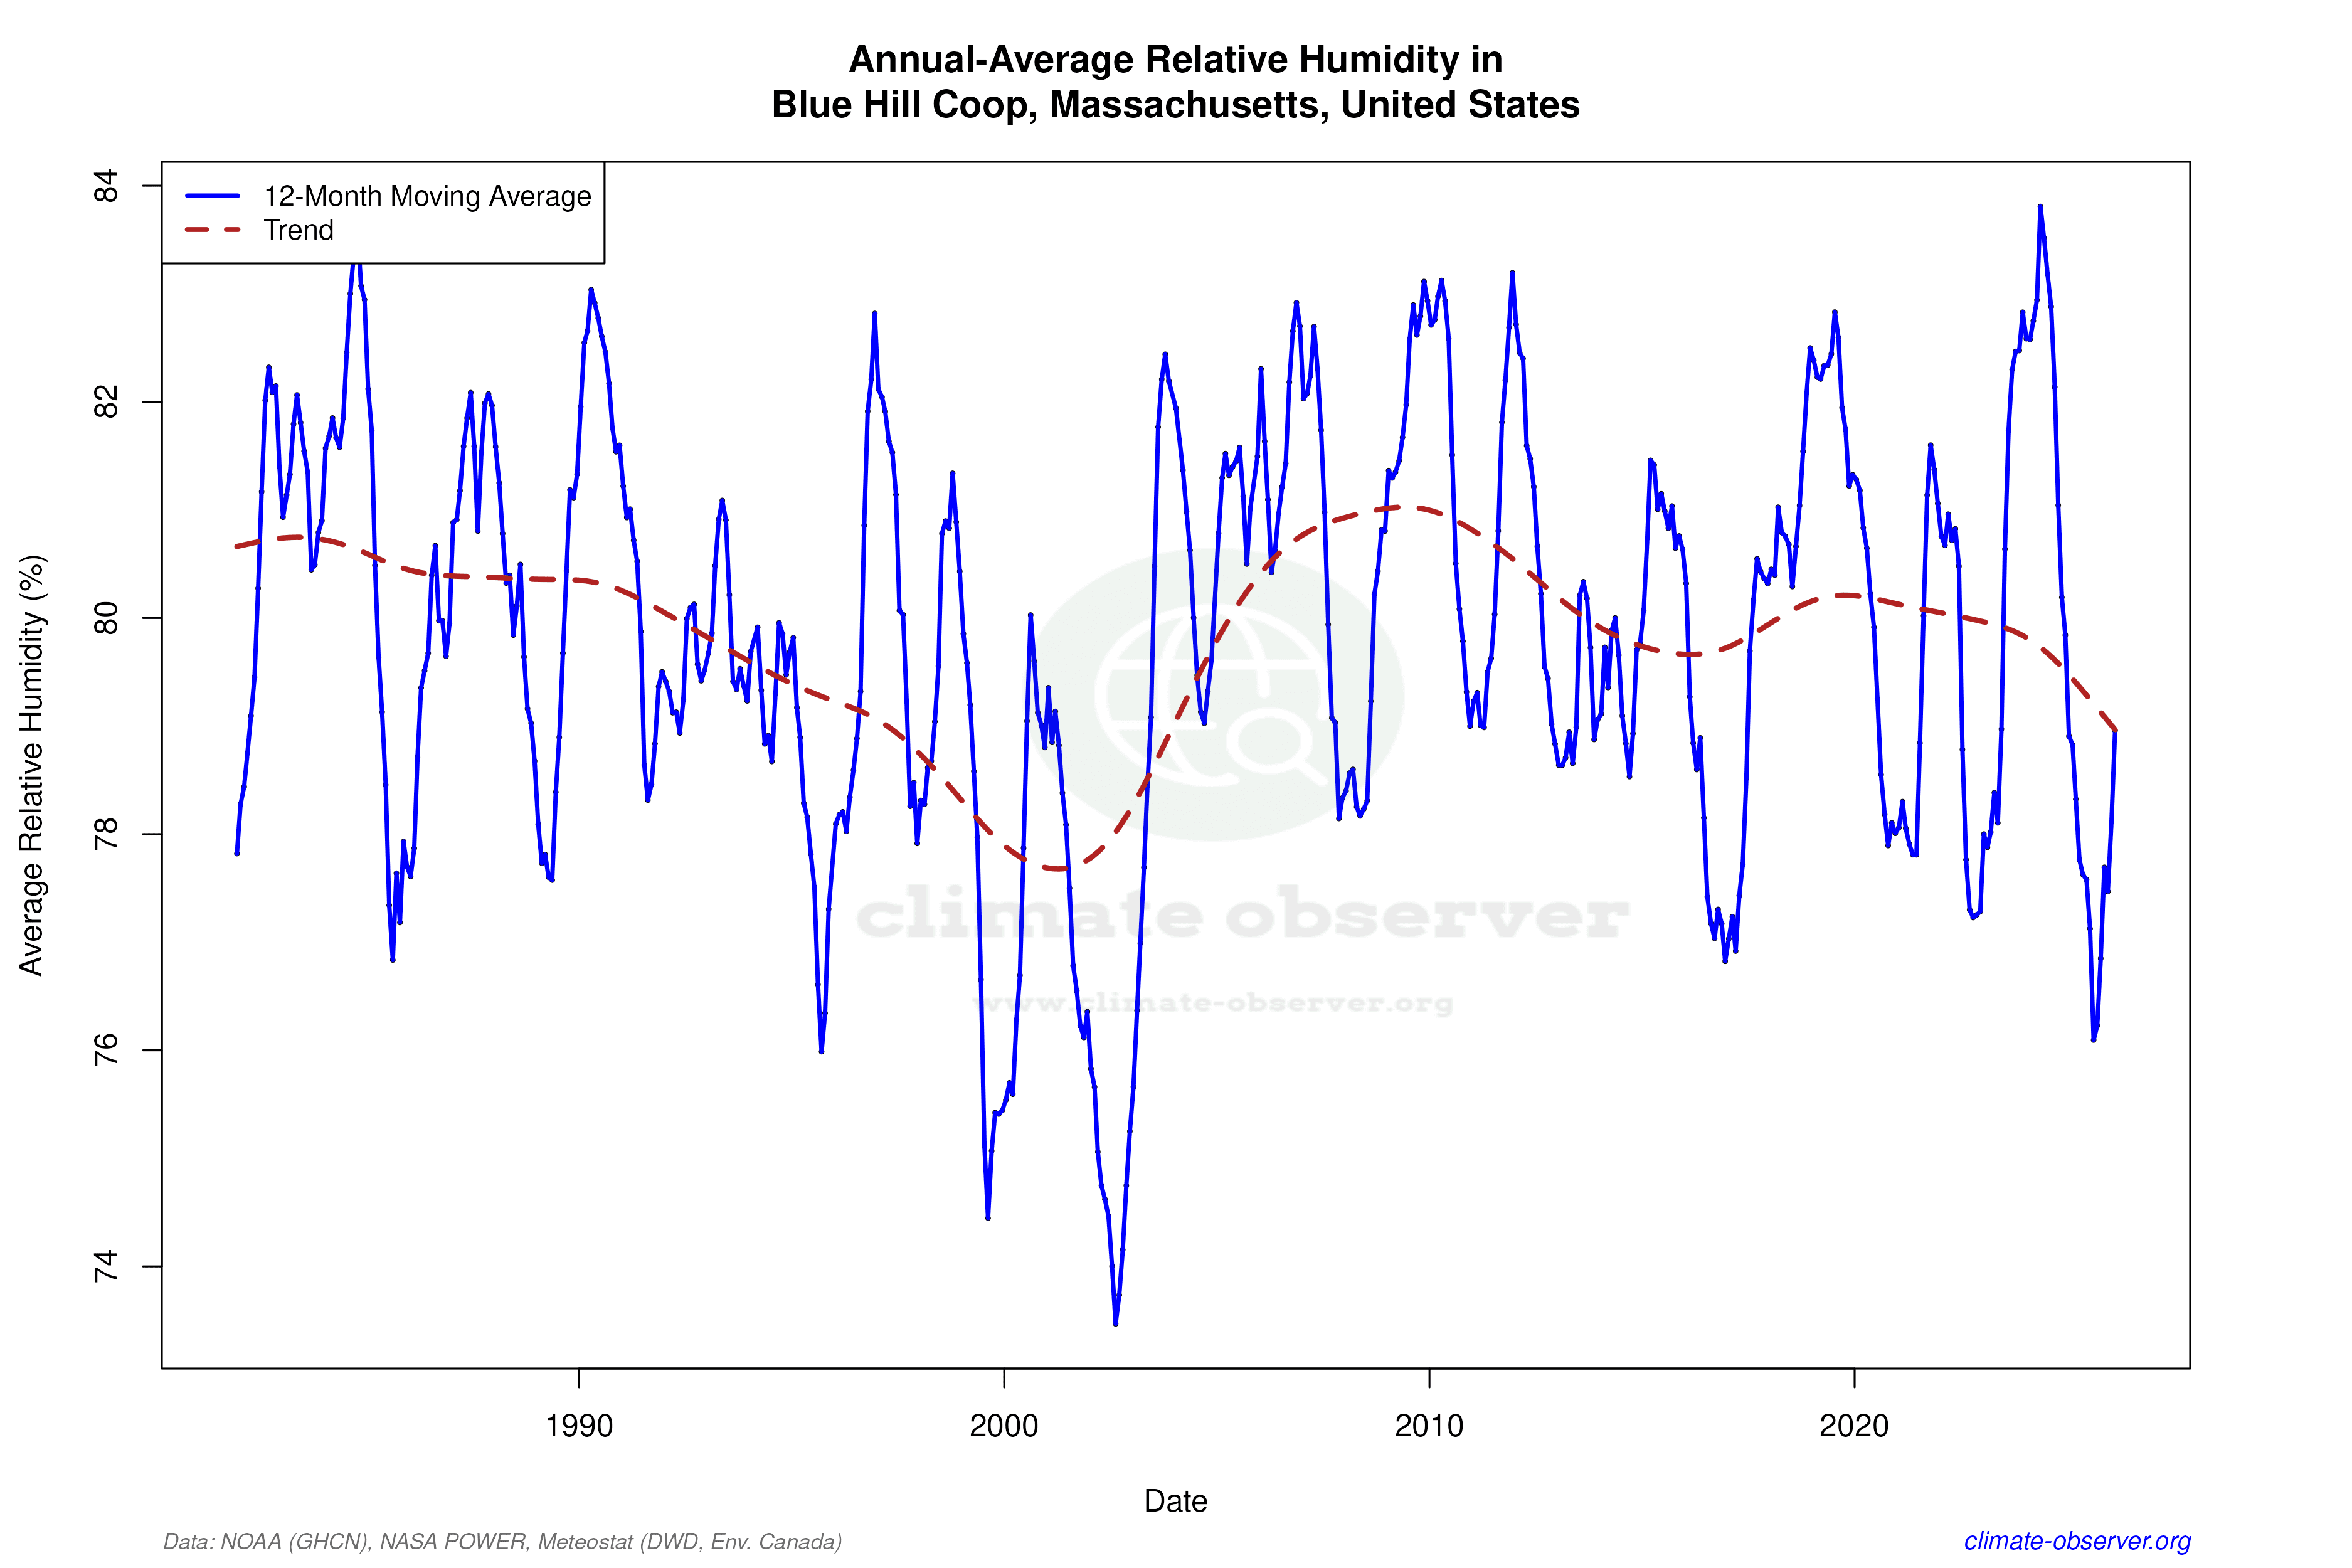

Max Temperature 12-Month MA | 1 of 6
Daily Data Points and Averages Throughout the Year
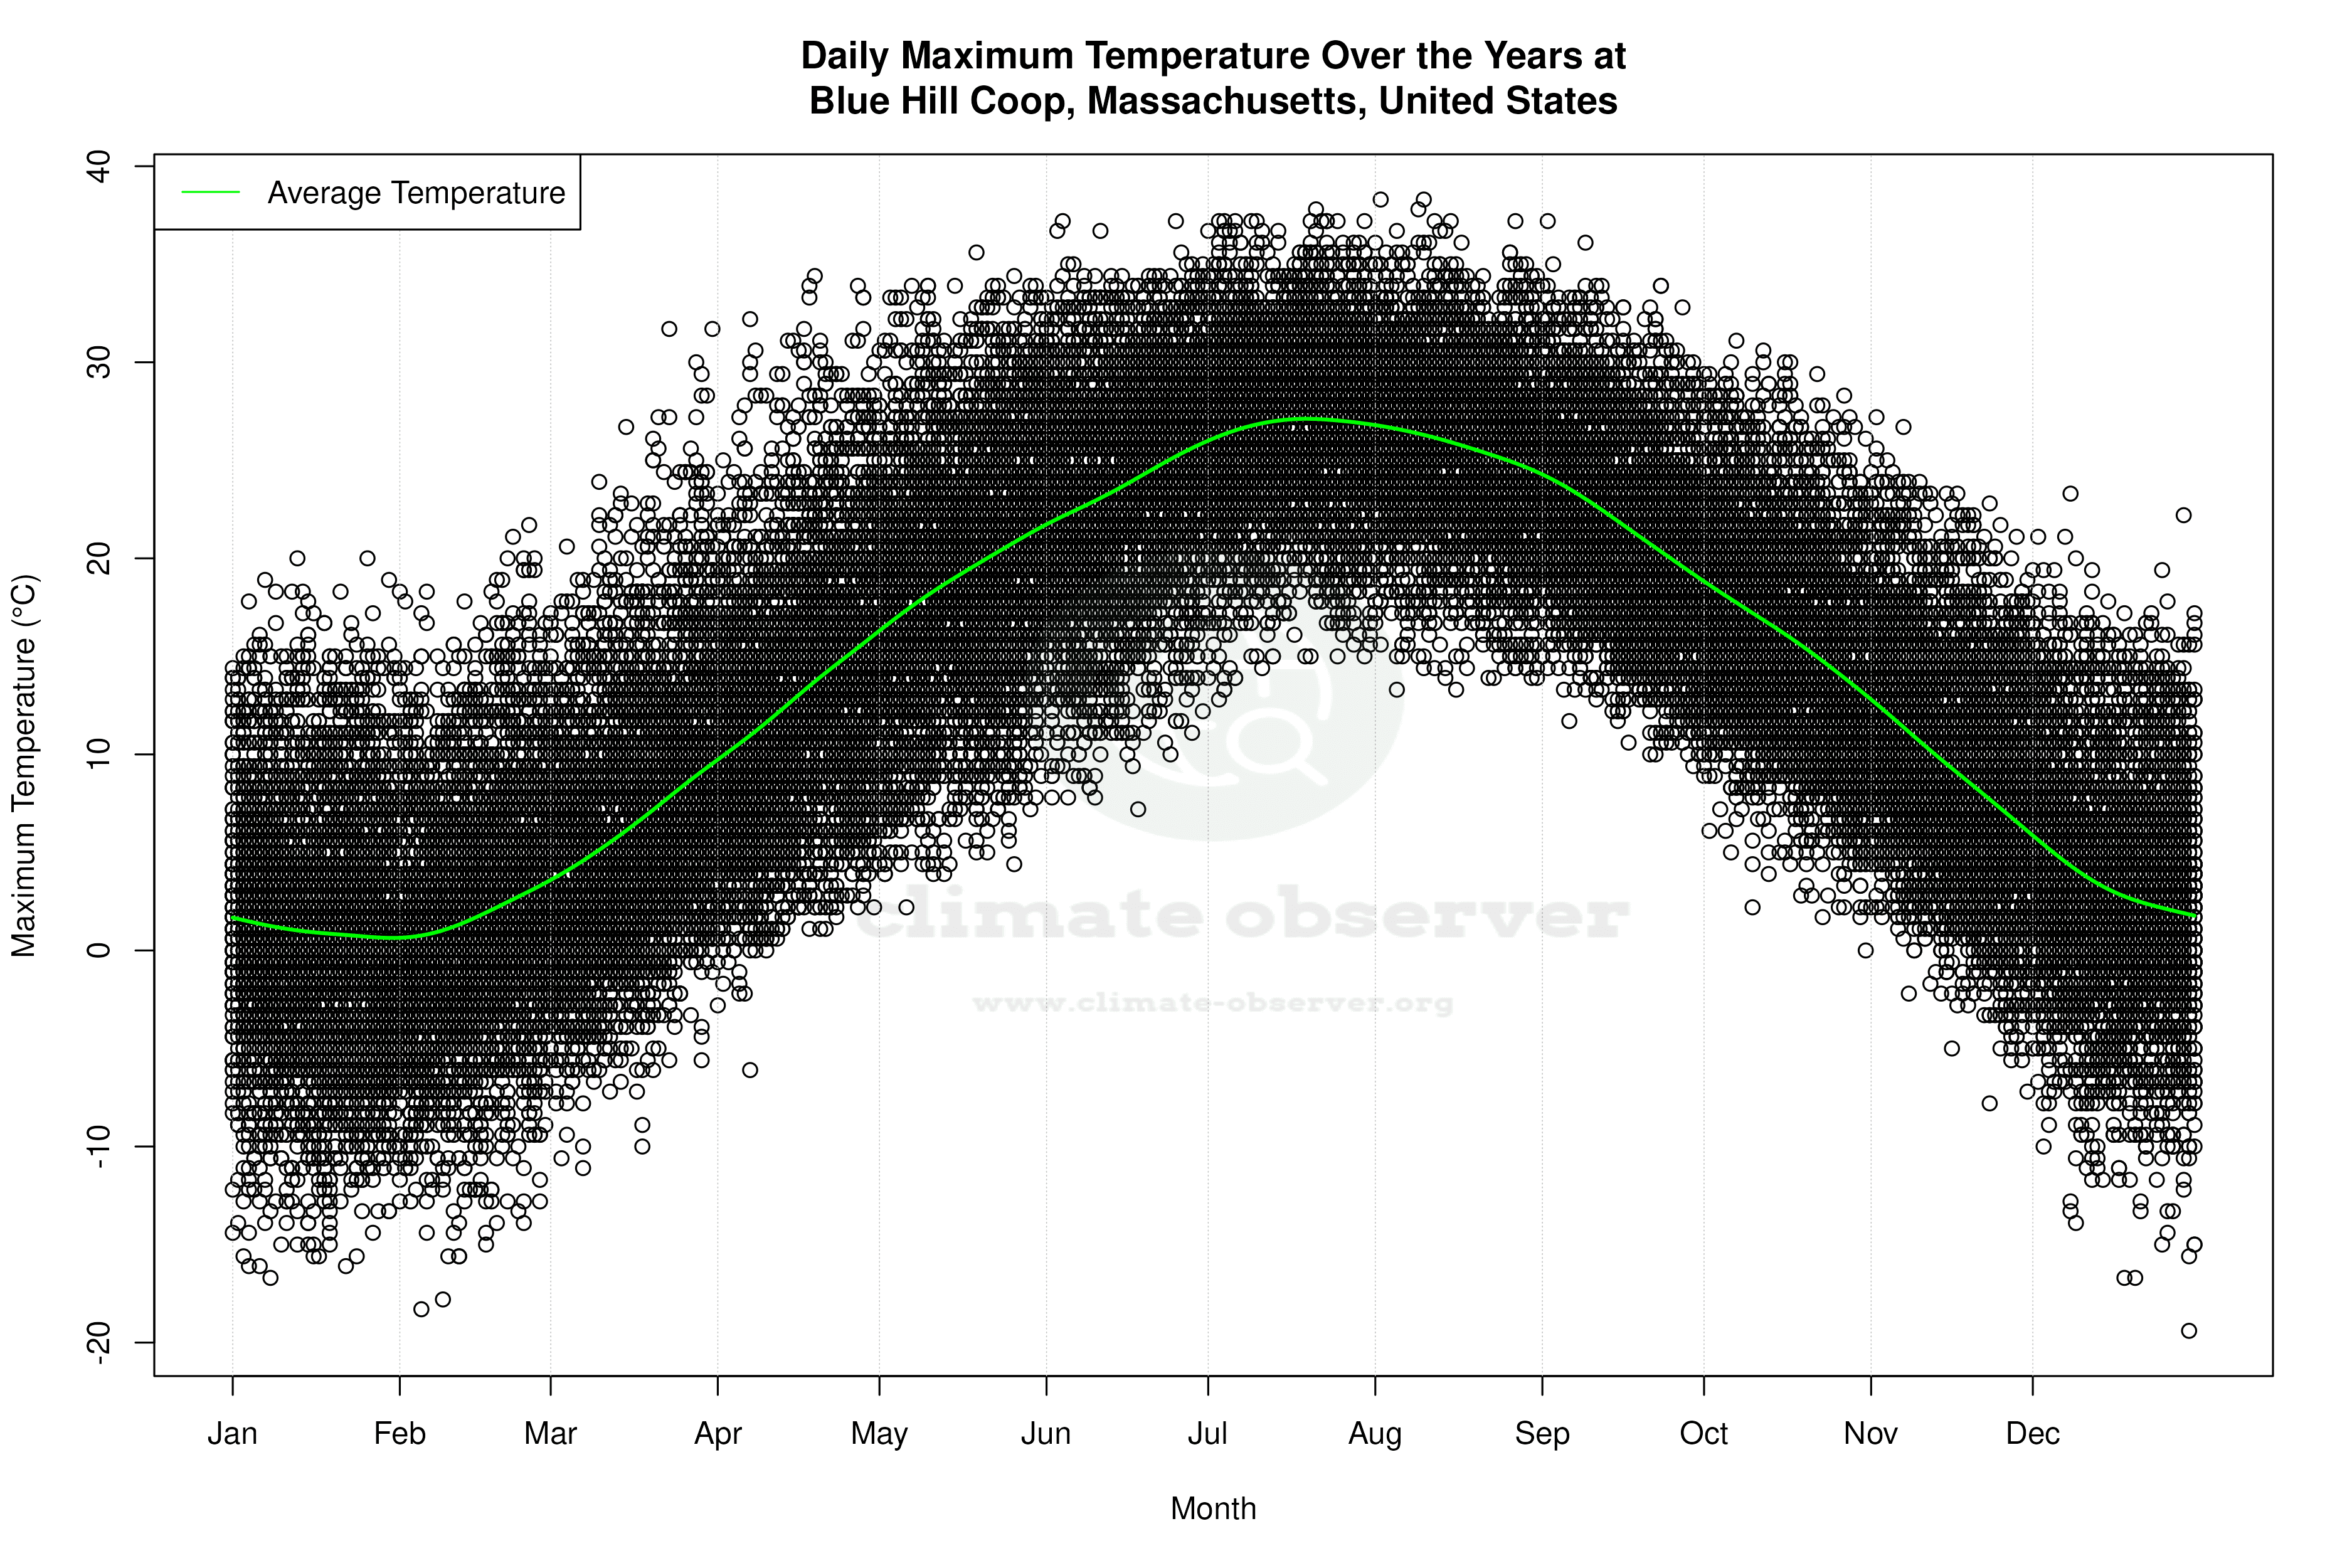


Average Max Temperature Throughout Year | 1 of 5
