Climate for Station: Cheboygan, Michigan, United States
Loading live weather...
Climate Analysis & Overview
Cheboygan's climate is marked by a slight cooling trend in all-time high temperatures, while lows show a modest warming. Recent years have seen more evenly distributed precipitation, contributing to a stable climate profile in this northern Michigan locale.
Cheboygan's Climate Classification and Geography
Cheboygan, located at 45.6522°N, 84.4725°W, falls under the Köppen climate classification of Dfb, indicating a humid continental climate with warm summers and cold, snowy winters. Nestled near Lake Huron, the city's climate is influenced by the lake's moderating effects, which can lead to milder winters and cooler summers compared to inland areas. The proximity to water bodies also impacts local precipitation patterns, often resulting in lake-effect snow during the winter months.
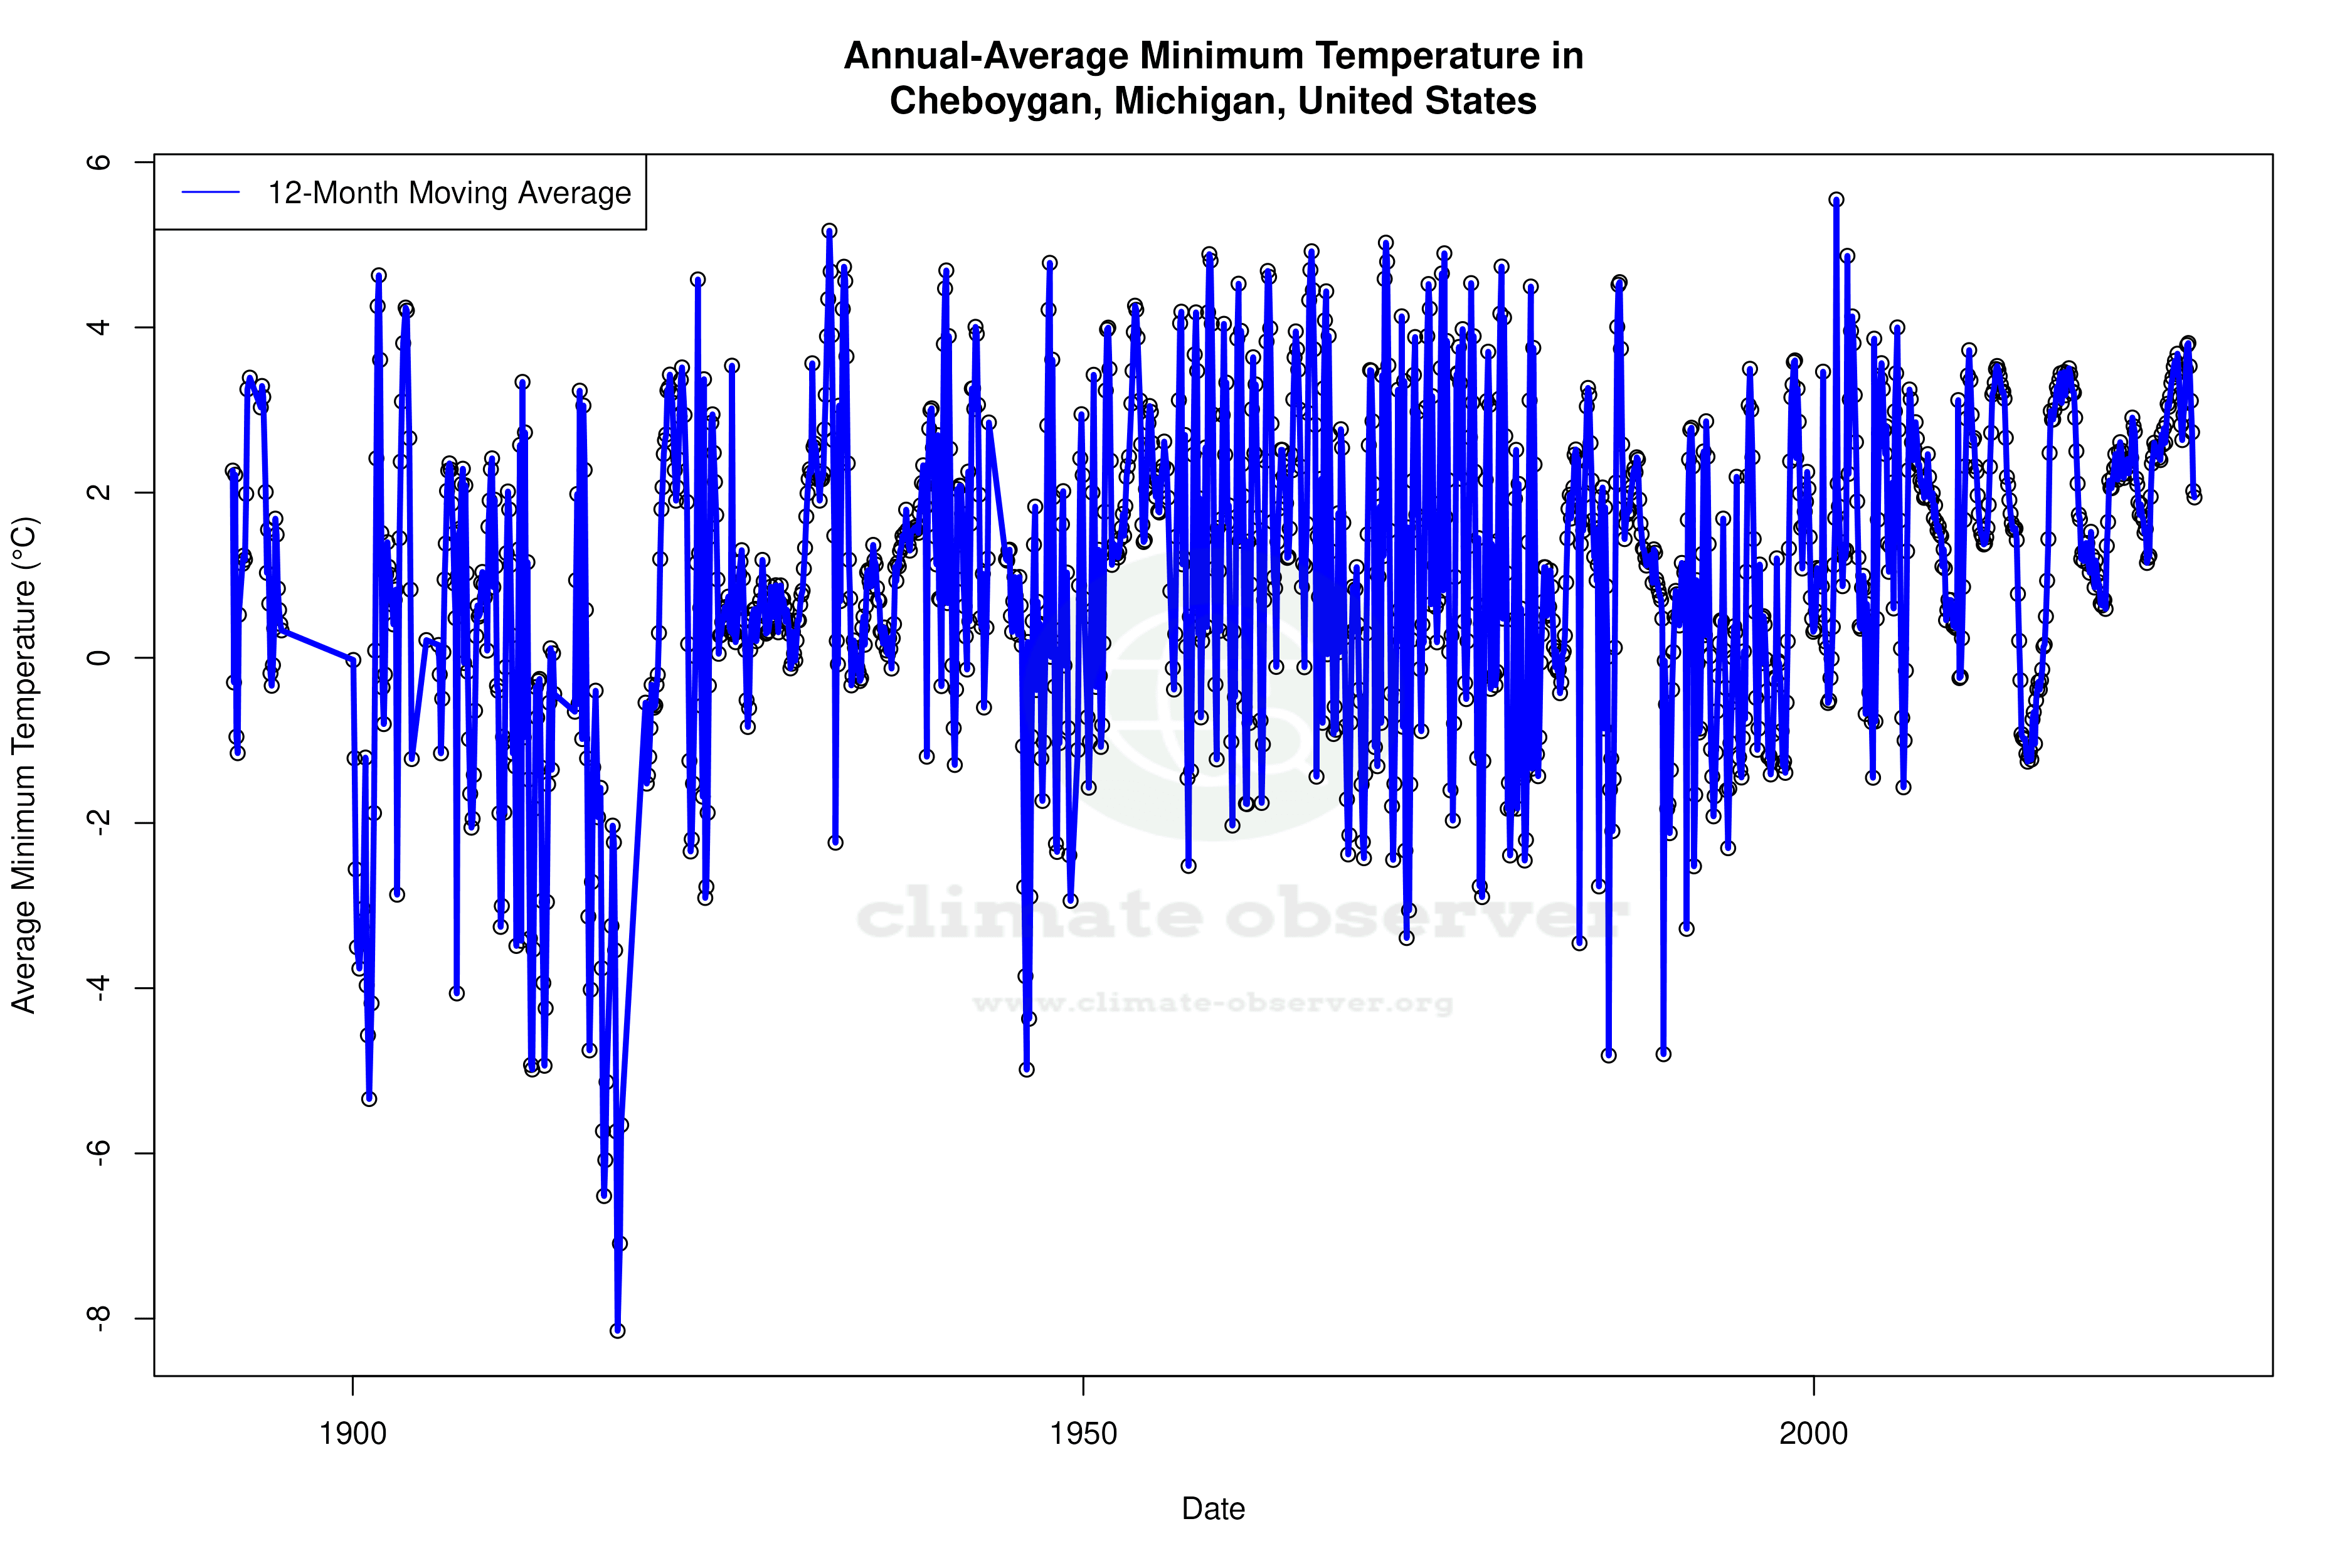
Temperature Trends: A Tale of Two Scales
Over the past decade, Cheboygan has experienced a warming trend in high temperatures, with an increase of 0.90°C (1.62°F). However, when examining the all-time data, a slight cooling trend emerges, with high temperatures showing a decrease of 0.00°C (0.00°F). In contrast, low temperatures have risen by 0.12°C (0.22°F) over the long term, indicating a subtle warming trend. This divergence between short-term and long-term trends highlights the complexity of climate dynamics in the region.
Precipitation Patterns: A More Even Distribution
The Precipitation Concentration Index (PCI) for Cheboygan has decreased from a baseline of 11.4 to a current value of 9.7. This shift suggests that precipitation events are now more evenly distributed throughout the year, reducing the likelihood of intense, concentrated rainfall events. A more even distribution can help mitigate the risks of flooding and drought, contributing to a more stable hydrological environment.
Record Extremes: A Spectrum of Temperatures
Cheboygan's climate records reveal a wide range of temperatures, with an all-time high of 40.0°C (104.0°F) and a chilling low of -47.2°C (-53.0°F). These extremes underscore the city's capacity for significant temperature variability, a characteristic feature of continental climates. Such variability necessitates adaptive strategies for both residents and local infrastructure to cope with the challenges posed by extreme weather conditions.
Regional Climate Goals and Adaptation
In the context of the United States' broader climate goals, which include reducing greenhouse gas emissions and enhancing climate resilience, Cheboygan's evolving climate patterns offer both challenges and opportunities. The shift towards more evenly distributed precipitation aligns with efforts to manage water resources sustainably. As the region continues to adapt to these changes, ongoing monitoring and analysis will be crucial in informing local climate strategies and ensuring the community's resilience in the face of a changing climate.
Station Statistics
10-Year Trend
High: +1.98 °F/decade
Low: +0.67 °F/decade
Rain: -0.005 in/decade
25-Year Trend
High: +0.36 °F/decade
Low: +0.45 °F/decade
Rain: +0.005 in/decade
50-Year Trend
High: +0.54 °F/decade
Low: +0.75 °F/decade
Rain: +0.003 in/decade
All-Time Trend
High: -0.00 °F/decade
Low: +0.22 °F/decade
Rain: +0.001 in/decade
Percentage Above-Average Days
Last 12 Months: 49.9%
This Year: 43.3%
Precipitation Concentration Index (PCI) ℹ️
Last 12 Months: 10.3
Historical Average: 10.4
Percentile Rank of Last 12 Months ℹ️
High: 67th percentile
Low: 85th percentile
Rain: 89th percentile
Change in Variance ℹ️
High: -7.4%
Low: -12.0%
Intraday: -18.0%
Data Coverage
84.3%
First Year of Data
1891
Station Location
Historical Weather Records
| Max High | Avg High | Min High | Max Avg | Avg Avg | Min Avg | Max Low | Avg Low | Min Low | Max Precipitation | Avg Precipitation | Max Snow | Avg Snow | |
|---|---|---|---|---|---|---|---|---|---|---|---|---|---|
| Record | 104.00 °F | — | -13.00 °F | 86.18 °F | — | -15.52 °F | 89.96 °F | — | -52.96 °F | 3.18 in | — | 20.98 in | — |
| January | 59.00 °F | 27.28 °F | -5.08 °F | 47.12 °F | 19.64 °F | -10.84 °F | 39.92 °F | 11.10 °F | -45.04 °F | 2.60 in | 0.06 in | 14.02 in | 0.66 in |
| February | 62.06 °F | 28.26 °F | -13.00 °F | 51.26 °F | 20.20 °F | -15.52 °F | 42.08 °F | 9.06 °F | -52.96 °F | 2.23 in | 0.05 in | 15.98 in | 0.55 in |
| March | 82.04 °F | 37.34 °F | 5.00 °F | 64.94 °F | 28.54 °F | -3.82 °F | 50.00 °F | 17.91 °F | -43.06 °F | 2.89 in | 0.06 in | 20.98 in | 0.38 in |
| April | 89.96 °F | 50.27 °F | 21.92 °F | 77.18 °F | 40.19 °F | 12.38 °F | 60.08 °F | 30.21 °F | -2.02 °F | 2.88 in | 0.08 in | 10.00 in | 0.12 in |
| May | 93.02 °F | 62.97 °F | 33.98 °F | 78.08 °F | 52.11 °F | 31.64 °F | 71.06 °F | 40.18 °F | 10.04 °F | 2.22 in | 0.09 in | 5.98 in | 0.01 in |
| June | 96.08 °F | 73.27 °F | 44.96 °F | 83.30 °F | 61.71 °F | 44.78 °F | 78.08 °F | 50.48 °F | 15.98 °F | 3.03 in | 0.09 in | 0.00 in | 0.00 in |
| July | 102.92 °F | 78.96 °F | 55.04 °F | 85.10 °F | 67.24 °F | 50.63 °F | 89.96 °F | 56.71 °F | 24.98 °F | 2.26 in | 0.09 in | 0.00 in | 0.00 in |
| August | 104.00 °F | 77.15 °F | 51.98 °F | 86.18 °F | 65.79 °F | 44.60 °F | 75.92 °F | 55.64 °F | 26.06 °F | 3.07 in | 0.10 in | 0.00 in | 0.00 in |
| September | 96.98 °F | 69.56 °F | 44.06 °F | 79.52 °F | 58.13 °F | 36.50 °F | 75.02 °F | 48.99 °F | 21.02 °F | 2.49 in | 0.11 in | 0.51 in | 0.00 in |
| October | 89.06 °F | 57.60 °F | 28.94 °F | 75.38 °F | 46.97 °F | 27.50 °F | 68.00 °F | 39.10 °F | 12.92 °F | 2.40 in | 0.10 in | 10.98 in | 0.02 in |
| November | 78.08 °F | 43.29 °F | 12.92 °F | 67.82 °F | 36.29 °F | 9.68 °F | 55.94 °F | 29.14 °F | -5.08 °F | 1.83 in | 0.08 in | 12.01 in | 0.24 in |
| December | 64.04 °F | 32.03 °F | -0.04 °F | 56.48 °F | 26.01 °F | -10.84 °F | 51.08 °F | 18.64 °F | -31.00 °F | 3.18 in | 0.06 in | 19.29 in | 0.60 in |
Data Visualisations
Remove WatermarksCurrent Year Climate Trends vs Historical


Max Temperature this Year | 1 of 6
Climate 12-Month Moving Averages


Max Temperature 12-Month MA | 1 of 6
Daily Data Points and Averages Throughout the Year


Average Max Temperature Throughout Year | 1 of 5
