Climate for Station: Biloxi, Mississippi, United States
Loading live weather...
Climate Analysis & Overview
Biloxi's climate reflects a complex interplay of warming and cooling trends, with recent years showing a notable rise in high temperatures. The precipitation pattern has become more evenly distributed, suggesting a shift towards a more balanced rainfall regime.
Coastal Climate Dynamics
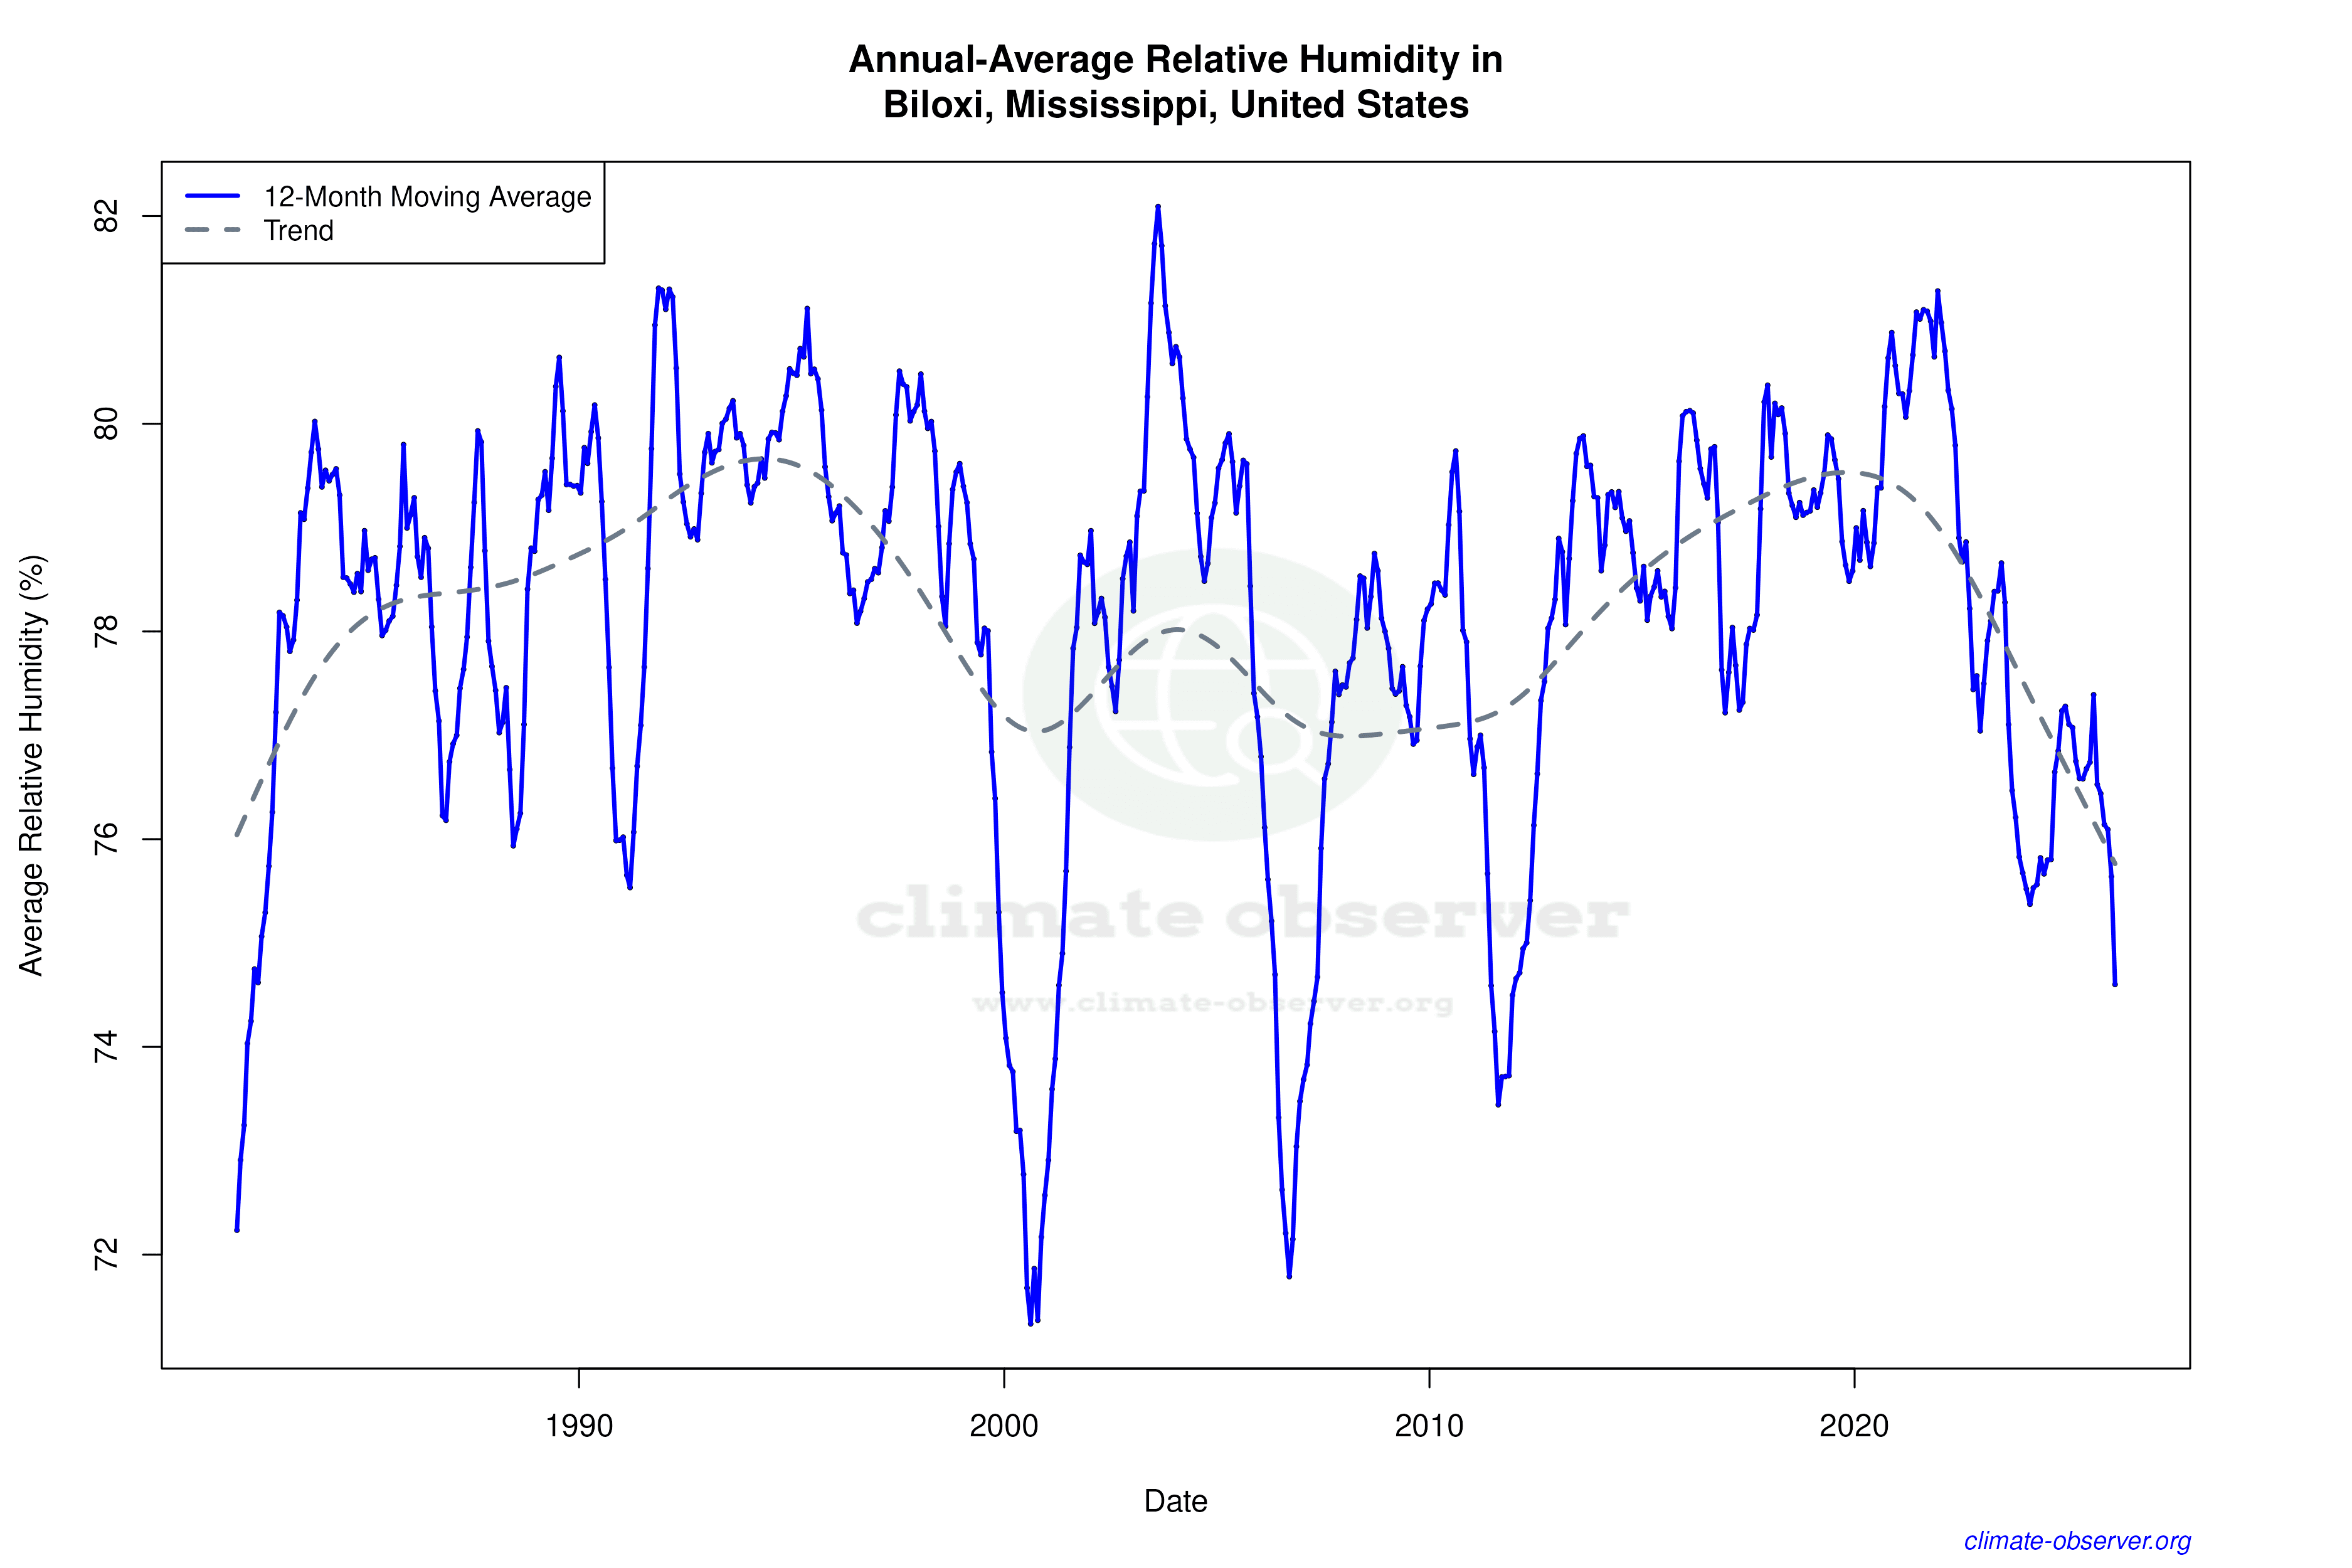
Biloxi, located along the Gulf Coast of Mississippi, experiences a humid subtropical climate, classified as Cfa in the Köppen system. This classification is characterized by hot, humid summers and mild winters, heavily influenced by its proximity to the Gulf of Mexico. The local geography, with its coastal positioning, plays a critical role in moderating temperatures and contributing to the area's humidity levels.
Temperature Trends: A Tale of Two Scales
Over the past decade, Biloxi has witnessed a significant warming trend in high temperatures, with an increase of 1.79°C (3.22°F). This contrasts sharply with the all-time trend, which shows a negligible warming of 0.01°C (0.02°F). In terms of low temperatures, the 10-year trend indicates a slight cooling of 0.11°C (0.20°F), while the all-time trend reveals a warming of 0.05°C (0.09°F). These contrasting trends highlight the complexity of climate dynamics in the region, where short-term fluctuations can differ from long-term patterns.
Precipitation Patterns: Towards Even Distribution
The Precipitation Concentration Index (PCI) for Biloxi has decreased from a baseline of 12.05 to a current value of 10.73. This indicates a more even distribution of rainfall events over time. A PCI value under 10 is considered very even, and although Biloxi's current PCI is slightly above this threshold, the decrease suggests a trend towards more balanced precipitation. This shift could have implications for local water management and agricultural practices, as more evenly distributed rainfall can reduce the risk of both droughts and floods.
Record Extremes: A Snapshot of Variability
Biloxi's climate records reveal significant temperature extremes, with a maximum recorded temperature of 40.0°C (104.0°F) and a minimum of -17.2°C (1.0°F). These extremes underscore the variability inherent in the region's climate, influenced by both local and broader atmospheric conditions. Such records provide valuable context for understanding the potential impacts of future climate variability and change.
Regional Climate Context
Biloxi's climate trends should be considered within the broader context of regional climate goals and recent weather events. The United States has been focusing on reducing greenhouse gas emissions and enhancing resilience to climate impacts. Recent hurricanes and extreme weather events along the Gulf Coast have highlighted the importance of adaptive strategies to mitigate the effects of climate change. Understanding Biloxi's unique climate profile is crucial for informing these strategies and ensuring the community's resilience in the face of ongoing environmental challenges.
Station Statistics
10-Year Trend
High: +2.61 °F/decade
Low: +0.00 °F/decade
Rain: -0.037 in/decade
25-Year Trend
High: +0.49 °F/decade
Low: +0.66 °F/decade
Rain: +0.002 in/decade
50-Year Trend
High: +0.08 °F/decade
Low: +0.41 °F/decade
Rain: -0.003 in/decade
All-Time Trend
High: -0.02 °F/decade
Low: +0.06 °F/decade
Rain: +0.001 in/decade
Percentage Above-Average Days
Last 12 Months: 60.5%
This Year: 70.9%
Precipitation Concentration Index (PCI) ℹ️
Last 12 Months: 12.7
Historical Average: 11.9
Percentile Rank of Last 12 Months ℹ️
High: 85th percentile
Low: 83rd percentile
Rain: 44th percentile
Change in Variance ℹ️
High: -3.9%
Low: +0.8%
Intraday: -5.4%
Data Coverage
88.1%
First Year of Data
1893
Station Location
Historical Weather Records
| Max High | Avg High | Min High | Max Avg | Avg Avg | Min Avg | Max Low | Avg Low | Min Low | Max Precipitation | Avg Precipitation | Max Snow | Avg Snow | |
|---|---|---|---|---|---|---|---|---|---|---|---|---|---|
| Record | 104.00 °F | — | 26.24 °F | 95.00 °F | — | 19.22 °F | 87.98 °F | — | 1.04 °F | 10.60 in | — | 6.30 in | — |
| January | 82.04 °F | 60.65 °F | 30.02 °F | 73.58 °F | 51.83 °F | 19.40 °F | 71.96 °F | 43.97 °F | 3.02 °F | 8.96 in | 0.15 in | 5.31 in | 0.00 in |
| February | 87.08 °F | 63.16 °F | 30.92 °F | 75.02 °F | 55.43 °F | 22.28 °F | 69.98 °F | 46.47 °F | 1.04 °F | 5.80 in | 0.17 in | 6.30 in | 0.00 in |
| March | 89.06 °F | 69.39 °F | 37.04 °F | 78.80 °F | 61.36 °F | 33.26 °F | 75.02 °F | 52.96 °F | 21.92 °F | 10.50 in | 0.19 in | 2.01 in | 0.00 in |
| April | 91.04 °F | 75.99 °F | 48.92 °F | 81.68 °F | 68.42 °F | 45.50 °F | 80.06 °F | 59.94 °F | 30.02 °F | 7.73 in | 0.17 in | 0.00 in | 0.00 in |
| May | 98.06 °F | 82.95 °F | 66.92 °F | 86.54 °F | 75.85 °F | 55.76 °F | 82.04 °F | 67.27 °F | 42.08 °F | 7.18 in | 0.16 in | 0.00 in | 0.00 in |
| June | 102.02 °F | 88.32 °F | 69.98 °F | 89.78 °F | 81.19 °F | 68.18 °F | 84.02 °F | 73.18 °F | 55.04 °F | 10.60 in | 0.19 in | 0.00 in | 0.00 in |
| July | 102.92 °F | 89.80 °F | 75.02 °F | 91.04 °F | 82.47 °F | 72.86 °F | 87.98 °F | 74.70 °F | 60.08 °F | 7.82 in | 0.24 in | 0.00 in | 0.00 in |
| August | 104.00 °F | 90.01 °F | 75.02 °F | 95.00 °F | 82.17 °F | 70.52 °F | 84.92 °F | 74.42 °F | 63.37 °F | 8.50 in | 0.21 in | 0.00 in | 0.00 in |
| September | 100.94 °F | 86.96 °F | 66.92 °F | 88.34 °F | 78.66 °F | 59.72 °F | 84.02 °F | 70.71 °F | 48.02 °F | 8.55 in | 0.19 in | 0.00 in | 0.00 in |
| October | 98.06 °F | 79.45 °F | 48.02 °F | 87.98 °F | 69.78 °F | 40.64 °F | 80.96 °F | 60.70 °F | 32.00 °F | 9.80 in | 0.11 in | 0.00 in | 0.00 in |
| November | 87.98 °F | 69.61 °F | 33.08 °F | 80.60 °F | 60.50 °F | 33.80 °F | 75.92 °F | 51.30 °F | 24.08 °F | 5.91 in | 0.12 in | 0.00 in | 0.00 in |
| December | 87.98 °F | 62.45 °F | 26.24 °F | 75.56 °F | 54.10 °F | 19.22 °F | 73.94 °F | 45.79 °F | 8.96 °F | 4.94 in | 0.17 in | 0.00 in | 0.00 in |
Data Visualisations
Remove WatermarksCurrent Year Climate Trends vs Historical


Max Temperature this Year | 1 of 6
Climate 12-Month Moving Averages


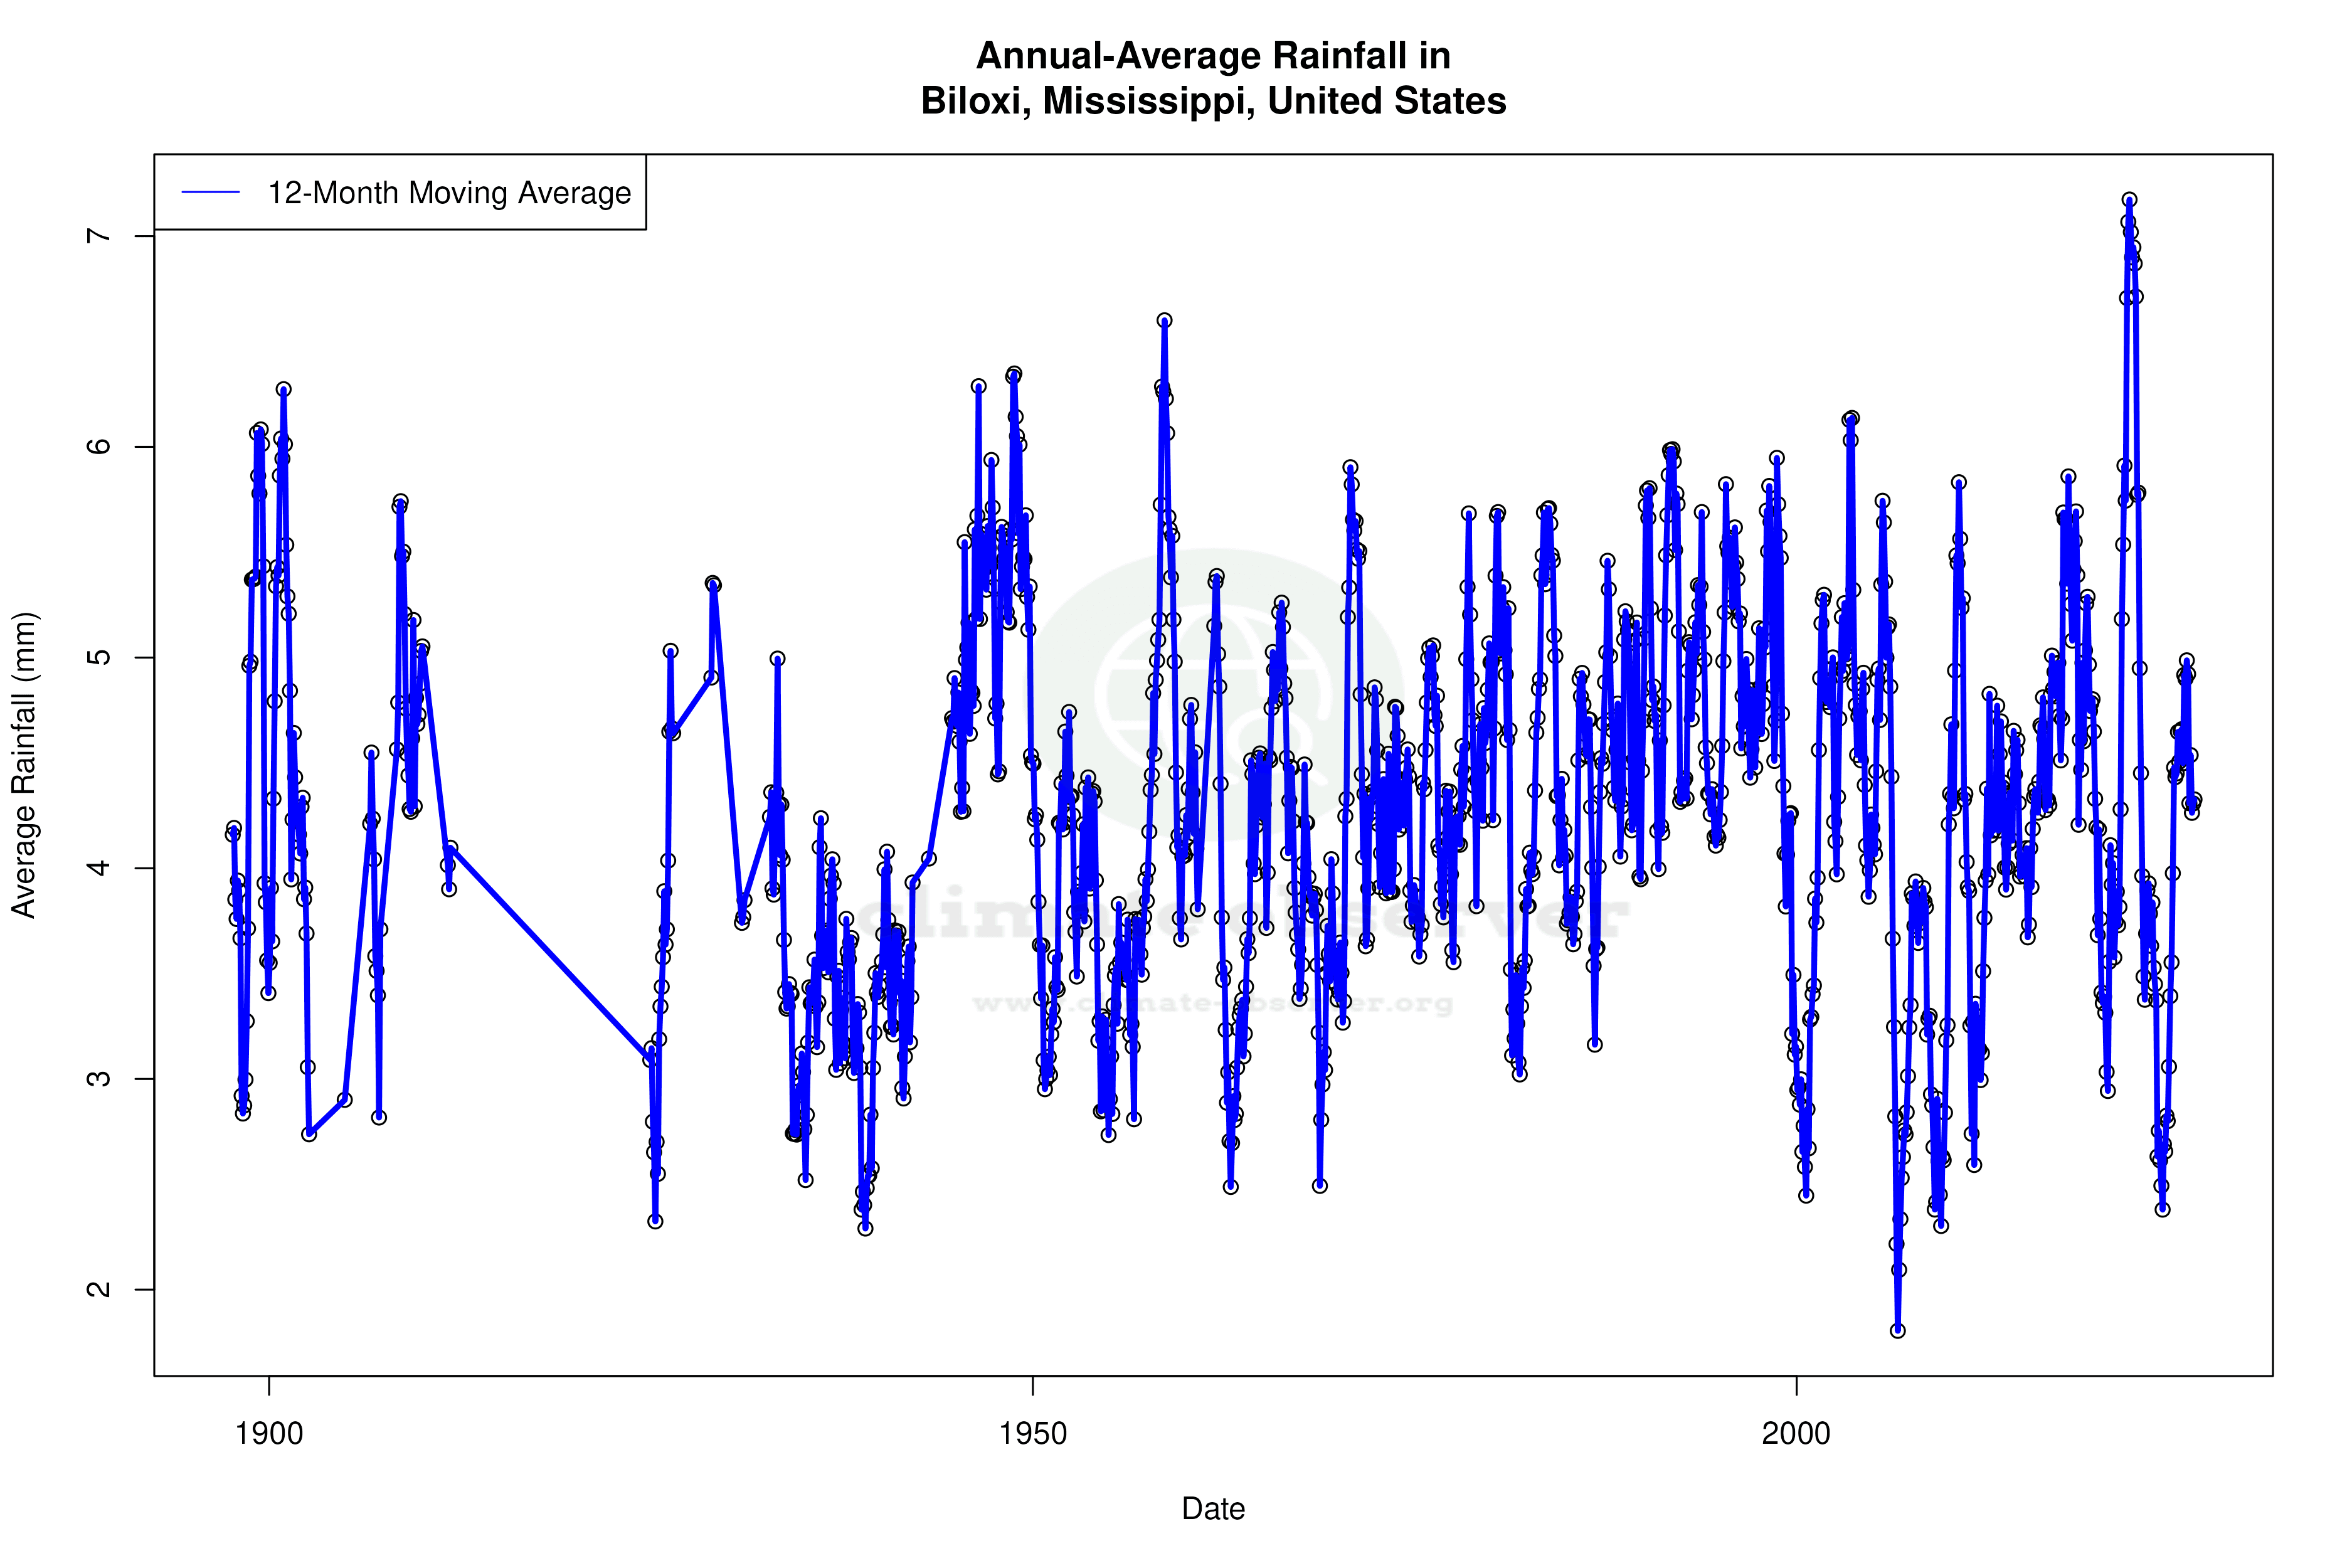

Max Temperature 12-Month MA | 1 of 6
Daily Data Points and Averages Throughout the Year


Average Max Temperature Throughout Year | 1 of 5
