Climate for Station: Mt Morris 2w, New York, United States
Loading live weather...
Climate Analysis & Overview
The climate profile of Mount Morris, New York, reveals a nuanced interplay between long-term cooling trends and recent warming patterns. While high temperatures have marginally decreased over time, recent years show a warming trend, reflecting broader regional climatic shifts. Precipitation patterns have become more evenly distributed, suggesting a subtle shift in local weather dynamics.
Geographical Context and Climate Classification
Mount Morris, located in Livingston County, New York, sits at coordinates 42.7314° N, 77.9053° W. This region is characterised by a humid continental climate, typified by cold winters and warm summers. The area's topography, with its proximity to the Genesee River and surrounding hills, influences the microclimate, often resulting in varied precipitation and temperature patterns compared to the broader regional climate.
Temperature Trends: A Tale of Two Timelines
Over the past decade, Mount Morris has experienced a warming trend, with high temperatures increasing by 0.65°C (1.17°F) and low temperatures by 0.71°C (1.28°F). This recent warming contrasts with the all-time trend, where high temperatures have slightly cooled by 0.06°C (0.11°F), while low temperatures have risen by 0.19°C (0.34°F). This divergence indicates a complex climate narrative where short-term warming overlays a longer-term cooling pattern, possibly influenced by regional climatic shifts or local environmental changes.
Precipitation Patterns: A More Even Distribution
The Precipitation Concentration Index (PCI) for Mount Morris has decreased from a baseline of 11.0 to a current value of 9.9. This decline signifies a more even distribution of rainfall throughout the year, suggesting fewer intense precipitation events and a shift towards a more balanced hydrological cycle. Such changes can affect local agriculture and water management practices, aligning with broader climate adaptation goals in the United States.
Temperature Extremes: Historical Records
Mount Morris has recorded extreme temperatures with a maximum of 38.9°C (102.0°F) and a minimum of -30.0°C (-22.0°F). These records highlight the range of thermal conditions experienced in the region, reflecting the inherent variability of a continental climate. Such extremes are critical for understanding potential impacts on local ecosystems and infrastructure resilience.
Implications for Regional Climate Goals
The observed climatic shifts in Mount Morris provide valuable insights into regional climate dynamics. The recent warming trend aligns with broader national concerns about rising temperatures and their potential impacts. Meanwhile, the more evenly distributed precipitation may offer some resilience against extreme weather events, a key consideration in the context of the United States' climate adaptation and mitigation strategies.
Station Statistics
10-Year Trend
High: +2.19 °F/decade
Low: +1.74 °F/decade
Rain: +0.028 in/decade
25-Year Trend
High: +0.22 °F/decade
Low: +0.74 °F/decade
Rain: +0.004 in/decade
50-Year Trend
High: +0.56 °F/decade
Low: +0.84 °F/decade
Rain: -0.004 in/decade
All-Time Trend
High: -0.24 °F/decade
Low: +0.23 °F/decade
Rain: +0.002 in/decade
Percentage Above-Average Days
Last 12 Months: 52.6%
This Year: 54.2%
Precipitation Concentration Index (PCI) ℹ️
Last 12 Months: 9.9
Historical Average: 10.4
Percentile Rank of Last 12 Months ℹ️
High: 70th percentile
Low: 75th percentile
Rain: 76th percentile
Change in Variance ℹ️
High: -6.6%
Low: -6.0%
Intraday: -13.8%
Data Coverage
86.4%
First Year of Data
1893
Station Location
Historical Weather Records
| Max High | Avg High | Min High | Max Avg | Avg Avg | Min Avg | Max Low | Avg Low | Min Low | Max Precipitation | Avg Precipitation | Max Snow | Avg Snow | |
|---|---|---|---|---|---|---|---|---|---|---|---|---|---|
| Record | 102.02 °F | — | -4.00 °F | 87.80 °F | — | -10.12 °F | 84.92 °F | — | -22.00 °F | 4.25 in | — | 22.99 in | — |
| January | 78.98 °F | 32.52 °F | -3.78 °F | 60.44 °F | 24.21 °F | -10.12 °F | 53.06 °F | 16.11 °F | -22.00 °F | 1.48 in | 0.06 in | 20.00 in | 0.32 in |
| February | 75.92 °F | 34.13 °F | -4.00 °F | 62.42 °F | 26.07 °F | -6.86 °F | 55.04 °F | 16.46 °F | -18.94 °F | 2.45 in | 0.05 in | 22.99 in | 0.30 in |
| March | 82.94 °F | 43.14 °F | -0.04 °F | 64.94 °F | 34.07 °F | -0.04 °F | 68.00 °F | 24.28 °F | -7.06 °F | 2.00 in | 0.07 in | 20.00 in | 0.20 in |
| April | 93.02 °F | 56.47 °F | 19.94 °F | 75.38 °F | 45.53 °F | 14.29 °F | 69.98 °F | 35.28 °F | 10.04 °F | 2.21 in | 0.09 in | 5.00 in | 0.03 in |
| May | 96.08 °F | 68.52 °F | 37.04 °F | 80.06 °F | 56.97 °F | 32.76 °F | 78.08 °F | 45.69 °F | 21.02 °F | 1.88 in | 0.09 in | 4.02 in | 0.00 in |
| June | 100.04 °F | 77.47 °F | 46.04 °F | 86.18 °F | 65.89 °F | 46.17 °F | 73.94 °F | 54.83 °F | 30.92 °F | 2.93 in | 0.11 in | 0.00 in | 0.00 in |
| July | 102.02 °F | 81.85 °F | 60.08 °F | 87.80 °F | 70.36 °F | 55.27 °F | 84.92 °F | 59.35 °F | 35.06 °F | 2.27 in | 0.10 in | 0.00 in | 0.00 in |
| August | 98.96 °F | 79.88 °F | 55.94 °F | 86.00 °F | 68.72 °F | 48.20 °F | 75.92 °F | 57.39 °F | 35.06 °F | 2.95 in | 0.10 in | 0.00 in | 0.00 in |
| September | 98.06 °F | 73.00 °F | 44.96 °F | 82.22 °F | 61.73 °F | 38.37 °F | 73.94 °F | 50.40 °F | 24.98 °F | 2.85 in | 0.10 in | 0.00 in | 0.00 in |
| October | 89.06 °F | 61.51 °F | 30.92 °F | 75.38 °F | 50.19 °F | 29.64 °F | 68.00 °F | 40.54 °F | -0.04 °F | 4.25 in | 0.09 in | 2.01 in | 0.00 in |
| November | 89.96 °F | 48.52 °F | 19.04 °F | 68.72 °F | 39.20 °F | -0.04 °F | 64.94 °F | 31.68 °F | -7.96 °F | 2.00 in | 0.08 in | 13.50 in | 0.13 in |
| December | 78.08 °F | 37.21 °F | 5.00 °F | 62.96 °F | 29.95 °F | -0.89 °F | 57.02 °F | 22.16 °F | -16.96 °F | 1.61 in | 0.07 in | 15.00 in | 0.28 in |
Data Visualisations
Remove WatermarksCurrent Year Climate Trends vs Historical


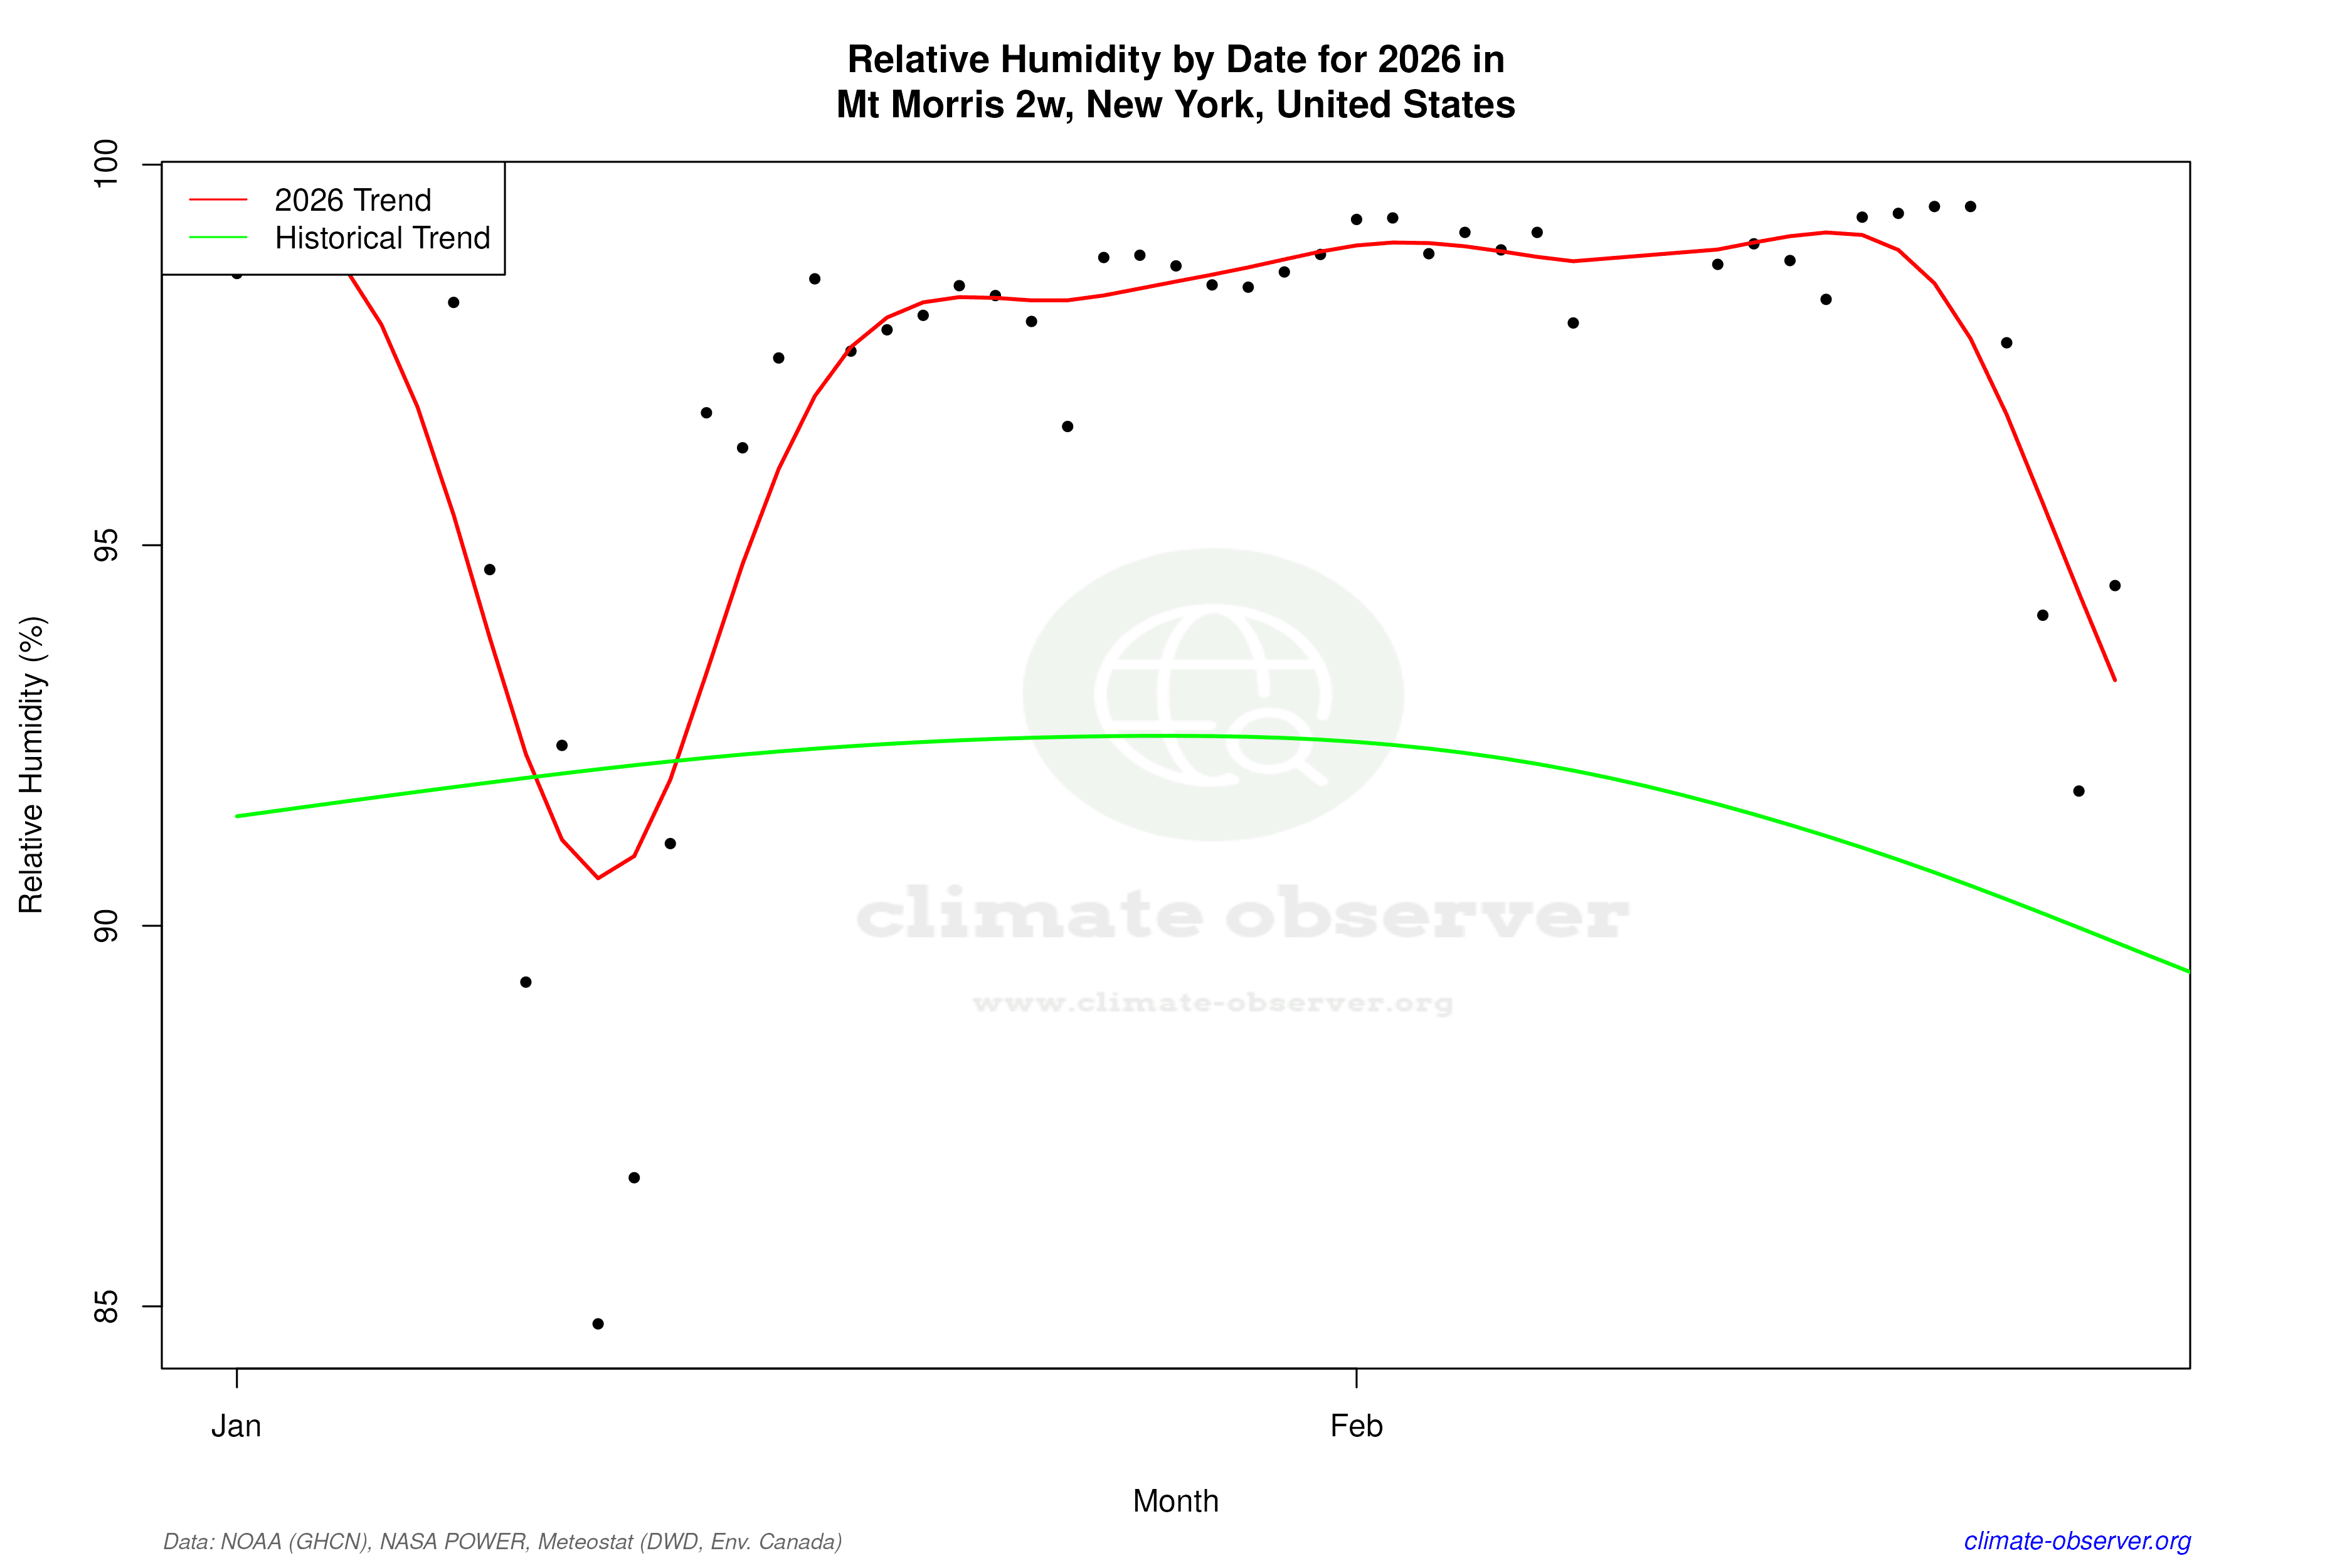

Max Temperature this Year | 1 of 6
Climate 12-Month Moving Averages


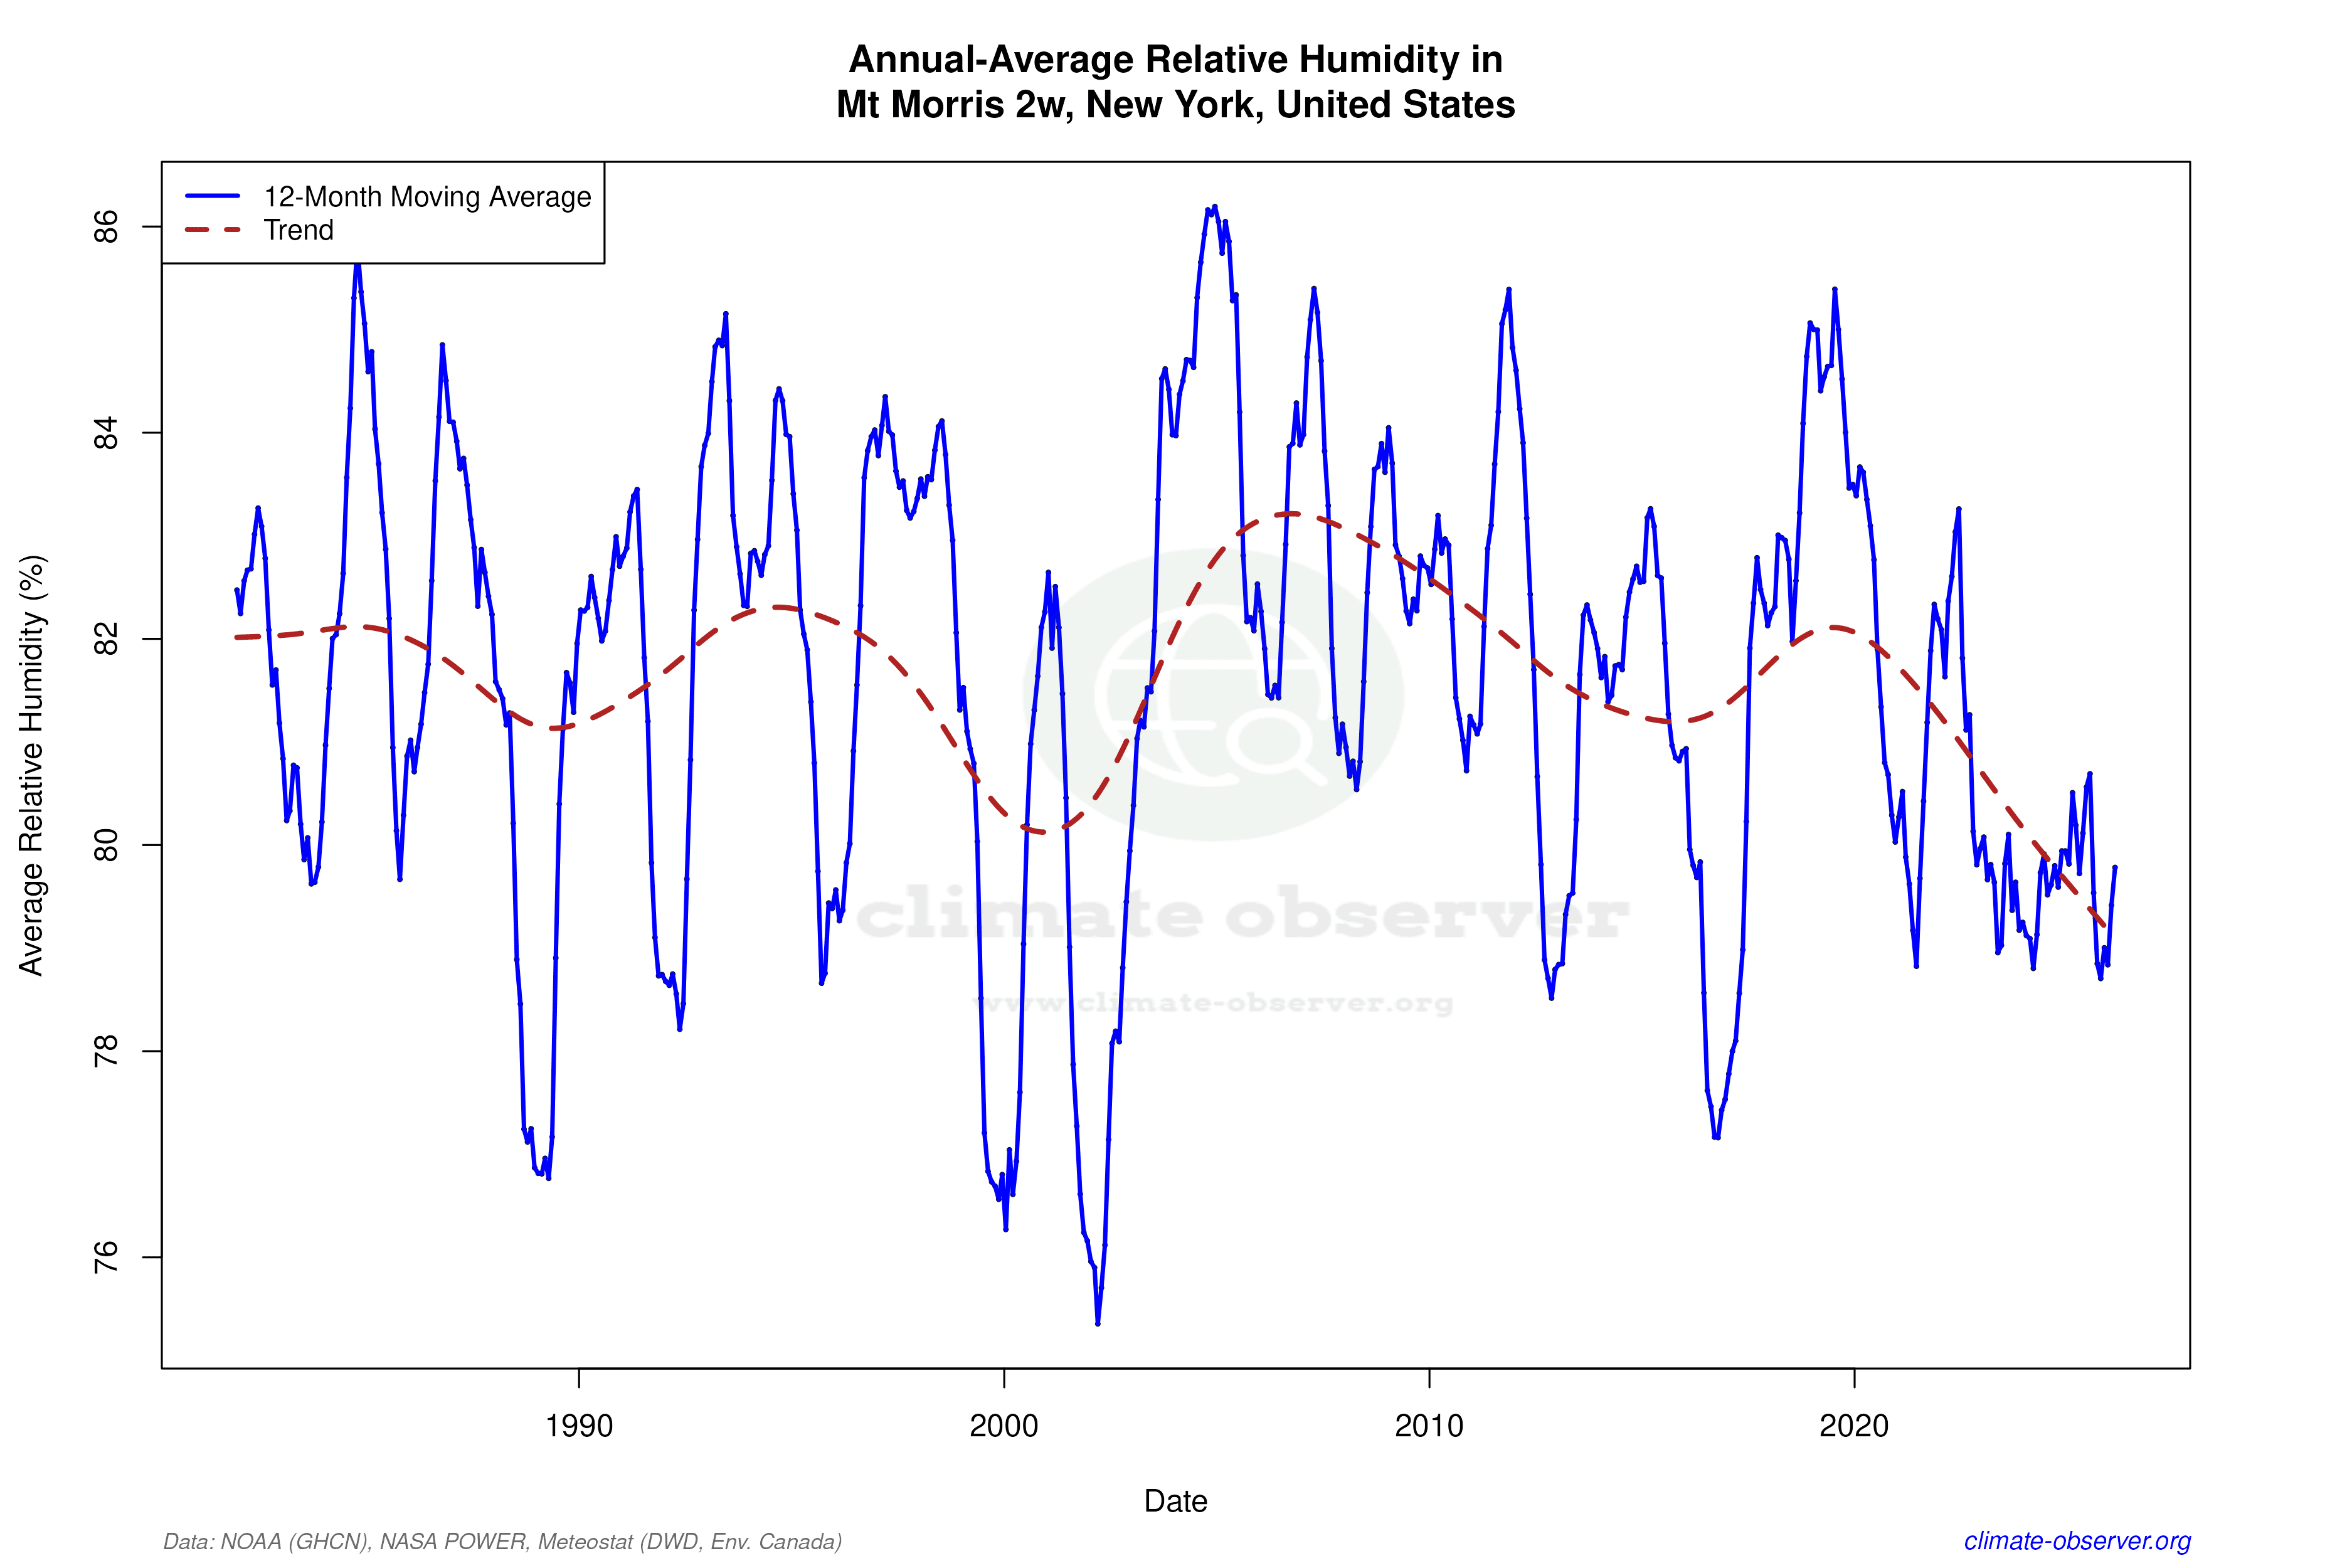

Max Temperature 12-Month MA | 1 of 6
Daily Data Points and Averages Throughout the Year


Average Max Temperature Throughout Year | 1 of 5
