Climate for Station: Edenton, North Carolina, United States
Loading live weather...
Climate Analysis & Overview
Edenton's climate profile reveals a nuanced interplay of cooling short-term trends against a backdrop of long-term warming. While recent years have seen a decrease in temperature extremes, the all-time data indicates a slight warming, with precipitation becoming more evenly distributed.
Edenton's Climatic Context
Edenton, located at 36.0164°N, 76.5517°W, falls under the humid subtropical climate classification according to the Köppen system. This classification is characterised by hot, humid summers and mild winters. Situated near the Albemarle Sound, the local geography plays a significant role in moderating temperature fluctuations and influencing precipitation patterns. The proximity to water bodies typically results in milder weather conditions compared to inland areas.
Temperature Trends: A Tale of Two Timelines
Over the past decade, Edenton has experienced a cooling trend with average highs decreasing by 0.63°C (1.13°F) and lows by 0.65°C (1.17°F). This short-term cooling contrasts with the all-time trends, where average highs have risen by a modest 0.04°C (0.07°F) and lows by 0.13°C (0.23°F). These figures suggest that while recent years have seen a slight dip in temperatures, the broader historical context indicates a gradual warming trend.
Precipitation Patterns: Towards Even Distribution
The Precipitation Concentration Index (PCI) for Edenton has seen a decrease from a baseline of 11.24 to a current value of 9.96. This change signifies a more even distribution of rainfall events over time, moving away from concentrated downpours to a steadier precipitation pattern. A PCI below 10 indicates a relatively uniform distribution, which can be beneficial for agriculture and water management.
Record Extremes: Notable Highs and Lows
The recorded temperature extremes in Edenton highlight the range of its climate. The maximum recorded temperature is 40.6°C (105.1°F), while the minimum plummeted to -20.0°C (-4.0°F). These figures underscore the potential for significant temperature variability, influenced by both regional weather systems and local geographic factors.
Regional Climate Goals and Implications
Within the context of the United States' regional climate objectives, the trends observed in Edenton are significant. The slight long-term warming aligns with broader goals to understand and mitigate climate change impacts. Furthermore, the more even distribution of precipitation could support efforts to enhance resilience against extreme weather events. Recent weather phenomena, such as hurricanes impacting the Atlantic coast, further emphasize the importance of continuous monitoring and adaptation strategies in this region.
Station Statistics
10-Year Trend
High: -0.54 °F/decade
Low: -0.49 °F/decade
Rain: -0.008 in/decade
25-Year Trend
High: -0.42 °F/decade
Low: +1.64 °F/decade
Rain: +0.015 in/decade
50-Year Trend
High: +0.02 °F/decade
Low: +0.49 °F/decade
Rain: +0.003 in/decade
All-Time Trend
High: +0.08 °F/decade
Low: +0.23 °F/decade
Rain: -0.001 in/decade
Percentage Above-Average Days
Last 12 Months: 53.2%
This Year: 48.0%
Precipitation Concentration Index (PCI) ℹ️
Last 12 Months: 9.6
Historical Average: 10.7
Percentile Rank of Last 12 Months ℹ️
High: 36th percentile
Low: 67th percentile
Rain: 52nd percentile
Change in Variance ℹ️
High: -10.3%
Low: -2.3%
Intraday: -25.1%
Data Coverage
81.9%
First Year of Data
1872
Station Location
Historical Weather Records
| Max High | Avg High | Min High | Max Avg | Avg Avg | Min Avg | Max Low | Avg Low | Min Low | Max Precipitation | Avg Precipitation | Max Snow | Avg Snow | |
|---|---|---|---|---|---|---|---|---|---|---|---|---|---|
| Record | 105.08 °F | — | 12.02 °F | 90.00 °F | — | 10.94 °F | 89.06 °F | — | -4.00 °F | 6.99 in | — | 25.98 in | — |
| January | 80.06 °F | 52.42 °F | 19.94 °F | 69.26 °F | 42.13 °F | 10.94 °F | 62.96 °F | 33.21 °F | -4.00 °F | 3.50 in | 0.13 in | 6.50 in | 0.05 in |
| February | 82.94 °F | 54.94 °F | 12.02 °F | 73.04 °F | 44.82 °F | 11.26 °F | 62.96 °F | 34.19 °F | -0.04 °F | 3.70 in | 0.14 in | 10.00 in | 0.07 in |
| March | 89.96 °F | 62.97 °F | 30.92 °F | 77.00 °F | 50.93 °F | 25.77 °F | 75.02 °F | 40.91 °F | 15.08 °F | 3.00 in | 0.13 in | 25.98 in | 0.03 in |
| April | 95.00 °F | 71.79 °F | 42.08 °F | 80.60 °F | 59.68 °F | 37.58 °F | 78.98 °F | 48.95 °F | 21.02 °F | 5.20 in | 0.11 in | 4.02 in | 0.00 in |
| May | 98.06 °F | 79.43 °F | 51.08 °F | 87.26 °F | 68.06 °F | 50.58 °F | 78.08 °F | 57.99 °F | 30.02 °F | 3.65 in | 0.14 in | 0.00 in | 0.00 in |
| June | 102.02 °F | 86.01 °F | 60.98 °F | 88.88 °F | 76.15 °F | 59.34 °F | 86.00 °F | 66.32 °F | 39.92 °F | 3.70 in | 0.16 in | 0.00 in | 0.00 in |
| July | 105.08 °F | 88.72 °F | 69.08 °F | 89.60 °F | 80.29 °F | 68.00 °F | 89.06 °F | 70.60 °F | 48.92 °F | 6.62 in | 0.21 in | 0.00 in | 0.00 in |
| August | 104.00 °F | 87.07 °F | 64.94 °F | 90.00 °F | 78.42 °F | 62.19 °F | 87.08 °F | 69.10 °F | 46.04 °F | 6.99 in | 0.19 in | 0.00 in | 0.00 in |
| September | 98.96 °F | 81.97 °F | 57.92 °F | 87.62 °F | 72.98 °F | 57.07 °F | 80.96 °F | 63.49 °F | 37.94 °F | 5.50 in | 0.15 in | 0.00 in | 0.00 in |
| October | 95.00 °F | 72.54 °F | 46.04 °F | 82.76 °F | 63.52 °F | 43.88 °F | 75.92 °F | 52.30 °F | 24.08 °F | 5.26 in | 0.11 in | 0.00 in | 0.00 in |
| November | 87.98 °F | 63.10 °F | 33.08 °F | 73.94 °F | 53.77 °F | 31.46 °F | 68.00 °F | 42.57 °F | 15.98 °F | 5.05 in | 0.10 in | 2.01 in | 0.00 in |
| December | 87.08 °F | 54.58 °F | 14.00 °F | 70.47 °F | 46.03 °F | 14.38 °F | 64.94 °F | 35.26 °F | 5.00 °F | 3.70 in | 0.11 in | 7.99 in | 0.03 in |
Data Visualisations
Remove WatermarksCurrent Year Climate Trends vs Historical
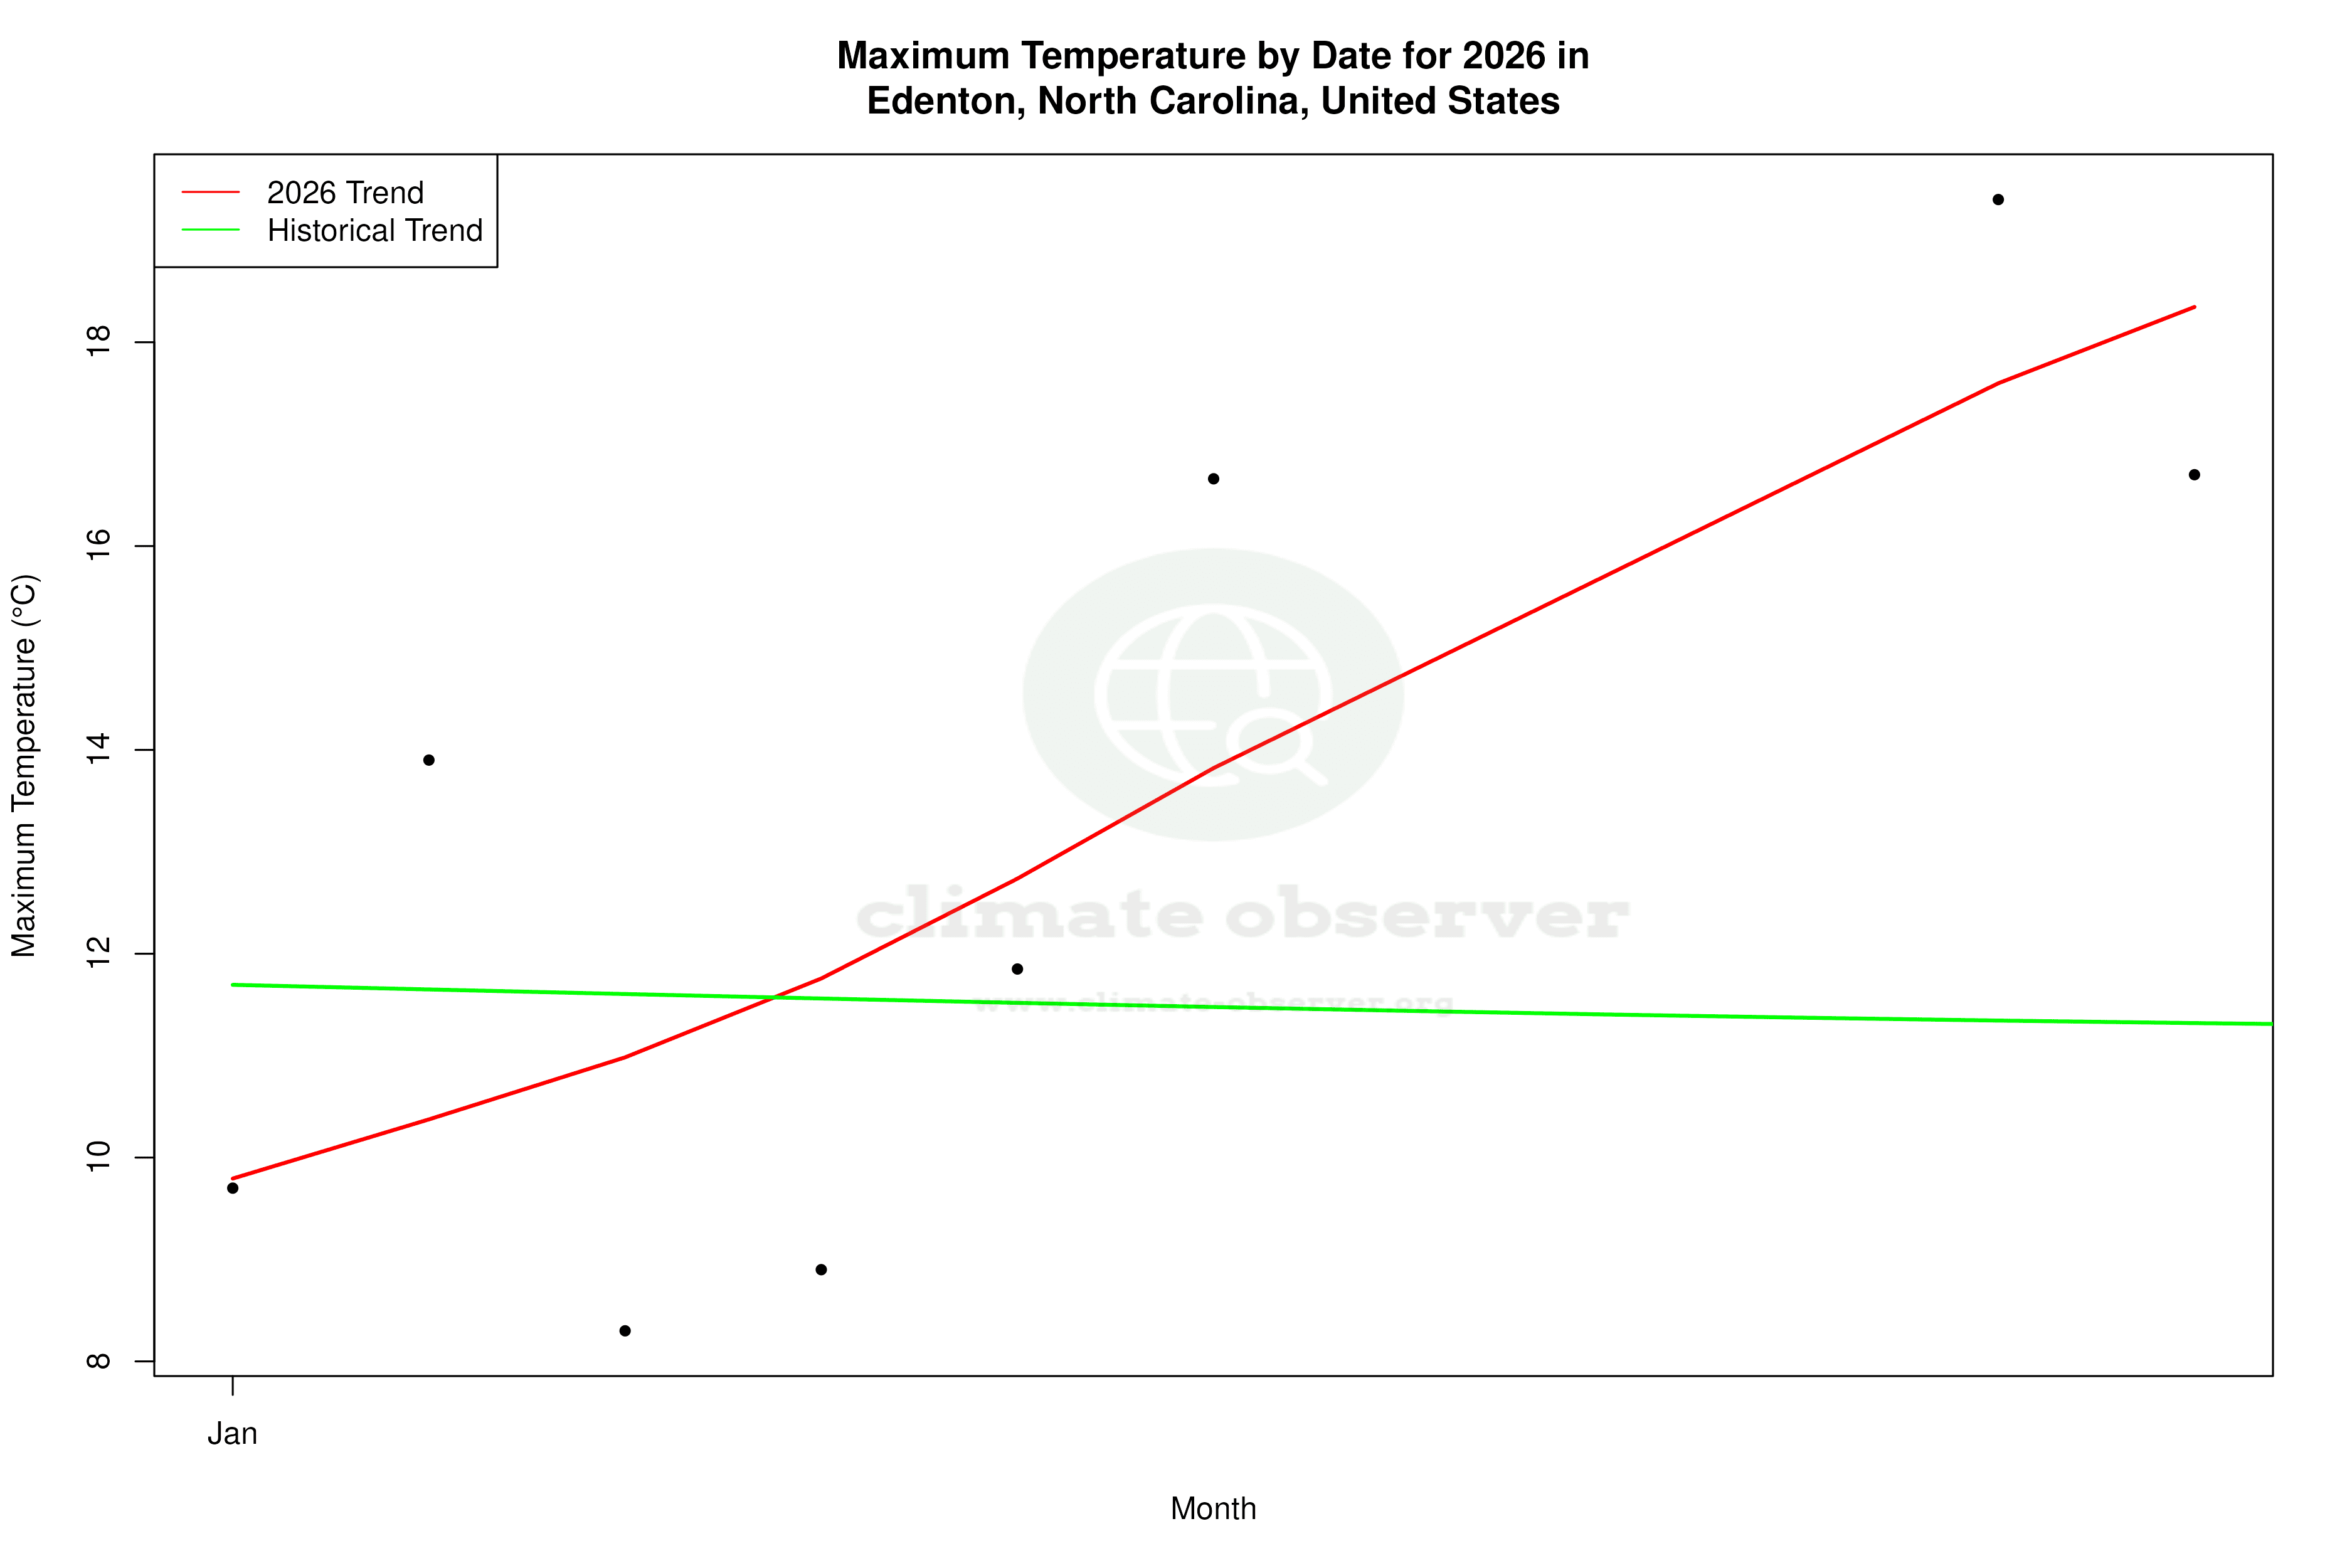


Max Temperature this Year | 1 of 6
Climate 12-Month Moving Averages


Max Temperature 12-Month MA | 1 of 6
Daily Data Points and Averages Throughout the Year


Average Max Temperature Throughout Year | 1 of 5
