Climate for Station: Raleigh State Univ, North Carolina, United States
Loading live weather...
Climate Analysis & Overview
Raleigh State University is experiencing a warming trend, with both high and low temperatures rising over the past decade and historically. The Precipitation Concentration Index indicates a more even distribution of rainfall, suggesting a shift in local precipitation patterns. These changes align with broader regional climate goals to understand and adapt to evolving weather conditions.
Rising Temperatures in Raleigh
Raleigh, North Carolina, classified under the humid subtropical climate (Cfa) in the Köppen system, is experiencing a warming trend. The 10-year trend shows a significant increase in high temperatures by 0.20°C (0.36°F) and lows by 0.07°C (0.12°F). This short-term warming is more pronounced than the all-time trend, which records a rise of 0.08°C (0.14°F) in highs and 0.01°C (0.01°F) in lows. The geographical positioning of Raleigh, nestled between the Appalachian Mountains and the Atlantic Ocean, influences its climate by moderating extreme temperatures and contributing to its humid conditions.
Record Extremes: A Tale of Two Temperatures
Raleigh's climate history is marked by record extremes, with the highest recorded temperature reaching 41.7°C (107.1°F) and the lowest plunging to -21.1°C (-5.98°F). These records underscore the variability inherent in the region's climate, influenced by its proximity to both coastal and inland weather systems. Such extremes are critical for understanding potential future climate scenarios and preparing for similar events.
Precipitation Patterns: A Shift Towards Evenness
The Precipitation Concentration Index (PCI) for Raleigh has decreased from a baseline of 11.1 to a current value of 10.3, indicating a more even distribution of rainfall across the year. This slight change suggests that precipitation events are becoming less concentrated, which could lead to fewer instances of intense rainfall and potential flooding. Such a trend is beneficial for agriculture and water management, as it allows for better absorption and utilisation of rainwater.
Regional Climate Context and Goals
Raleigh's climatic changes are part of a broader regional effort to adapt to and mitigate the impacts of climate change. The United States has set ambitious goals to reduce greenhouse gas emissions and enhance climate resilience. Understanding local trends, such as those observed at Raleigh State University, is crucial for informing policy decisions and developing strategies to address climate variability.
Implications for the Future
As Raleigh continues to warm, the implications for local ecosystems, agriculture, and urban planning are significant. The observed temperature increases and changes in precipitation patterns will require adaptive strategies to ensure sustainable development. These trends provide valuable insights into the ongoing climate dynamics and highlight the importance of continued monitoring and research to support regional climate goals.
Station Statistics
10-Year Trend
High: +0.79 °F/decade
Low: +0.34 °F/decade
Rain: -0.023 in/decade
25-Year Trend
High: +0.99 °F/decade
Low: +1.04 °F/decade
Rain: +0.008 in/decade
50-Year Trend
High: +0.68 °F/decade
Low: +0.77 °F/decade
Rain: +0.005 in/decade
All-Time Trend
High: +0.16 °F/decade
Low: +0.02 °F/decade
Rain: -0.000 in/decade
Percentage Above-Average Days
Last 12 Months: 56.4%
This Year: 58.6%
Precipitation Concentration Index (PCI) ℹ️
Last 12 Months: 11.2
Historical Average: 11.2
Percentile Rank of Last 12 Months ℹ️
High: 90th percentile
Low: 97th percentile
Rain: 39th percentile
Change in Variance ℹ️
High: -11.4%
Low: -2.0%
Intraday: -6.0%
Data Coverage
89.1%
First Year of Data
1892
Station Location
Historical Weather Records
| Max High | Avg High | Min High | Max Avg | Avg Avg | Min Avg | Max Low | Avg Low | Min Low | Max Precipitation | Avg Precipitation | Max Snow | Avg Snow | |
|---|---|---|---|---|---|---|---|---|---|---|---|---|---|
| Record | 107.06 °F | — | 10.04 °F | 90.68 °F | — | 4.28 °F | 80.96 °F | — | -5.98 °F | 6.63 in | — | 17.80 in | — |
| January | 80.06 °F | 50.63 °F | 15.98 °F | 69.98 °F | 40.88 °F | 4.28 °F | 64.04 °F | 32.00 °F | -5.98 °F | 3.01 in | 0.11 in | 10.98 in | 0.07 in |
| February | 84.92 °F | 53.46 °F | 10.04 °F | 72.50 °F | 43.74 °F | 13.28 °F | 64.04 °F | 33.49 °F | -2.02 °F | 3.22 in | 0.12 in | 11.50 in | 0.07 in |
| March | 93.92 °F | 61.92 °F | 21.02 °F | 76.82 °F | 51.06 °F | 14.36 °F | 69.08 °F | 40.61 °F | 12.02 °F | 3.40 in | 0.12 in | 17.80 in | 0.03 in |
| April | 95.00 °F | 71.21 °F | 35.06 °F | 80.06 °F | 60.29 °F | 36.14 °F | 73.04 °F | 48.85 °F | 23.00 °F | 4.77 in | 0.11 in | 10.00 in | 0.00 in |
| May | 98.96 °F | 79.11 °F | 48.02 °F | 83.48 °F | 67.88 °F | 45.86 °F | 73.94 °F | 57.79 °F | 30.92 °F | 3.56 in | 0.12 in | 0.00 in | 0.00 in |
| June | 105.08 °F | 85.99 °F | 57.02 °F | 89.42 °F | 75.21 °F | 55.58 °F | 80.06 °F | 65.76 °F | 42.98 °F | 3.63 in | 0.13 in | 0.00 in | 0.00 in |
| July | 107.06 °F | 88.75 °F | 62.06 °F | 90.68 °F | 78.44 °F | 64.04 °F | 80.96 °F | 69.59 °F | 48.02 °F | 4.83 in | 0.16 in | 0.00 in | 0.00 in |
| August | 104.00 °F | 87.18 °F | 60.98 °F | 90.32 °F | 76.90 °F | 59.00 °F | 78.98 °F | 68.53 °F | 48.92 °F | 5.70 in | 0.16 in | 0.00 in | 0.00 in |
| September | 102.02 °F | 81.80 °F | 55.04 °F | 86.90 °F | 71.01 °F | 48.20 °F | 78.08 °F | 62.68 °F | 41.00 °F | 3.95 in | 0.13 in | 0.00 in | 0.00 in |
| October | 100.04 °F | 71.78 °F | 44.96 °F | 83.30 °F | 60.35 °F | 35.60 °F | 73.94 °F | 51.08 °F | 28.04 °F | 6.63 in | 0.09 in | 0.00 in | 0.00 in |
| November | 87.08 °F | 61.76 °F | 28.94 °F | 75.02 °F | 51.04 °F | 22.46 °F | 68.00 °F | 41.42 °F | 12.92 °F | 3.96 in | 0.09 in | 3.58 in | 0.00 in |
| December | 84.92 °F | 52.83 °F | 15.98 °F | 71.60 °F | 43.12 °F | 10.58 °F | 68.00 °F | 34.19 °F | -0.04 °F | 2.99 in | 0.11 in | 8.50 in | 0.03 in |
Data Visualisations
Remove WatermarksCurrent Year Climate Trends vs Historical
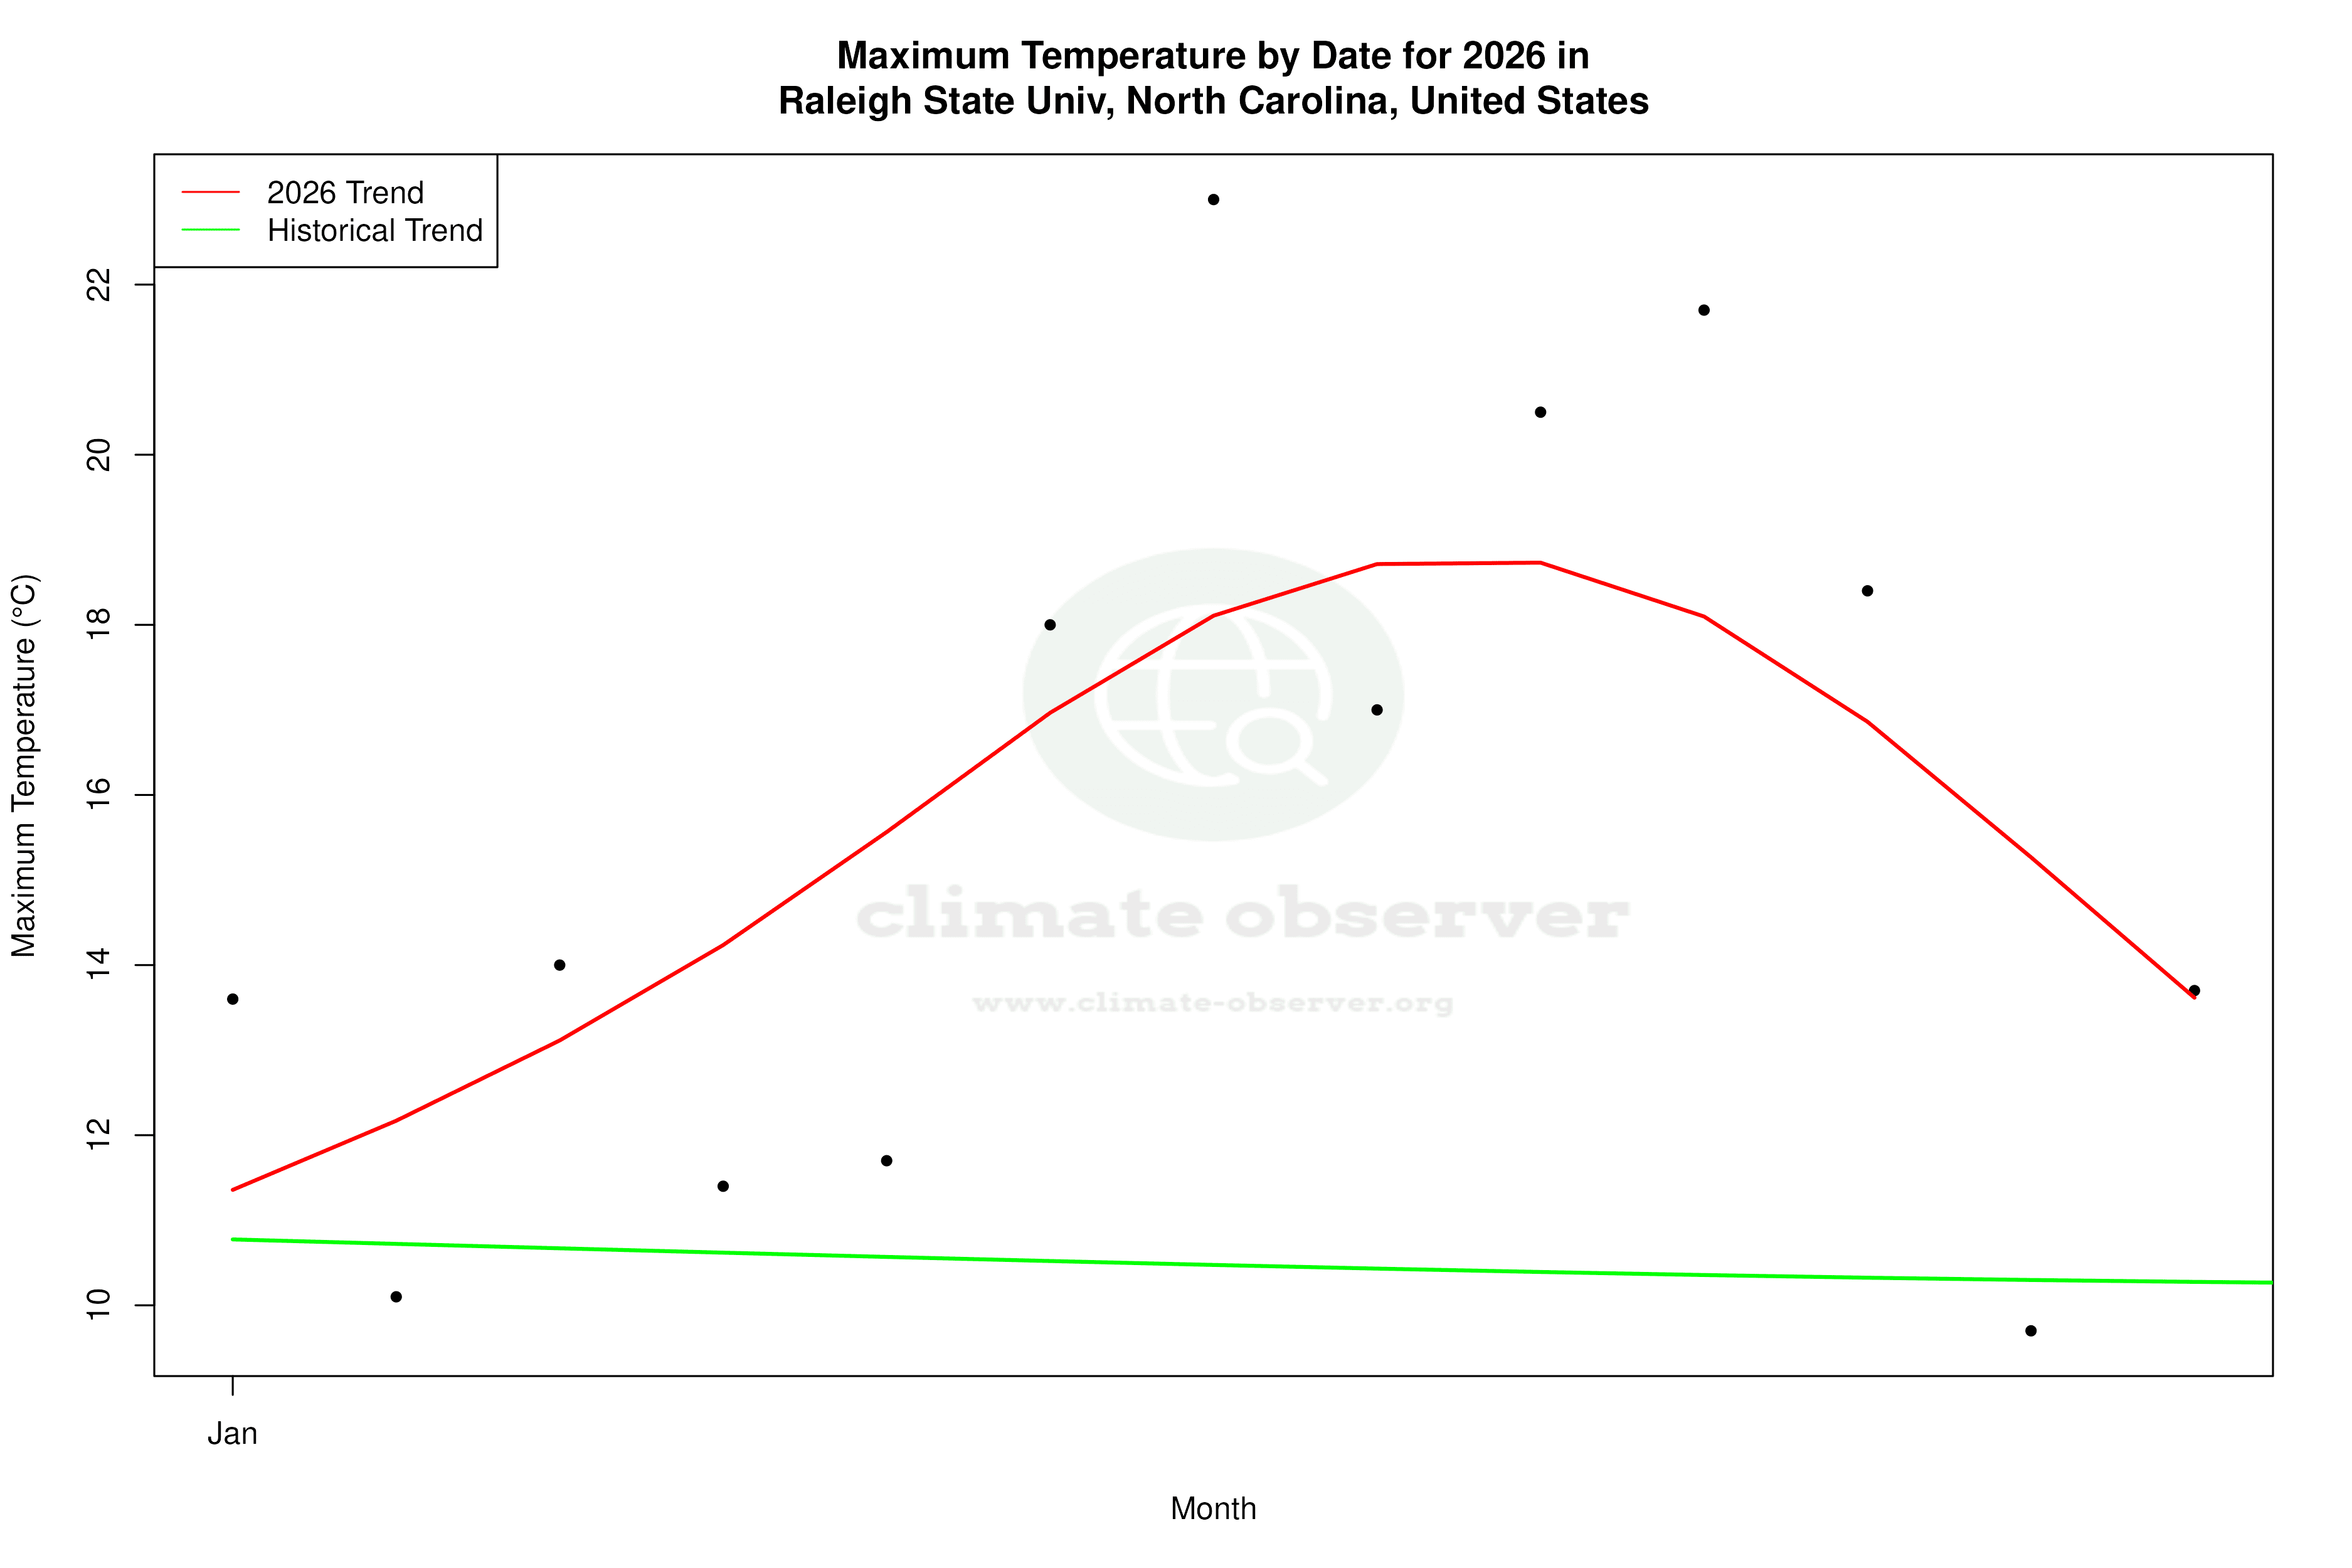


Max Temperature this Year | 1 of 6
Climate 12-Month Moving Averages


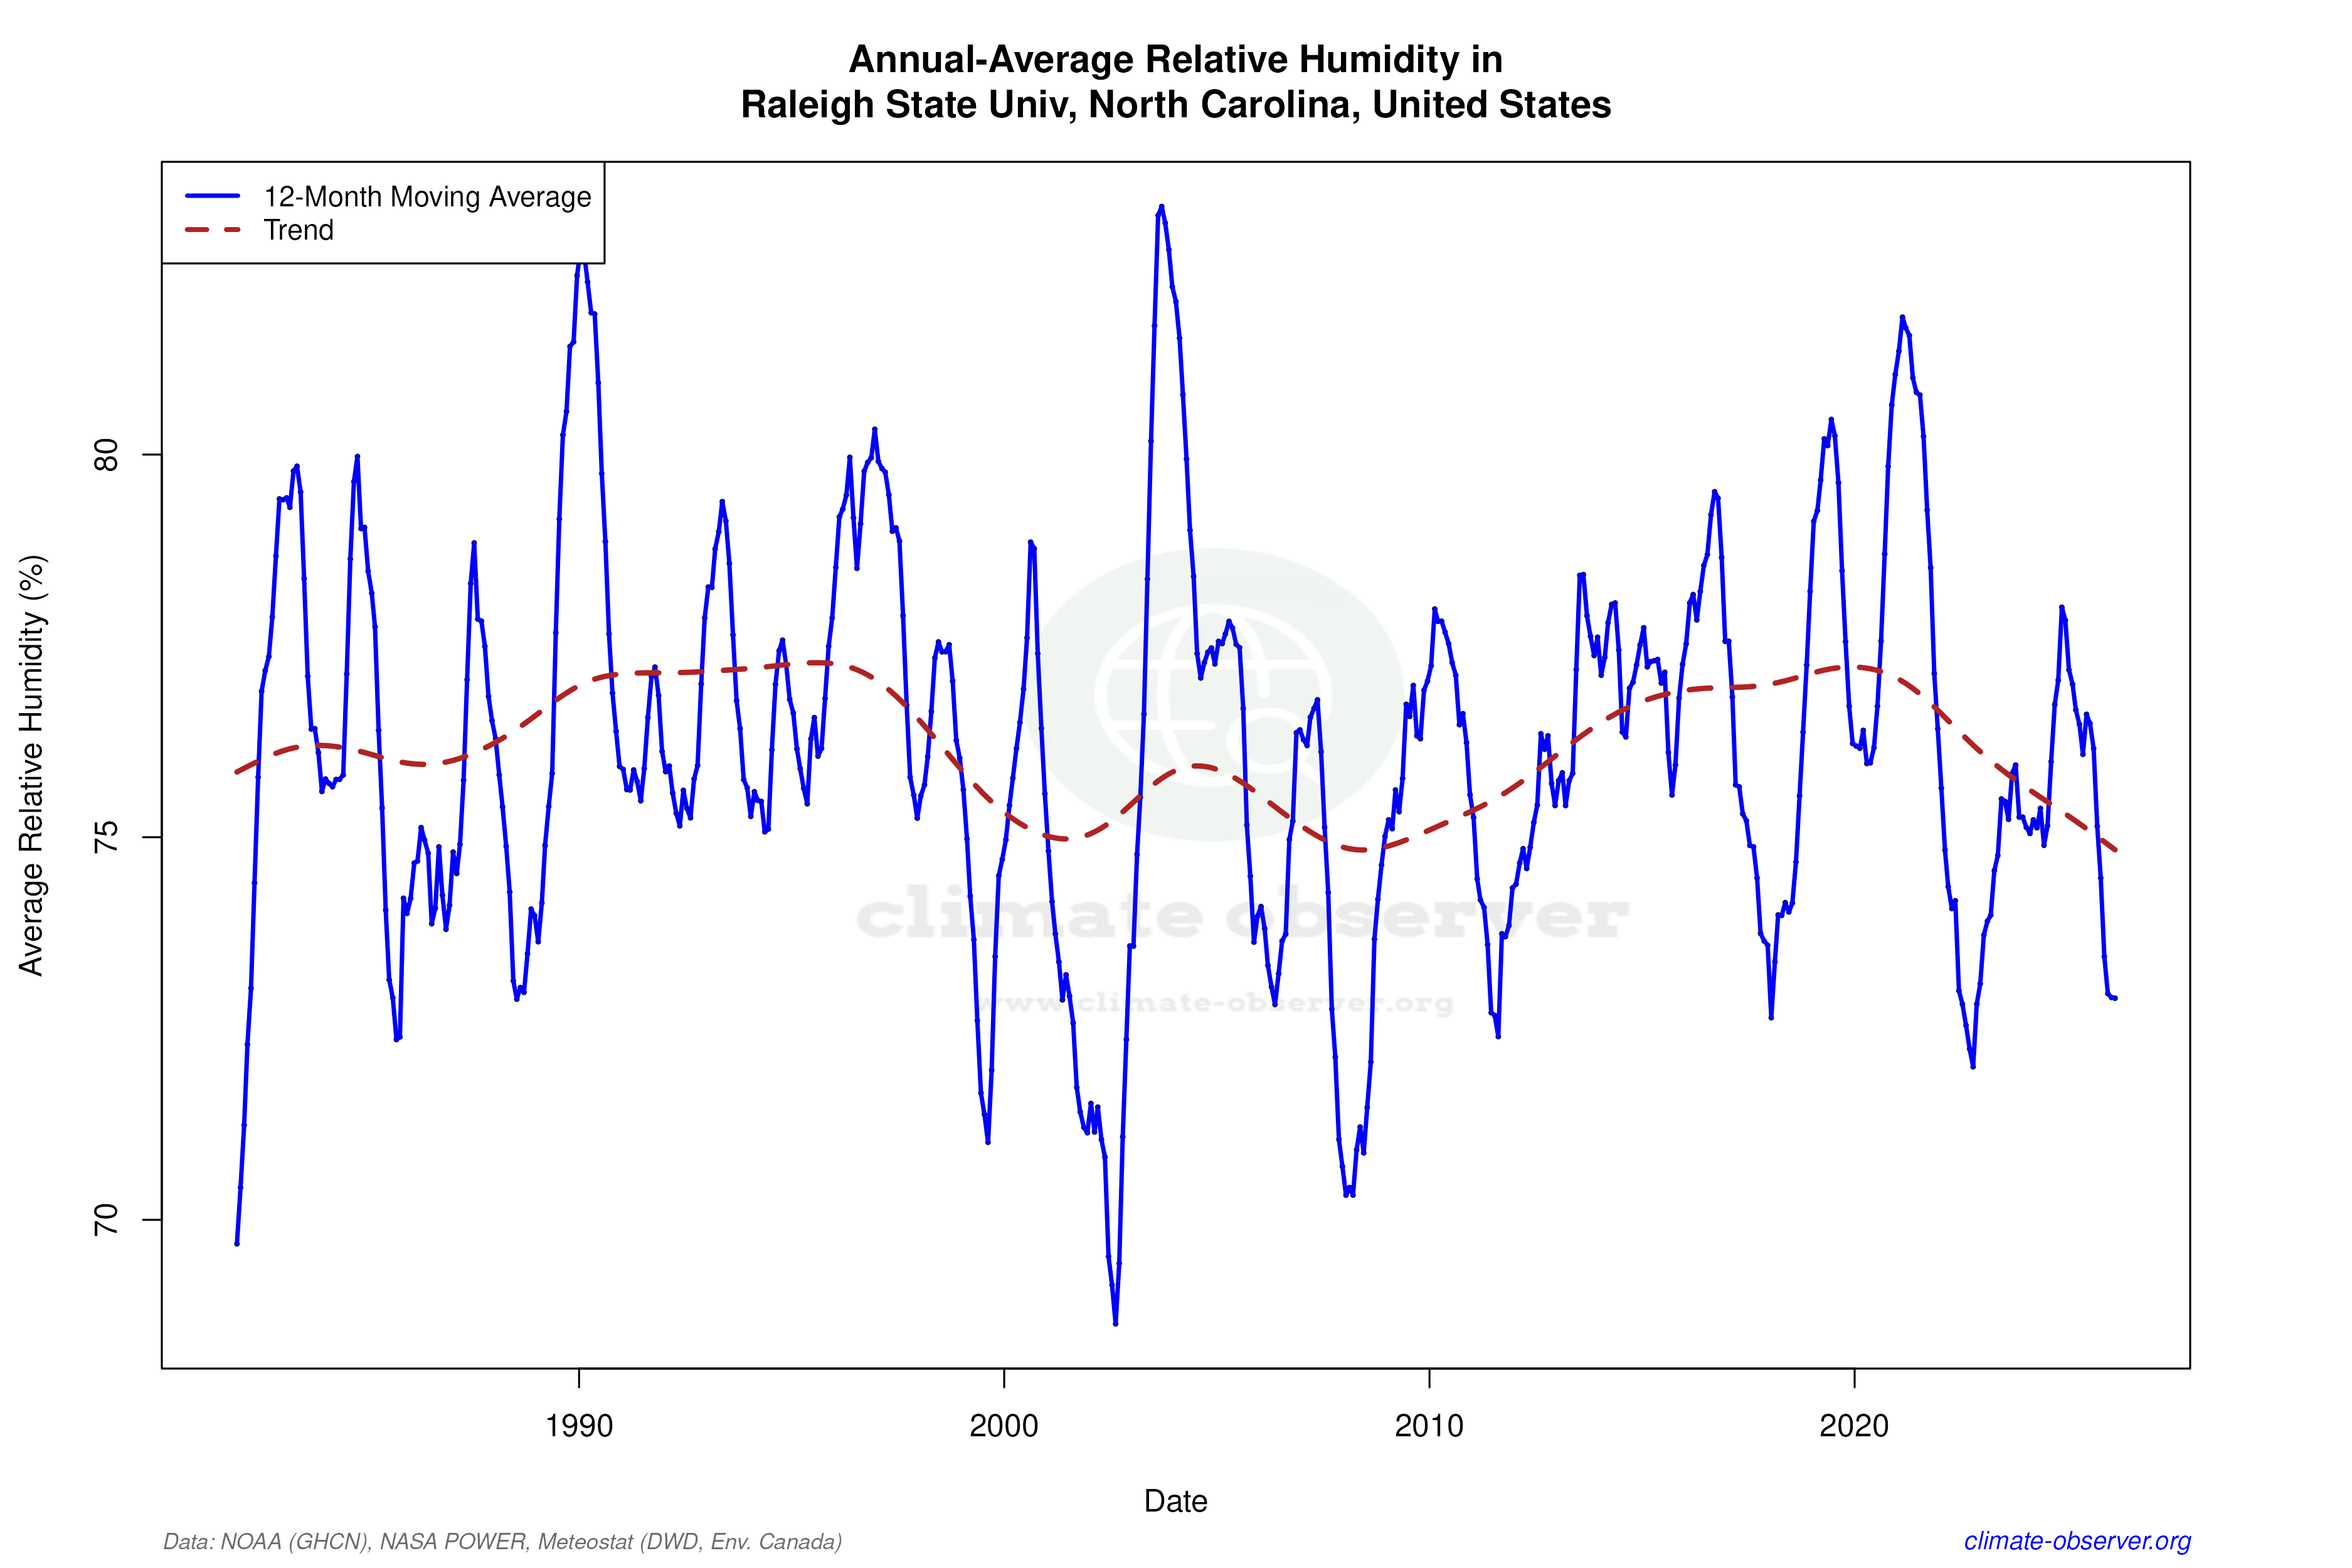

Max Temperature 12-Month MA | 1 of 6
Daily Data Points and Averages Throughout the Year


Average Max Temperature Throughout Year | 1 of 5
