Climate for Station: Clarion 3 Sw, Pennsylvania, United States
Loading live weather...
Climate Analysis & Overview
The climate profile for Clarion 3 Sw reveals a nuanced picture of temperature trends and precipitation patterns. While long-term data indicates a slight cooling of high temperatures, recent trends suggest a warming in low temperatures. Precipitation events have become marginally more concentrated, affecting local weather dynamics.
Climate Classification and Geographic Influence
Clarion 3 Sw, located in Piney Township, Clarion County, Pennsylvania, falls within the humid continental climate zone, characterised by cold winters and warm, humid summers. The region's topography, with its rolling hills and proximity to the Allegheny River, plays a significant role in shaping local weather patterns. These geographical features contribute to the area's variability in temperature and precipitation distribution.
Temperature Trends: A Tale of Two Scales
The long-term temperature trends at Clarion 3 Sw show a modest cooling in high temperatures, with a fall of 0.03°C (0.05°F). This contrasts with the warming trend in low temperatures, which have risen by 0.21°C (0.38°F). Interestingly, over the past decade, high temperatures have decreased by 0.23°C (0.41°F), while low temperatures have increased more significantly by 0.38°C (0.68°F). This divergence highlights a complex interplay of factors affecting regional temperature dynamics.
Precipitation Patterns: Concentration and Change
The Precipitation Concentration Index (PCI) for Clarion 3 Sw has seen a slight increase from a baseline of 12.18 to a current value of 12.51. This indicates that precipitation events have become marginally more concentrated, suggesting that rainfall is occurring in fewer, more intense events. Such changes can have implications for local agriculture and water management, as concentrated rainfall may lead to increased runoff and potential flooding.
Record Extremes and Regional Implications
The station has recorded an absolute maximum temperature of 40.0°C (104.0°F) and a minimum of -32.2°C (-26.0°F). These extremes underscore the variability inherent in the region's climate. As the United States continues to pursue regional climate goals, such as reducing greenhouse gas emissions and enhancing resilience to extreme weather events, understanding these localised trends becomes increasingly critical.
Recent Weather Events and Broader Context
Recent weather events, such as unseasonal frost or heatwaves, can be better understood through the lens of these temperature and precipitation trends. The observed warming in low temperatures could potentially mitigate the impact of frost events, while the increased concentration of precipitation might exacerbate the effects of heavy rainfall events. These insights are crucial for local stakeholders, including farmers and policymakers, as they navigate the challenges posed by a changing climate.
Station Statistics
10-Year Trend
High: -0.09 °C/decade
Low: +0.17 °C/decade
Rain: -1.00 mm/decade
25-Year Trend
High: +0.42 °C/decade
Low: +0.14 °C/decade
Rain: +0.39 mm/decade
50-Year Trend
High: -0.05 °C/decade
Low: +0.00 °C/decade
Rain: +0.16 mm/decade
All-Time Trend
High: -0.04 °C/decade
Low: +0.20 °C/decade
Rain: -0.20 mm/decade
Percentage Above-Average Days
Last 12 Months: 54.9%
This Year: 51.3%
Precipitation Concentration Index (PCI) ℹ️
Last 12 Months: 13.4
Historical Average: 11.0
Percentile Rank of Last 12 Months ℹ️
High: 47th percentile
Low: 57th percentile
Rain: 37th percentile
Change in Variance ℹ️
High: -2.2%
Low: +0.7%
Intraday: -12.4%
Data Coverage
57.5%
First Year of Data
1884
Station Location
Historical Weather Records
| Max High | Avg High | Min High | Max Avg | Avg Avg | Min Avg | Max Low | Avg Low | Min Low | Max Precipitation | Avg Precipitation | Max Snow | Avg Snow | |
|---|---|---|---|---|---|---|---|---|---|---|---|---|---|
| Record | 40.0 °C | — | -19.4 °C | — | — | — | 23.3 °C | — | -32.2 °C | 125.7 mm | — | 533.0 mm | — |
| January | 22.2 °C | 0.9 °C | -19.4 °C | — | — | — | 9.4 °C | -9.3 °C | -31.7 °C | 71.1 mm | 2.8 mm | 381.0 mm | 11.8 mm |
| February | 22.8 °C | 2.7 °C | -14.4 °C | — | — | — | 6.7 °C | -8.8 °C | -32.2 °C | 47.0 mm | 2.6 mm | 533.0 mm | 9.8 mm |
| March | 28.9 °C | 8.4 °C | -10.6 °C | — | — | — | 10.0 °C | -4.7 °C | -26.7 °C | 102.6 mm | 3.0 mm | 254.0 mm | 5.7 mm |
| April | 33.3 °C | 15.9 °C | -2.2 °C | — | — | — | 16.1 °C | 0.7 °C | -15.0 °C | 81.3 mm | 3.4 mm | 152.0 mm | 1.2 mm |
| May | 36.1 °C | 21.9 °C | 5.0 °C | — | — | — | 22.2 °C | 6.3 °C | -8.3 °C | 76.7 mm | 3.5 mm | 89.0 mm | 0.1 mm |
| June | 38.3 °C | 26.1 °C | 11.1 °C | — | — | — | 23.3 °C | 11.2 °C | -3.9 °C | 78.7 mm | 4.1 mm | 0.0 mm | 0.0 mm |
| July | 38.3 °C | 28.1 °C | 15.6 °C | — | — | — | 23.3 °C | 13.7 °C | 2.2 °C | 125.7 mm | 4.0 mm | 25.0 mm | 0.0 mm |
| August | 40.0 °C | 27.2 °C | 16.7 °C | — | — | — | 23.3 °C | 13.2 °C | -0.6 °C | 71.1 mm | 3.5 mm | 0.0 mm | 0.0 mm |
| September | 36.1 °C | 23.4 °C | 8.3 °C | — | — | — | 21.7 °C | 9.5 °C | -3.9 °C | 104.1 mm | 3.4 mm | 0.0 mm | 0.0 mm |
| October | 30.6 °C | 17.1 °C | 1.7 °C | — | — | — | 16.7 °C | 3.4 °C | -11.7 °C | 120.7 mm | 2.9 mm | 51.0 mm | 0.1 mm |
| November | 26.7 °C | 9.5 °C | -8.3 °C | — | — | — | 14.4 °C | -1.3 °C | -18.3 °C | 70.1 mm | 3.0 mm | 356.0 mm | 2.8 mm |
| December | 21.1 °C | 3.0 °C | -14.4 °C | — | — | — | 13.3 °C | -6.3 °C | -30.6 °C | 73.9 mm | 2.8 mm | 381.0 mm | 8.5 mm |
Data Visualisations
Remove WatermarksCurrent Year Climate Trends vs Historical


Max Temperature this Year | 1 of 6
Climate 12-Month Moving Averages


Max Temperature 12-Month MA | 1 of 6
Daily Data Points and Averages Throughout the Year
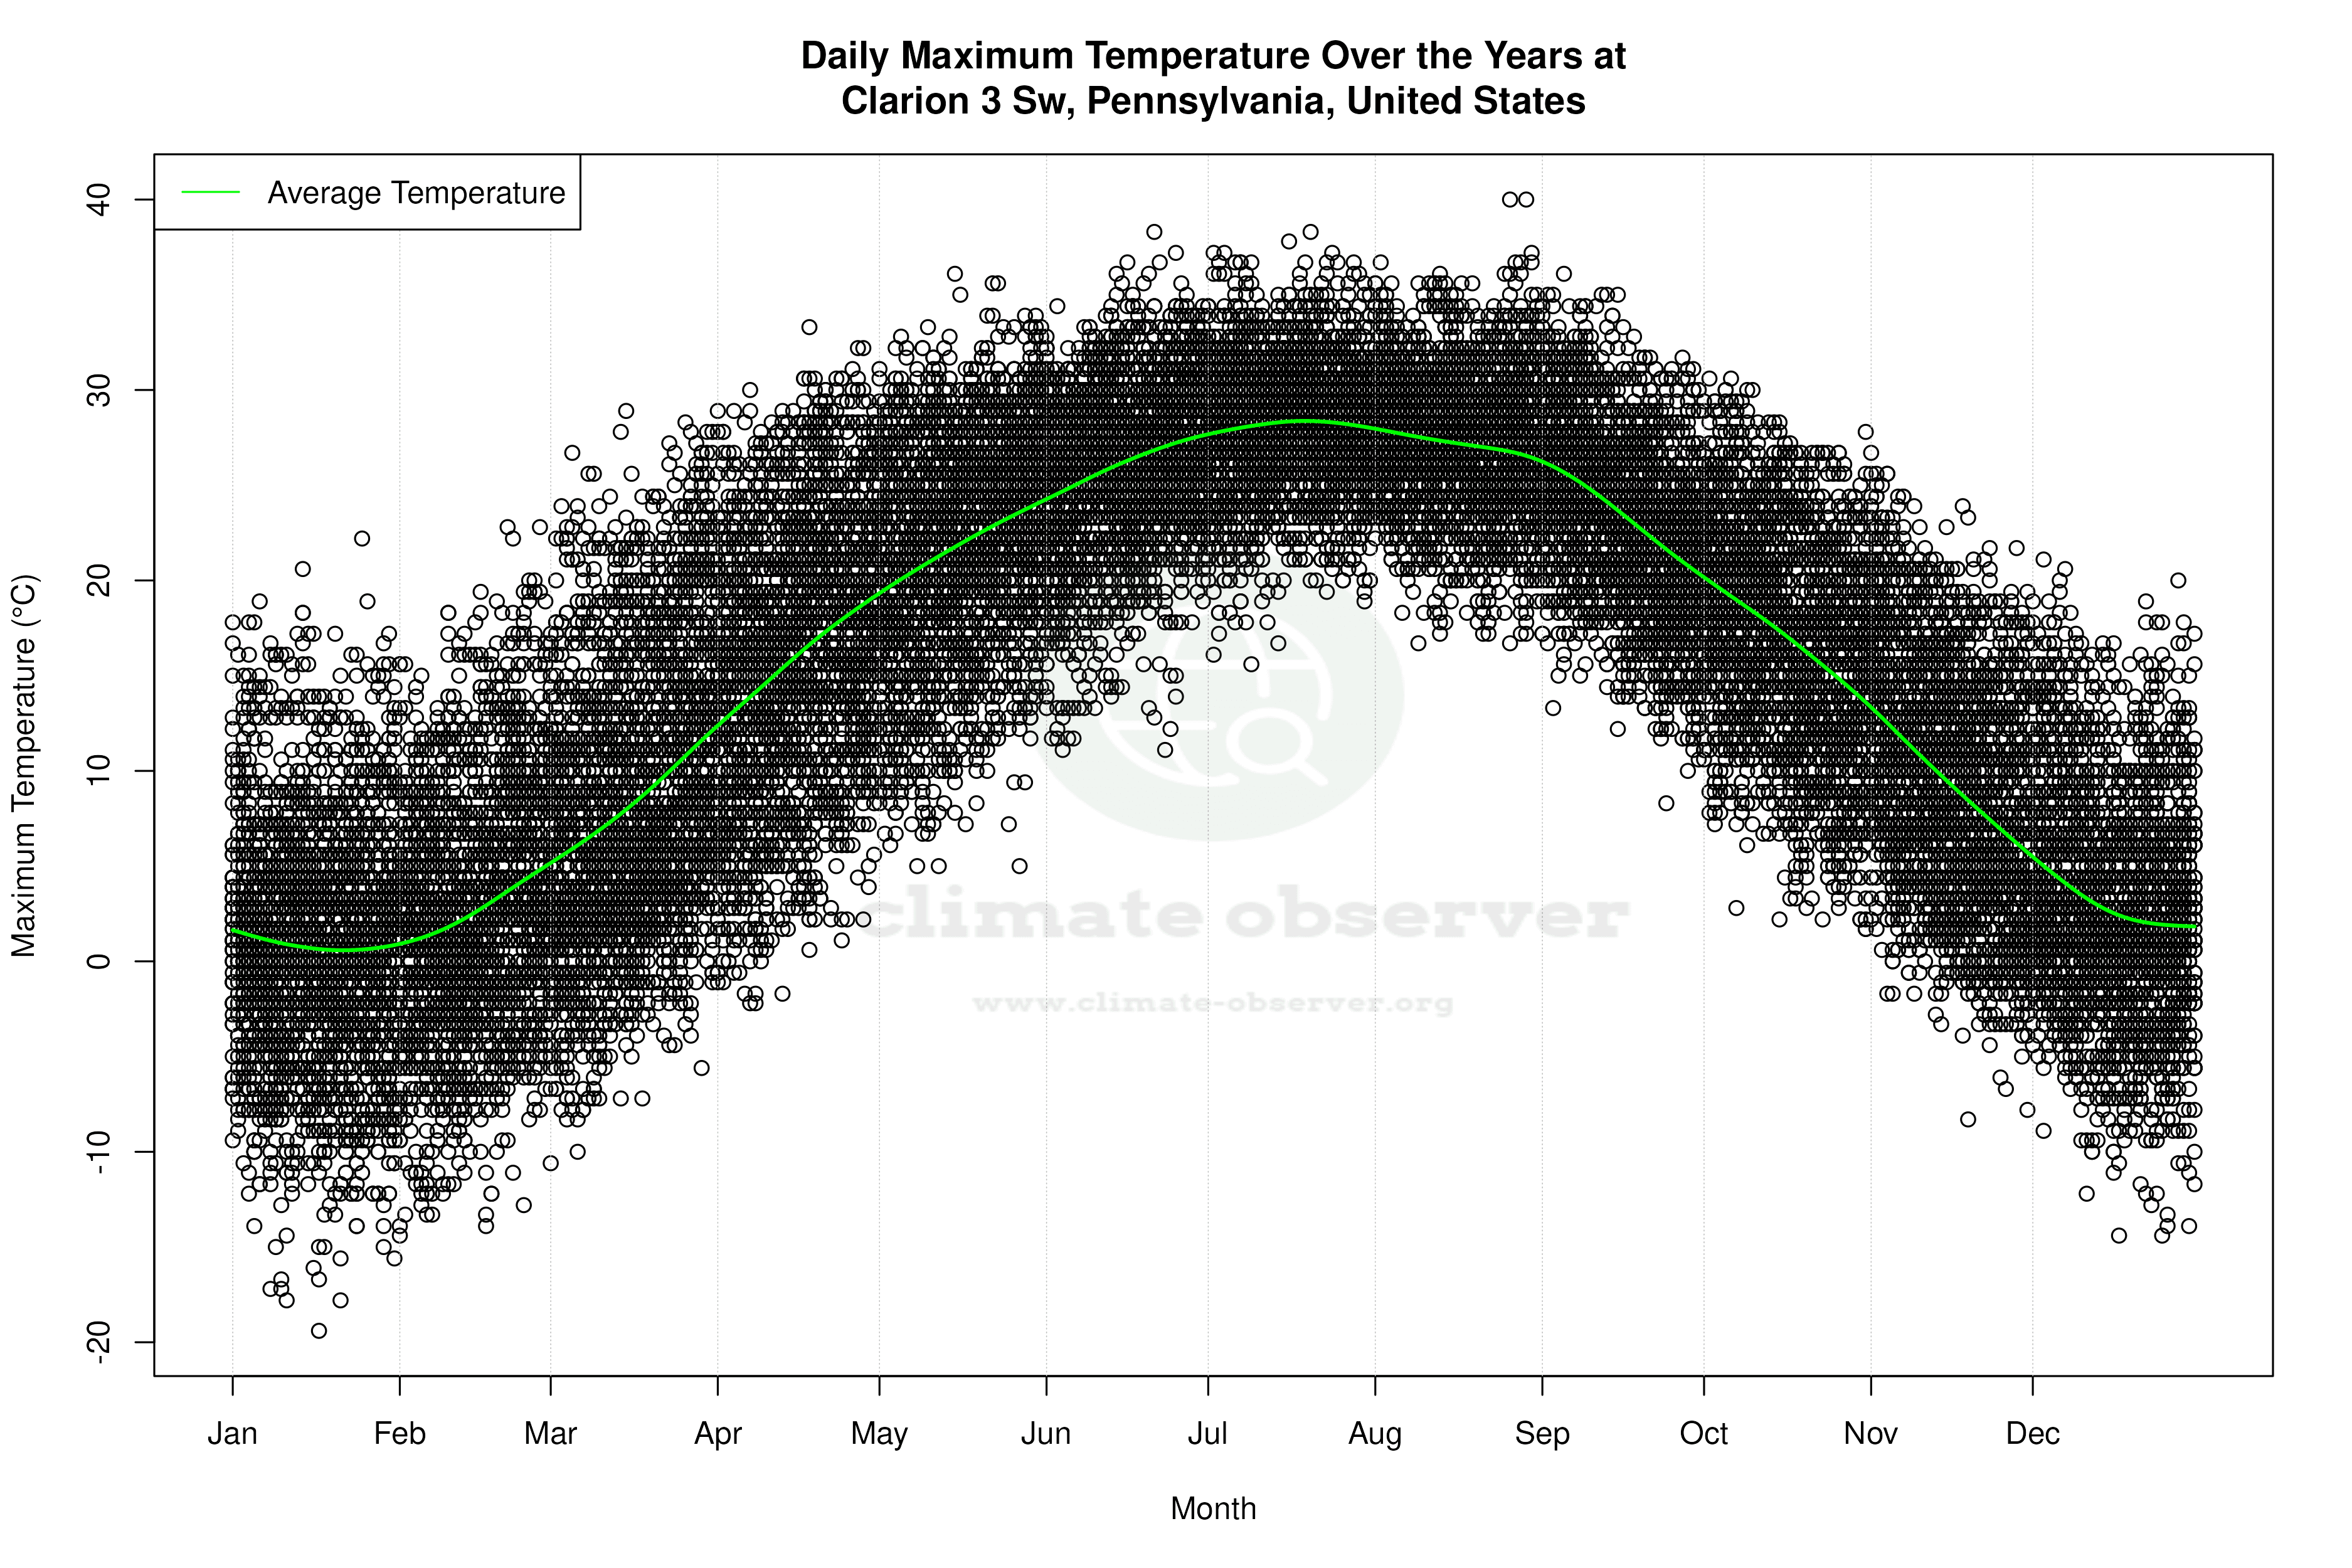


Average Max Temperature Throughout Year | 1 of 5
