Climate for Station: Carlisle Wtp, Pennsylvania, United States
Loading live weather...
Climate Analysis & Overview
Carlisle Wtp, located in Pennsylvania, exhibits nuanced climate trends with a slight long-term warming in highs and a cooling in lows. Recent data shows a more concentrated precipitation pattern, suggesting changes in weather event distribution.
Climate Classification and Geography
Carlisle Wtp is situated in the humid continental climate zone, characterised by significant seasonal temperature variations and moderate precipitation. This area, nestled within the Cumberland Valley and bordered by the Appalachian Mountains, experiences climatic influences from its geography. The mountains can lead to orographic effects, impacting local precipitation patterns and temperature fluctuations.
Temperature Trends: A Mixed Picture
Over the all-time scale, Carlisle Wtp has experienced a slight warming in high temperatures, with an increase of 0.02°C (0.04°F). Conversely, low temperatures have shown a cooling trend, falling by 0.16°C (0.29°F). Interestingly, the 10-year trends reveal a more pronounced cooling in both highs and lows, with highs decreasing by 0.56°C (1.00°F) and lows by 0.35°C (0.63°F). This divergence between short-term and long-term trends highlights the complexity of local climate dynamics.
Record Extremes: A Tale of Contrasts
The station's temperature records underscore the region's climatic extremes. The highest recorded temperature is 41.7°C (107.1°F), while the lowest plummeted to -32.58°C (-26.6°F). These figures reflect the significant seasonal variability typical of the humid continental climate, where summers can be intensely hot and winters bitterly cold.
Precipitation Patterns: Increasing Concentration
The Precipitation Concentration Index (PCI) at Carlisle Wtp has shown an increase from a baseline of 11.62 to a current level of 13.12. This shift indicates a more concentrated precipitation pattern, where rainfall is occurring in fewer, more intense events. Such changes can have implications for flood risk and water management strategies in the region. The PCI is a measure of how precipitation is distributed over time, with higher values indicating less even distribution.
Regional Climate Context and Implications
The observed trends at Carlisle Wtp occur against the backdrop of broader regional climate objectives in the United States, which aim to mitigate climate change impacts through emission reductions and adaptation strategies. Recent weather events, such as increased frequency of heavy rainfall, align with the PCI findings and underscore the need for adaptive measures in infrastructure and community planning.
Station Statistics
10-Year Trend
High: +0.51 °F/decade
Low: -0.83 °F/decade
Rain: -0.019 in/decade
25-Year Trend
High: +0.59 °F/decade
Low: -0.95 °F/decade
Rain: -0.002 in/decade
50-Year Trend
High: +0.71 °F/decade
Low: -0.35 °F/decade
Rain: -0.001 in/decade
All-Time Trend
High: +0.17 °F/decade
Low: -0.08 °F/decade
Rain: -0.001 in/decade
Percentage Above-Average Days
Last 12 Months: 54.8%
This Year: 52.5%
Precipitation Concentration Index (PCI) ℹ️
Last 12 Months: 10.3
Historical Average: 10.6
Percentile Rank of Last 12 Months ℹ️
High: 70th percentile
Low: 12th percentile
Rain: 28th percentile
Change in Variance ℹ️
High: -5.9%
Low: -4.2%
Intraday: +22.8%
Data Coverage
74.0%
First Year of Data
1844
Station Location
Historical Weather Records
| Max High | Avg High | Min High | Max Avg | Avg Avg | Min Avg | Max Low | Avg Low | Min Low | Max Precipitation | Avg Precipitation | Max Snow | Avg Snow | |
|---|---|---|---|---|---|---|---|---|---|---|---|---|---|
| Record | 107.06 °F | — | -4.85 °F | 89.96 °F | — | -12.82 °F | 80.06 °F | — | -26.64 °F | 7.50 in | — | 19.49 in | — |
| January | 73.04 °F | 37.08 °F | -4.85 °F | 62.78 °F | 29.22 °F | -12.82 °F | 57.18 °F | 21.87 °F | -26.64 °F | 4.50 in | 0.09 in | 15.00 in | 0.25 in |
| February | 82.04 °F | 40.11 °F | 8.96 °F | 65.84 °F | 32.06 °F | -0.04 °F | 51.08 °F | 23.30 °F | -11.92 °F | 3.00 in | 0.09 in | 19.49 in | 0.28 in |
| March | 86.00 °F | 49.80 °F | 16.61 °F | 67.82 °F | 40.56 °F | -0.04 °F | 66.02 °F | 30.77 °F | -6.70 °F | 4.00 in | 0.11 in | 12.01 in | 0.12 in |
| April | 93.02 °F | 62.26 °F | 33.08 °F | 78.08 °F | 51.73 °F | 24.03 °F | 69.08 °F | 40.54 °F | 19.04 °F | 3.40 in | 0.12 in | 2.01 in | 0.00 in |
| May | 96.98 °F | 72.49 °F | 46.04 °F | 84.56 °F | 61.69 °F | 40.10 °F | 73.04 °F | 50.59 °F | 28.94 °F | 4.60 in | 0.14 in | 0.00 in | 0.00 in |
| June | 100.04 °F | 81.51 °F | 53.85 °F | 87.62 °F | 70.98 °F | 50.88 °F | 78.98 °F | 59.90 °F | 39.31 °F | 5.50 in | 0.13 in | 0.00 in | 0.00 in |
| July | 107.06 °F | 86.09 °F | 62.06 °F | 89.96 °F | 76.02 °F | 59.97 °F | 80.06 °F | 64.80 °F | 44.96 °F | 5.76 in | 0.12 in | 0.00 in | 0.00 in |
| August | 100.94 °F | 83.90 °F | 59.00 °F | 87.98 °F | 73.95 °F | 56.03 °F | 78.08 °F | 63.00 °F | 44.06 °F | 7.10 in | 0.12 in | 0.00 in | 0.00 in |
| September | 102.02 °F | 76.69 °F | 48.02 °F | 87.80 °F | 66.53 °F | 44.38 °F | 75.92 °F | 55.52 °F | 30.02 °F | 5.60 in | 0.11 in | 0.00 in | 0.00 in |
| October | 96.98 °F | 65.26 °F | 37.04 °F | 82.40 °F | 54.58 °F | 35.19 °F | 69.98 °F | 44.01 °F | 17.06 °F | 7.50 in | 0.10 in | 6.10 in | 0.01 in |
| November | 84.02 °F | 52.44 °F | 19.04 °F | 72.68 °F | 43.32 °F | 23.23 °F | 64.04 °F | 34.29 °F | 8.06 °F | 2.92 in | 0.10 in | 6.50 in | 0.02 in |
| December | 75.02 °F | 41.14 °F | 6.98 °F | 64.76 °F | 33.88 °F | -1.66 °F | 57.02 °F | 26.19 °F | -7.96 °F | 3.00 in | 0.10 in | 10.00 in | 0.11 in |
Data Visualisations
Remove WatermarksCurrent Year Climate Trends vs Historical


Max Temperature this Year | 1 of 6
Climate 12-Month Moving Averages


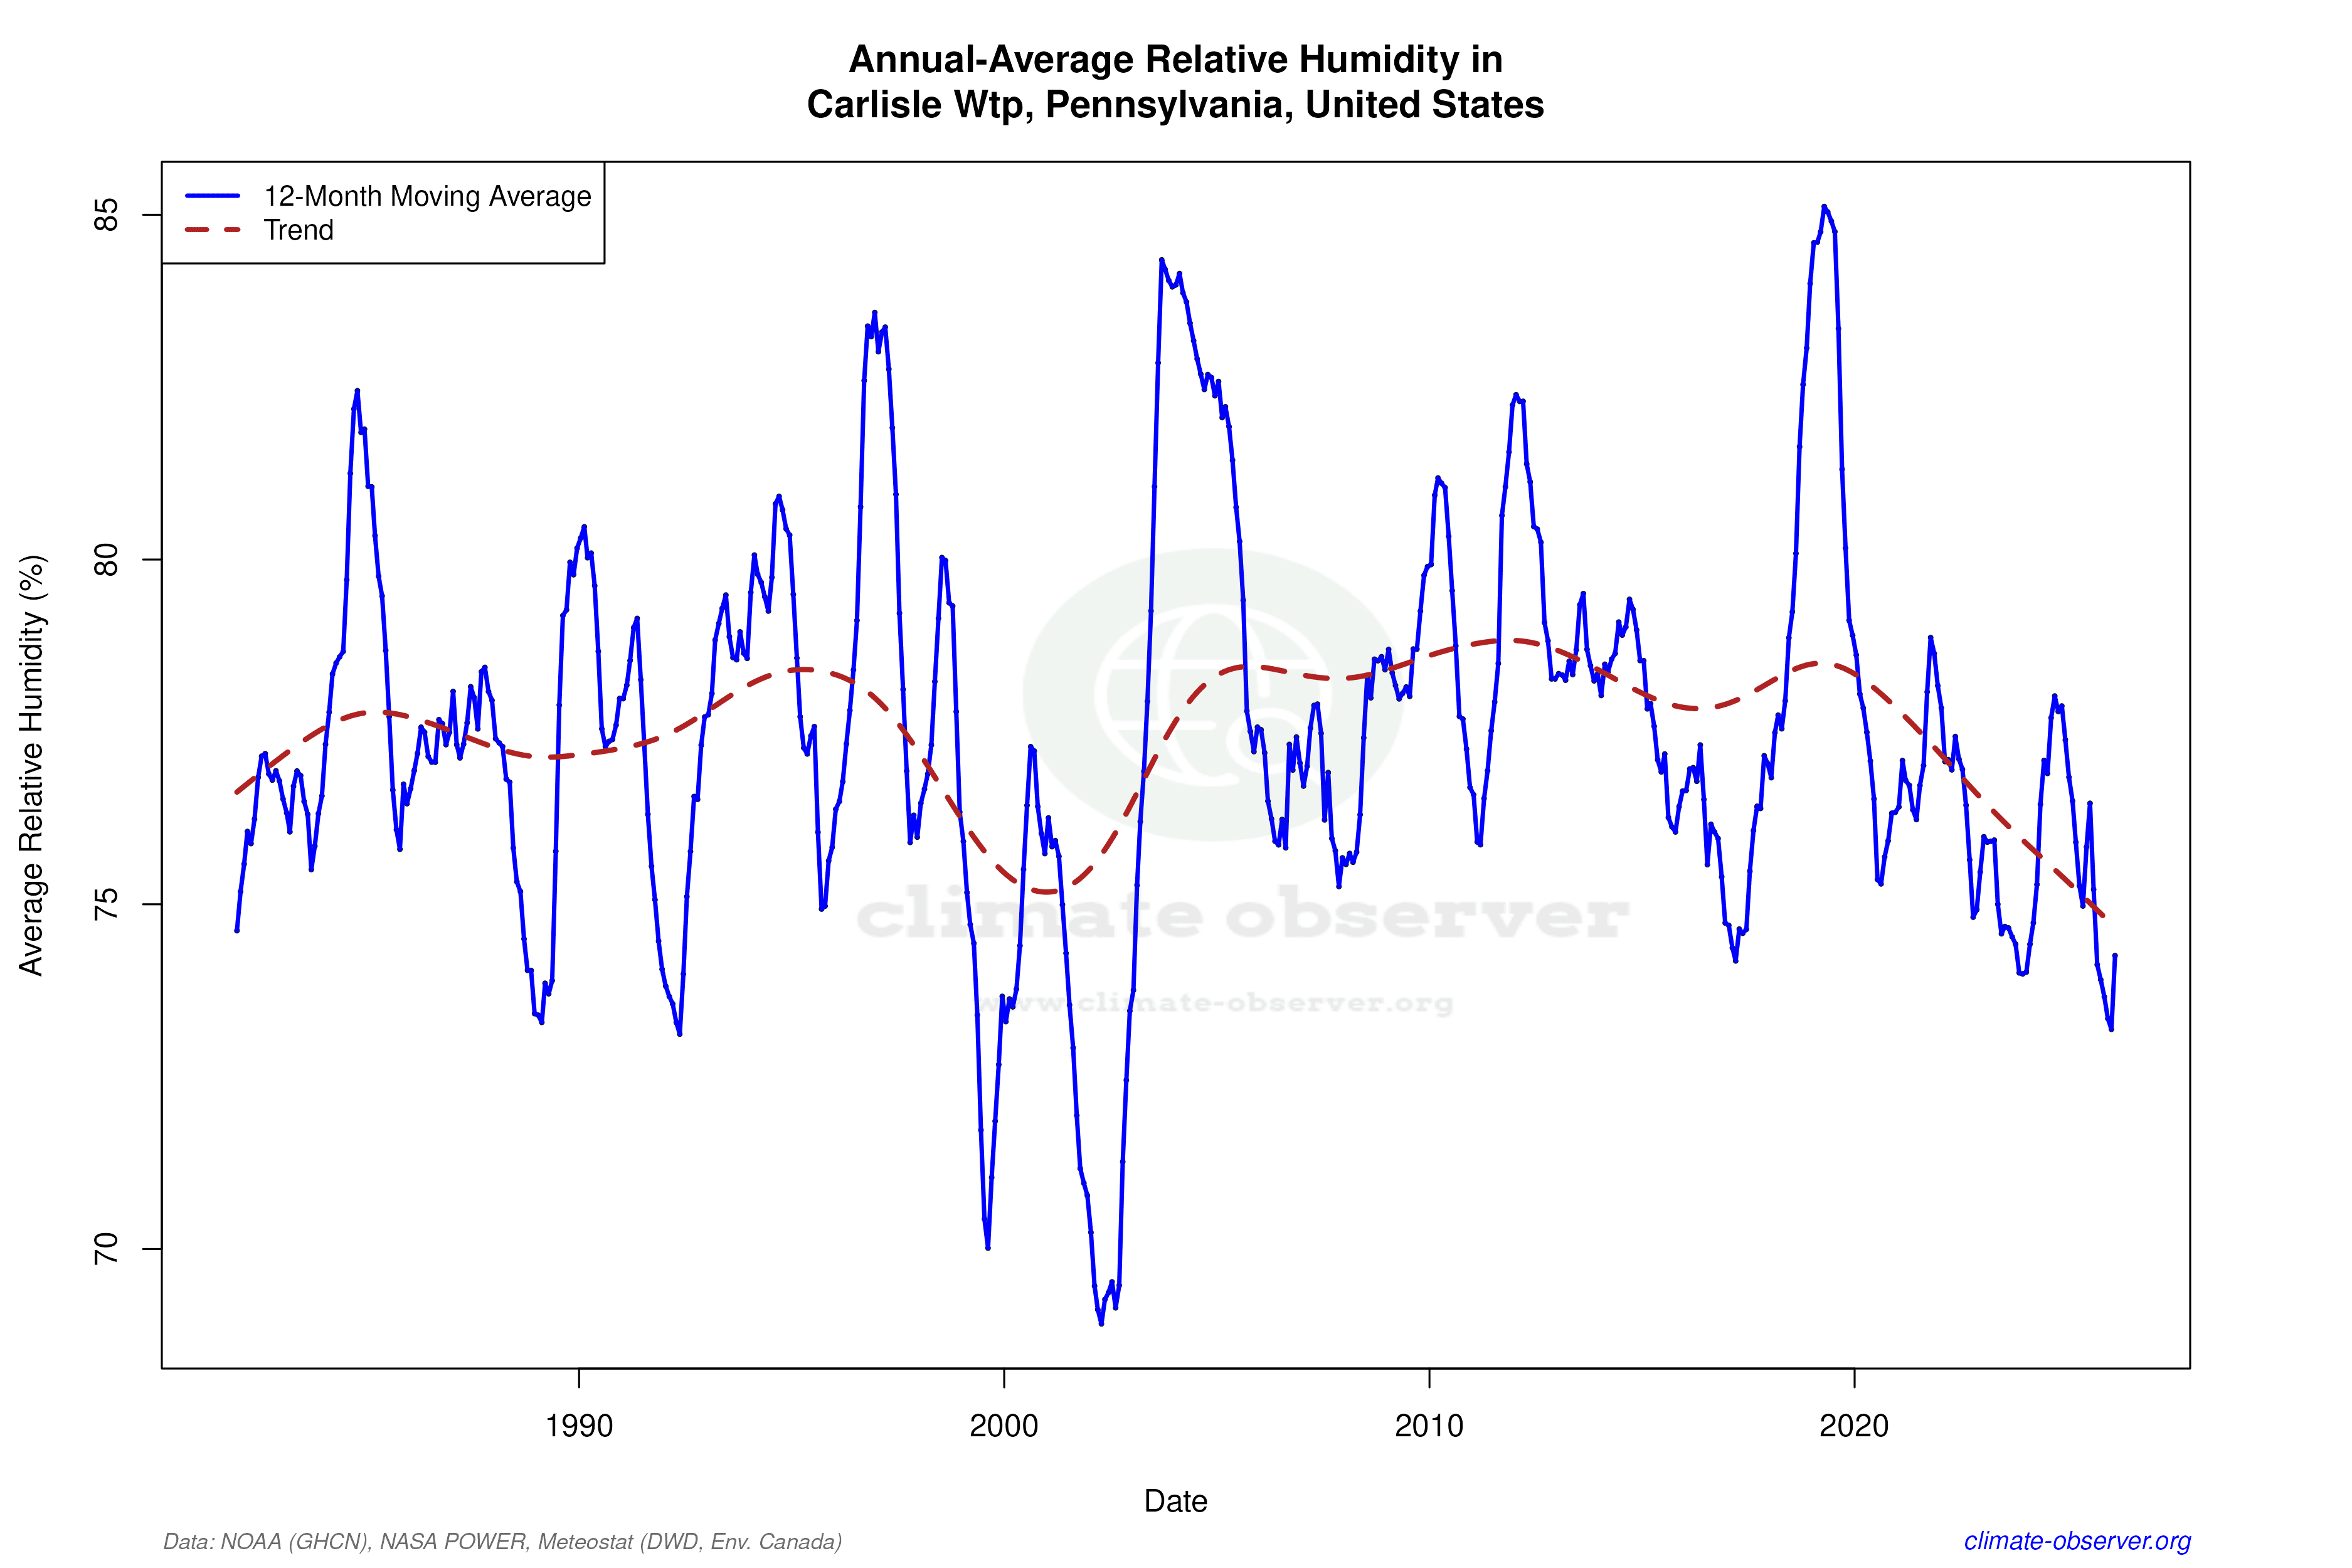

Max Temperature 12-Month MA | 1 of 6
Daily Data Points and Averages Throughout the Year


Average Max Temperature Throughout Year | 1 of 5
