Climate for Station: Dayton 1 Wsw, Washington, United States
Loading live weather...
Climate Analysis & Overview
Dayton 1 Wsw in Columbia County, Washington, is experiencing subtle climatic shifts, with a slight warming trend over the past decade. However, the long-term data indicates a nearly stable climate, with minimal changes in temperature. Precipitation patterns have become more evenly distributed, suggesting a shift in local weather dynamics.
Köppen Climate Context and Local Geography
Dayton 1 Wsw is situated in a region classified under the Köppen climate system as a cold semi-arid climate (BSk). This classification is influenced by the area's geographical features, including its proximity to the Blue Mountains and the Snake River, which moderate temperature extremes and affect precipitation patterns. The station's location at 46.3153° N, 118.0022° W places it in a transitional zone, where the interplay between mountainous terrain and river valleys creates a unique microclimate.
Temperature Trends: A Tale of Two Timelines
Over the past decade, Dayton 1 Wsw has experienced a warming trend, with average high temperatures increasing by 0.65°C (1.17°F) and lows by 0.69°C (1.23°F). This recent warming contrasts with the all-time temperature trends, which show a negligible change. The all-time data reflects a slight cooling in highs by 0.00°C (0.00°F) and a marginal warming in lows by 0.01°C (0.02°F). This suggests that while short-term fluctuations indicate warming, the long-term climate remains relatively stable.
Record Extremes: A Climate of Contrasts
The station has recorded extreme temperatures that underscore its climatic variability. The highest recorded temperature is 45.6°C (114.1°F), while the lowest is -30.0°C (-22.0°F). These extremes highlight the region's capacity for significant thermal oscillations, influenced by its semi-arid climate and geographical position.
Precipitation Patterns: Toward Even Distribution
The Precipitation Concentration Index (PCI) for Dayton 1 Wsw has decreased from a baseline of 12.35 to a current value of 11.19. This indicates a more even distribution of rainfall events over time. While the change is not drastic, it suggests a trend towards less concentrated precipitation, which could impact local agriculture and water resource management.
Regional Climate Goals and Implications
In light of the United States' broader climate goals, which aim to mitigate the impacts of climate change through adaptation and resilience strategies, the subtle shifts observed at Dayton 1 Wsw could inform local policy. The slight warming trend over the past decade aligns with national observations of rising temperatures, while the more even distribution of precipitation may offer opportunities for improved agricultural practices and water conservation strategies.
Station Statistics
10-Year Trend
High: +2.86 °F/decade
Low: +2.55 °F/decade
Rain: -0.012 in/decade
25-Year Trend
High: +0.47 °F/decade
Low: +0.76 °F/decade
Rain: +0.003 in/decade
50-Year Trend
High: -0.04 °F/decade
Low: +0.10 °F/decade
Rain: +0.001 in/decade
All-Time Trend
High: +0.00 °F/decade
Low: +0.03 °F/decade
Rain: -0.000 in/decade
Percentage Above-Average Days
Last 12 Months: 51.1%
This Year: 60.4%
Precipitation Concentration Index (PCI) ℹ️
Last 12 Months: 13.4
Historical Average: 11.9
Percentile Rank of Last 12 Months ℹ️
High: 81st percentile
Low: 94th percentile
Rain: 47th percentile
Change in Variance ℹ️
High: +5.1%
Low: +7.2%
Intraday: -17.3%
Data Coverage
83.2%
First Year of Data
1893
Station Location
Historical Weather Records
| Max High | Avg High | Min High | Max Avg | Avg Avg | Min Avg | Max Low | Avg Low | Min Low | Max Precipitation | Avg Precipitation | Max Snow | Avg Snow | |
|---|---|---|---|---|---|---|---|---|---|---|---|---|---|
| Record | 114.08 °F | — | -2.92 °F | 94.60 °F | — | -5.93 °F | 86.00 °F | — | -22.00 °F | 2.12 in | — | 17.52 in | — |
| January | 69.98 °F | 39.94 °F | 1.94 °F | 53.96 °F | 32.84 °F | -1.84 °F | 57.02 °F | 25.43 °F | -22.00 °F | 1.36 in | 0.08 in | 10.98 in | 0.24 in |
| February | 73.94 °F | 44.91 °F | 5.00 °F | 53.78 °F | 35.74 °F | -1.07 °F | 55.04 °F | 29.05 °F | -9.78 °F | 1.70 in | 0.07 in | 14.02 in | 0.16 in |
| March | 84.02 °F | 53.20 °F | 21.02 °F | 65.30 °F | 42.55 °F | 17.35 °F | 57.02 °F | 33.56 °F | 3.92 °F | 2.08 in | 0.07 in | 5.98 in | 0.06 in |
| April | 93.02 °F | 61.21 °F | 28.94 °F | 70.63 °F | 48.73 °F | 32.81 °F | 59.00 °F | 38.14 °F | 12.02 °F | 1.23 in | 0.05 in | 5.00 in | 0.01 in |
| May | 100.94 °F | 69.44 °F | 39.02 °F | 84.02 °F | 57.38 °F | 40.01 °F | 64.94 °F | 44.22 °F | 17.96 °F | 2.12 in | 0.05 in | 0.00 in | 0.00 in |
| June | 111.02 °F | 76.97 °F | 33.98 °F | 94.60 °F | 64.86 °F | 46.33 °F | 84.92 °F | 49.95 °F | 21.92 °F | 1.62 in | 0.04 in | 0.00 in | 0.00 in |
| July | 109.04 °F | 87.12 °F | 51.08 °F | 91.58 °F | 73.38 °F | 52.32 °F | 86.00 °F | 54.92 °F | 30.02 °F | 1.42 in | 0.02 in | 0.00 in | 0.00 in |
| August | 114.08 °F | 85.64 °F | 39.92 °F | 89.96 °F | 72.61 °F | 52.59 °F | 77.00 °F | 54.19 °F | 28.04 °F | 1.82 in | 0.02 in | 0.00 in | 0.00 in |
| September | 105.08 °F | 75.89 °F | 39.02 °F | 83.95 °F | 63.50 °F | 39.99 °F | 69.98 °F | 47.16 °F | 15.98 °F | 1.40 in | 0.03 in | 0.00 in | 0.00 in |
| October | 91.94 °F | 63.80 °F | 24.98 °F | 70.52 °F | 51.03 °F | 24.60 °F | 64.04 °F | 38.94 °F | 6.98 °F | 1.48 in | 0.05 in | 3.19 in | 0.00 in |
| November | 80.06 °F | 49.32 °F | 6.98 °F | 62.06 °F | 39.59 °F | -0.31 °F | 57.92 °F | 31.96 °F | -9.94 °F | 1.99 in | 0.09 in | 9.21 in | 0.05 in |
| December | 69.08 °F | 41.09 °F | -2.92 °F | 61.88 °F | 32.14 °F | -5.93 °F | 55.94 °F | 27.43 °F | -12.21 °F | 2.06 in | 0.08 in | 17.52 in | 0.19 in |
Data Visualisations
Remove WatermarksCurrent Year Climate Trends vs Historical


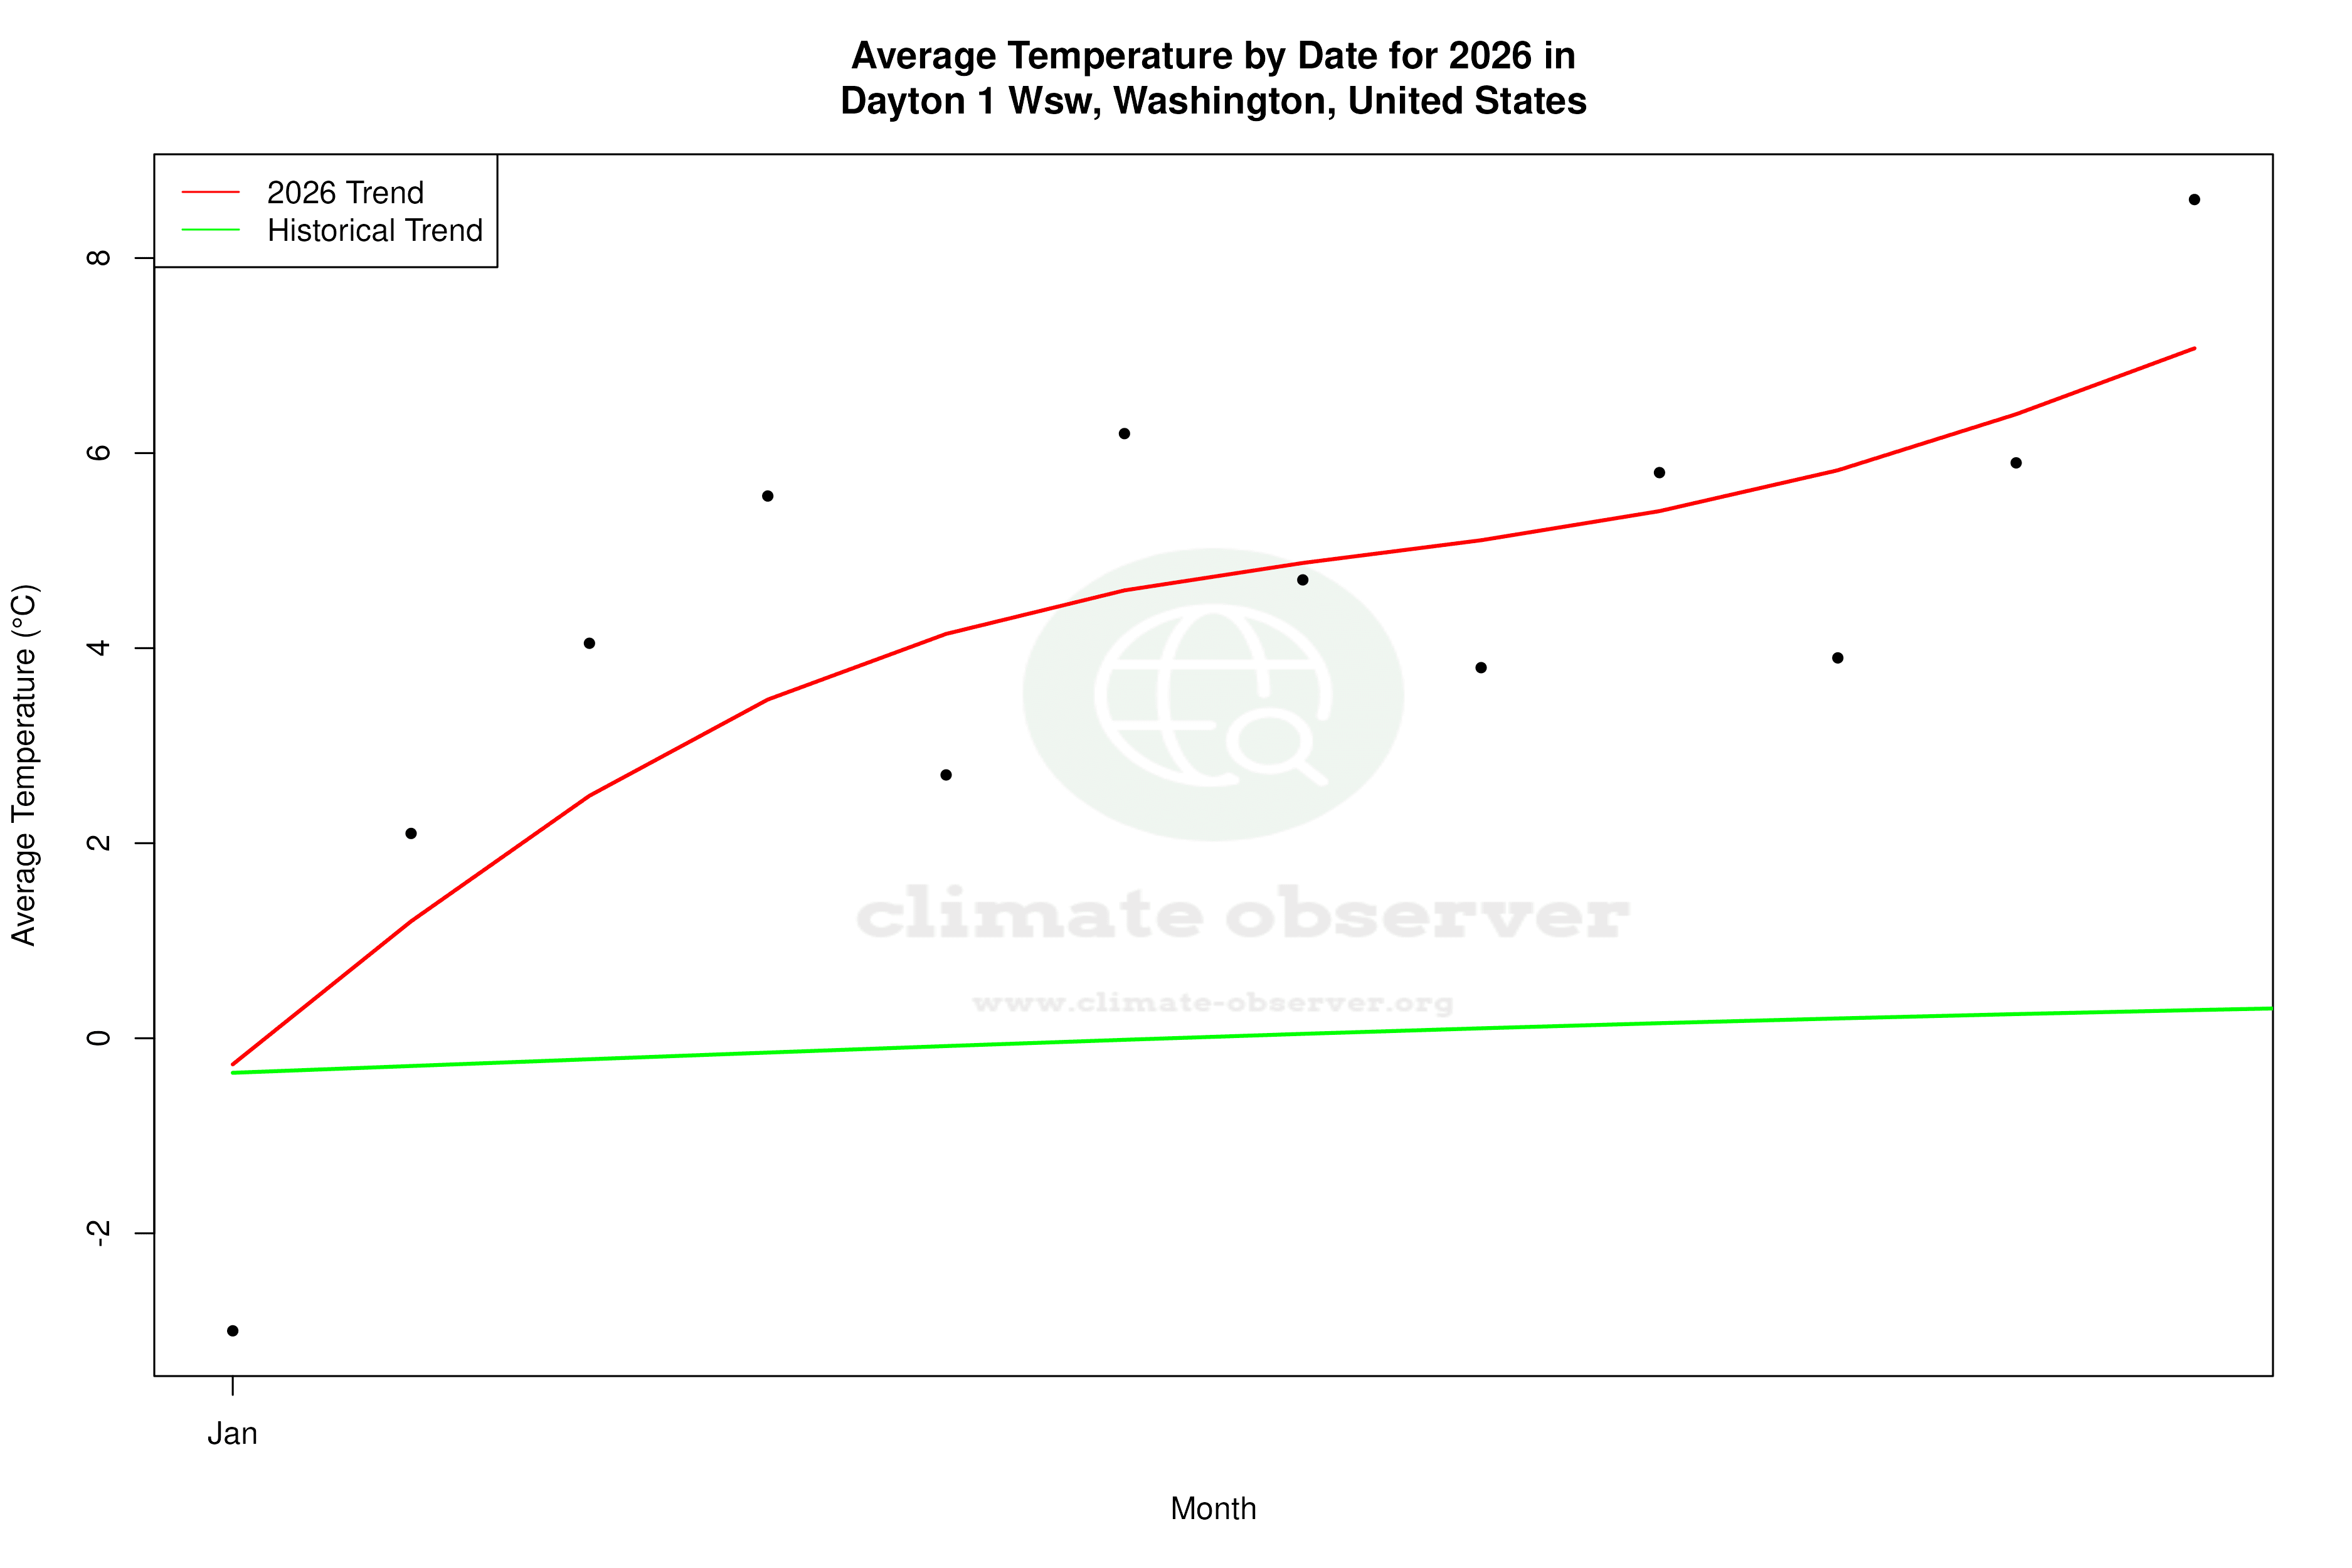


Max Temperature this Year | 1 of 6
Climate 12-Month Moving Averages


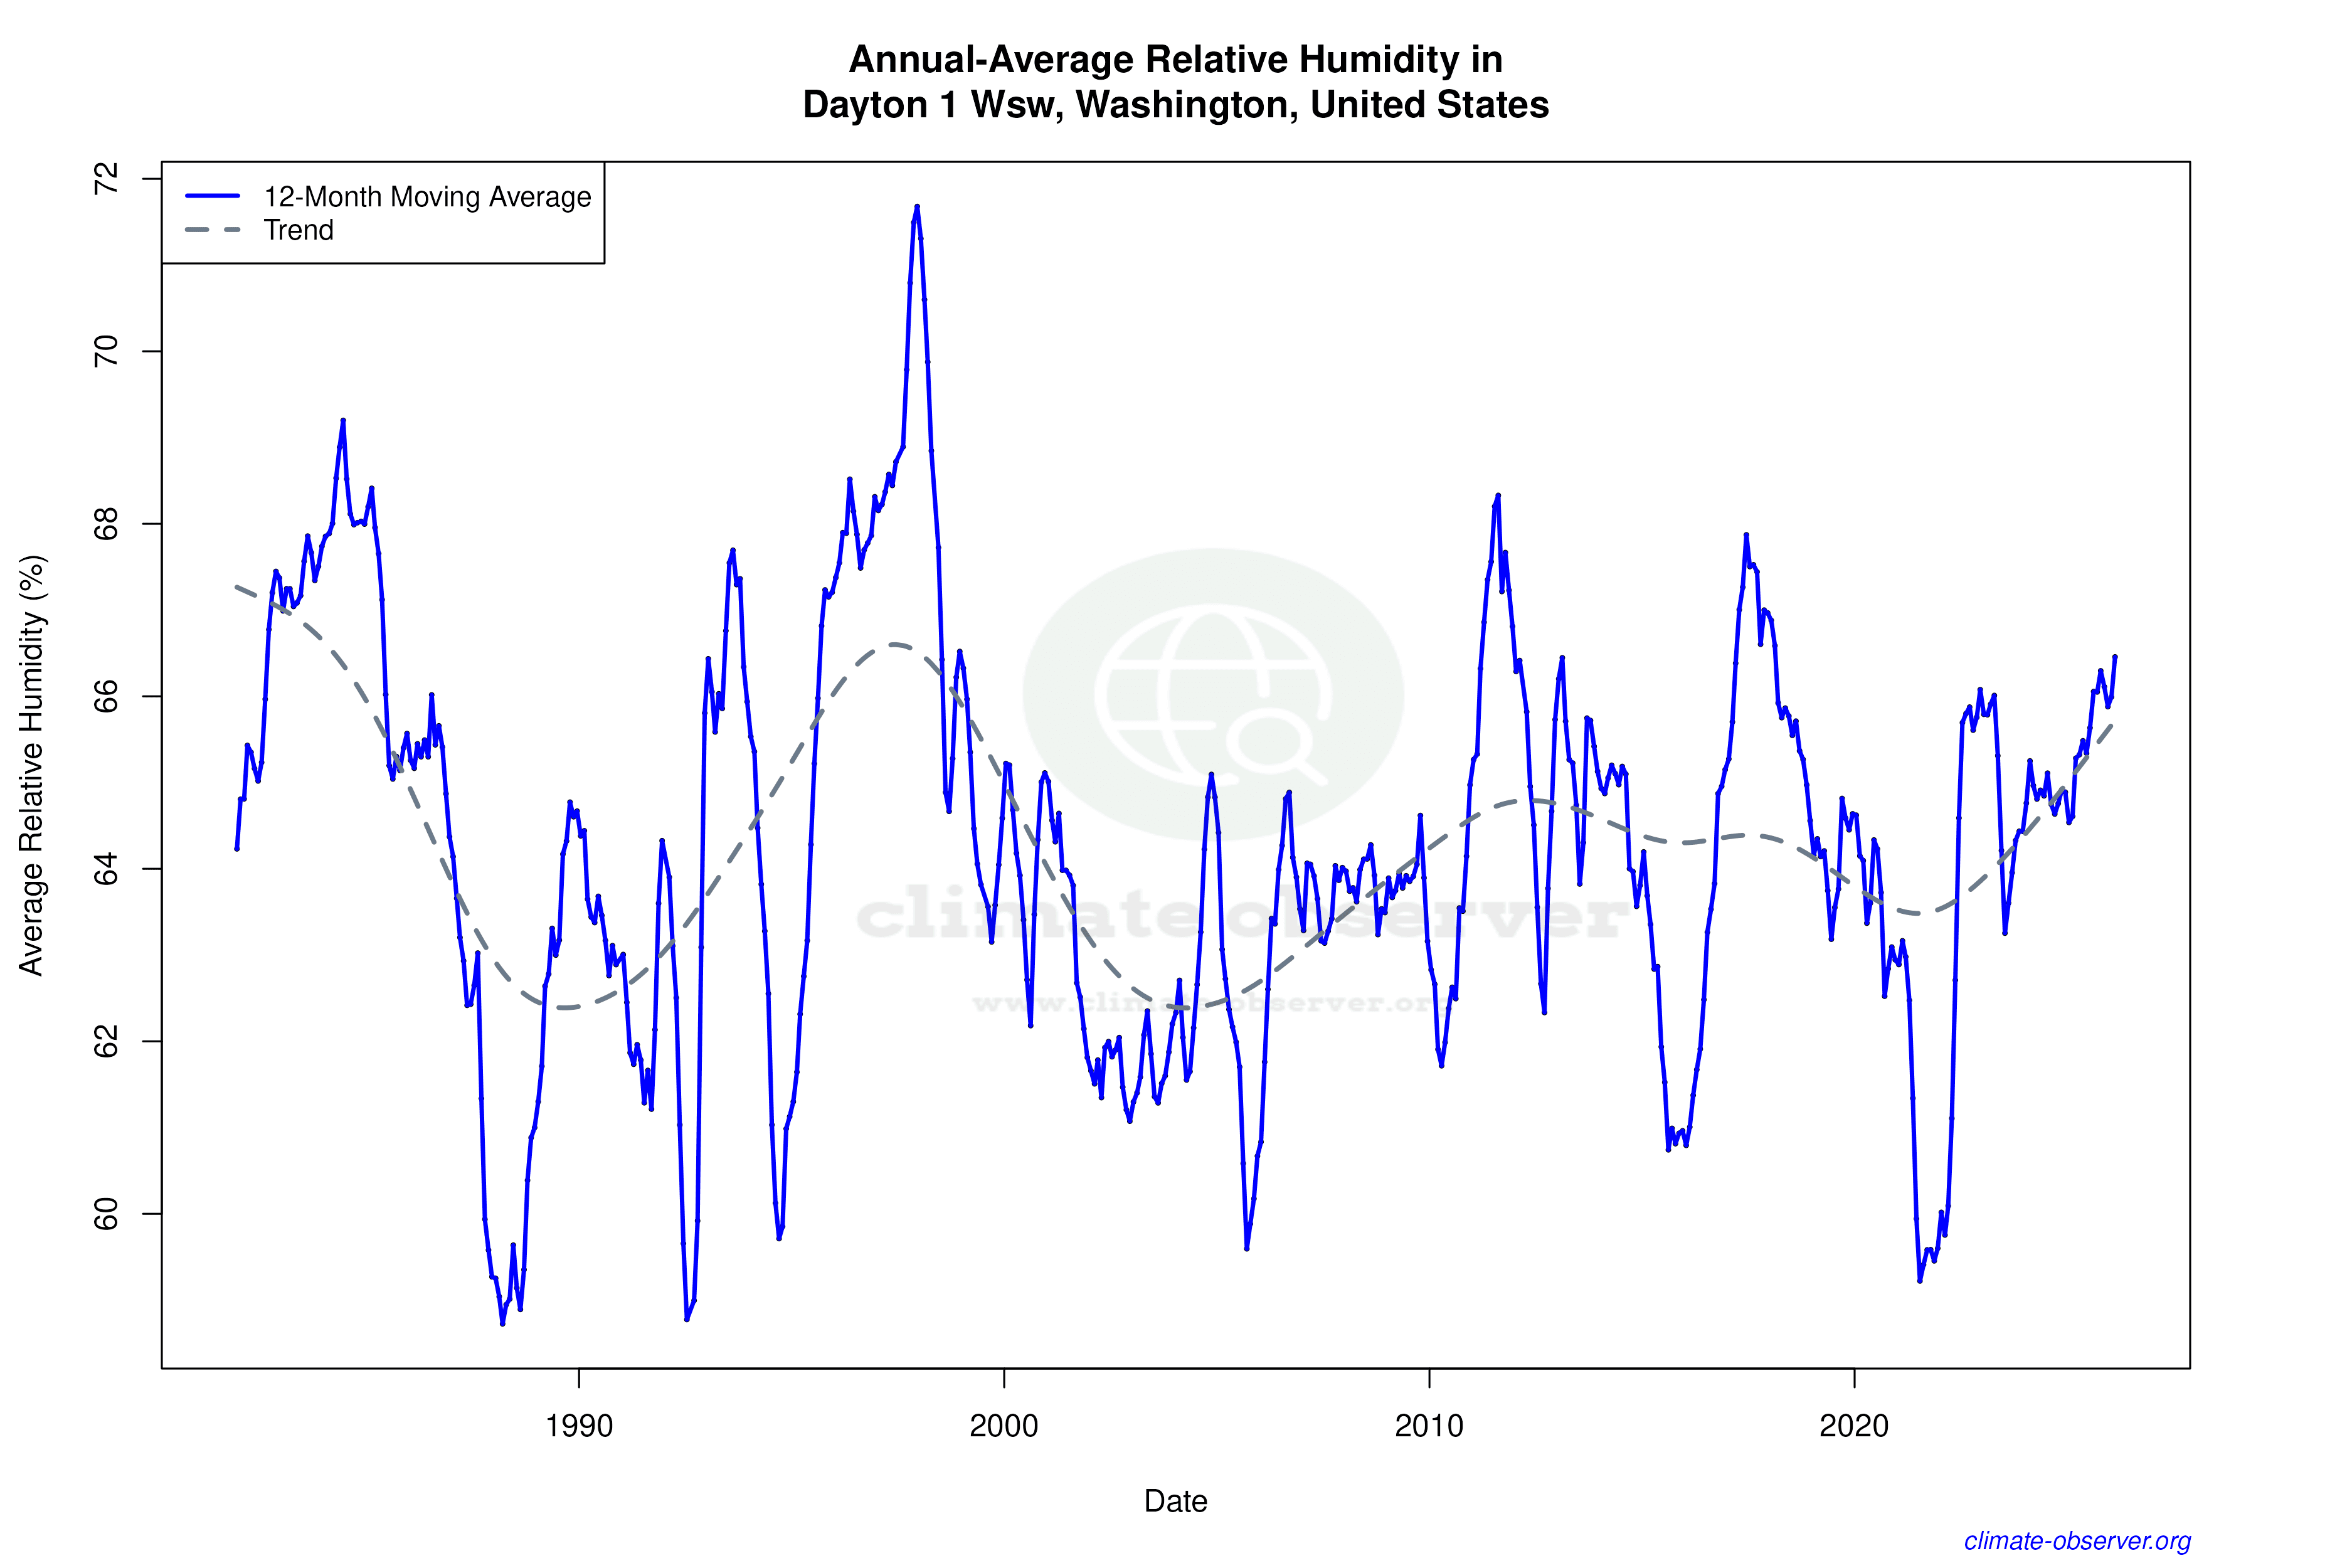

Max Temperature 12-Month MA | 1 of 6
Daily Data Points and Averages Throughout the Year
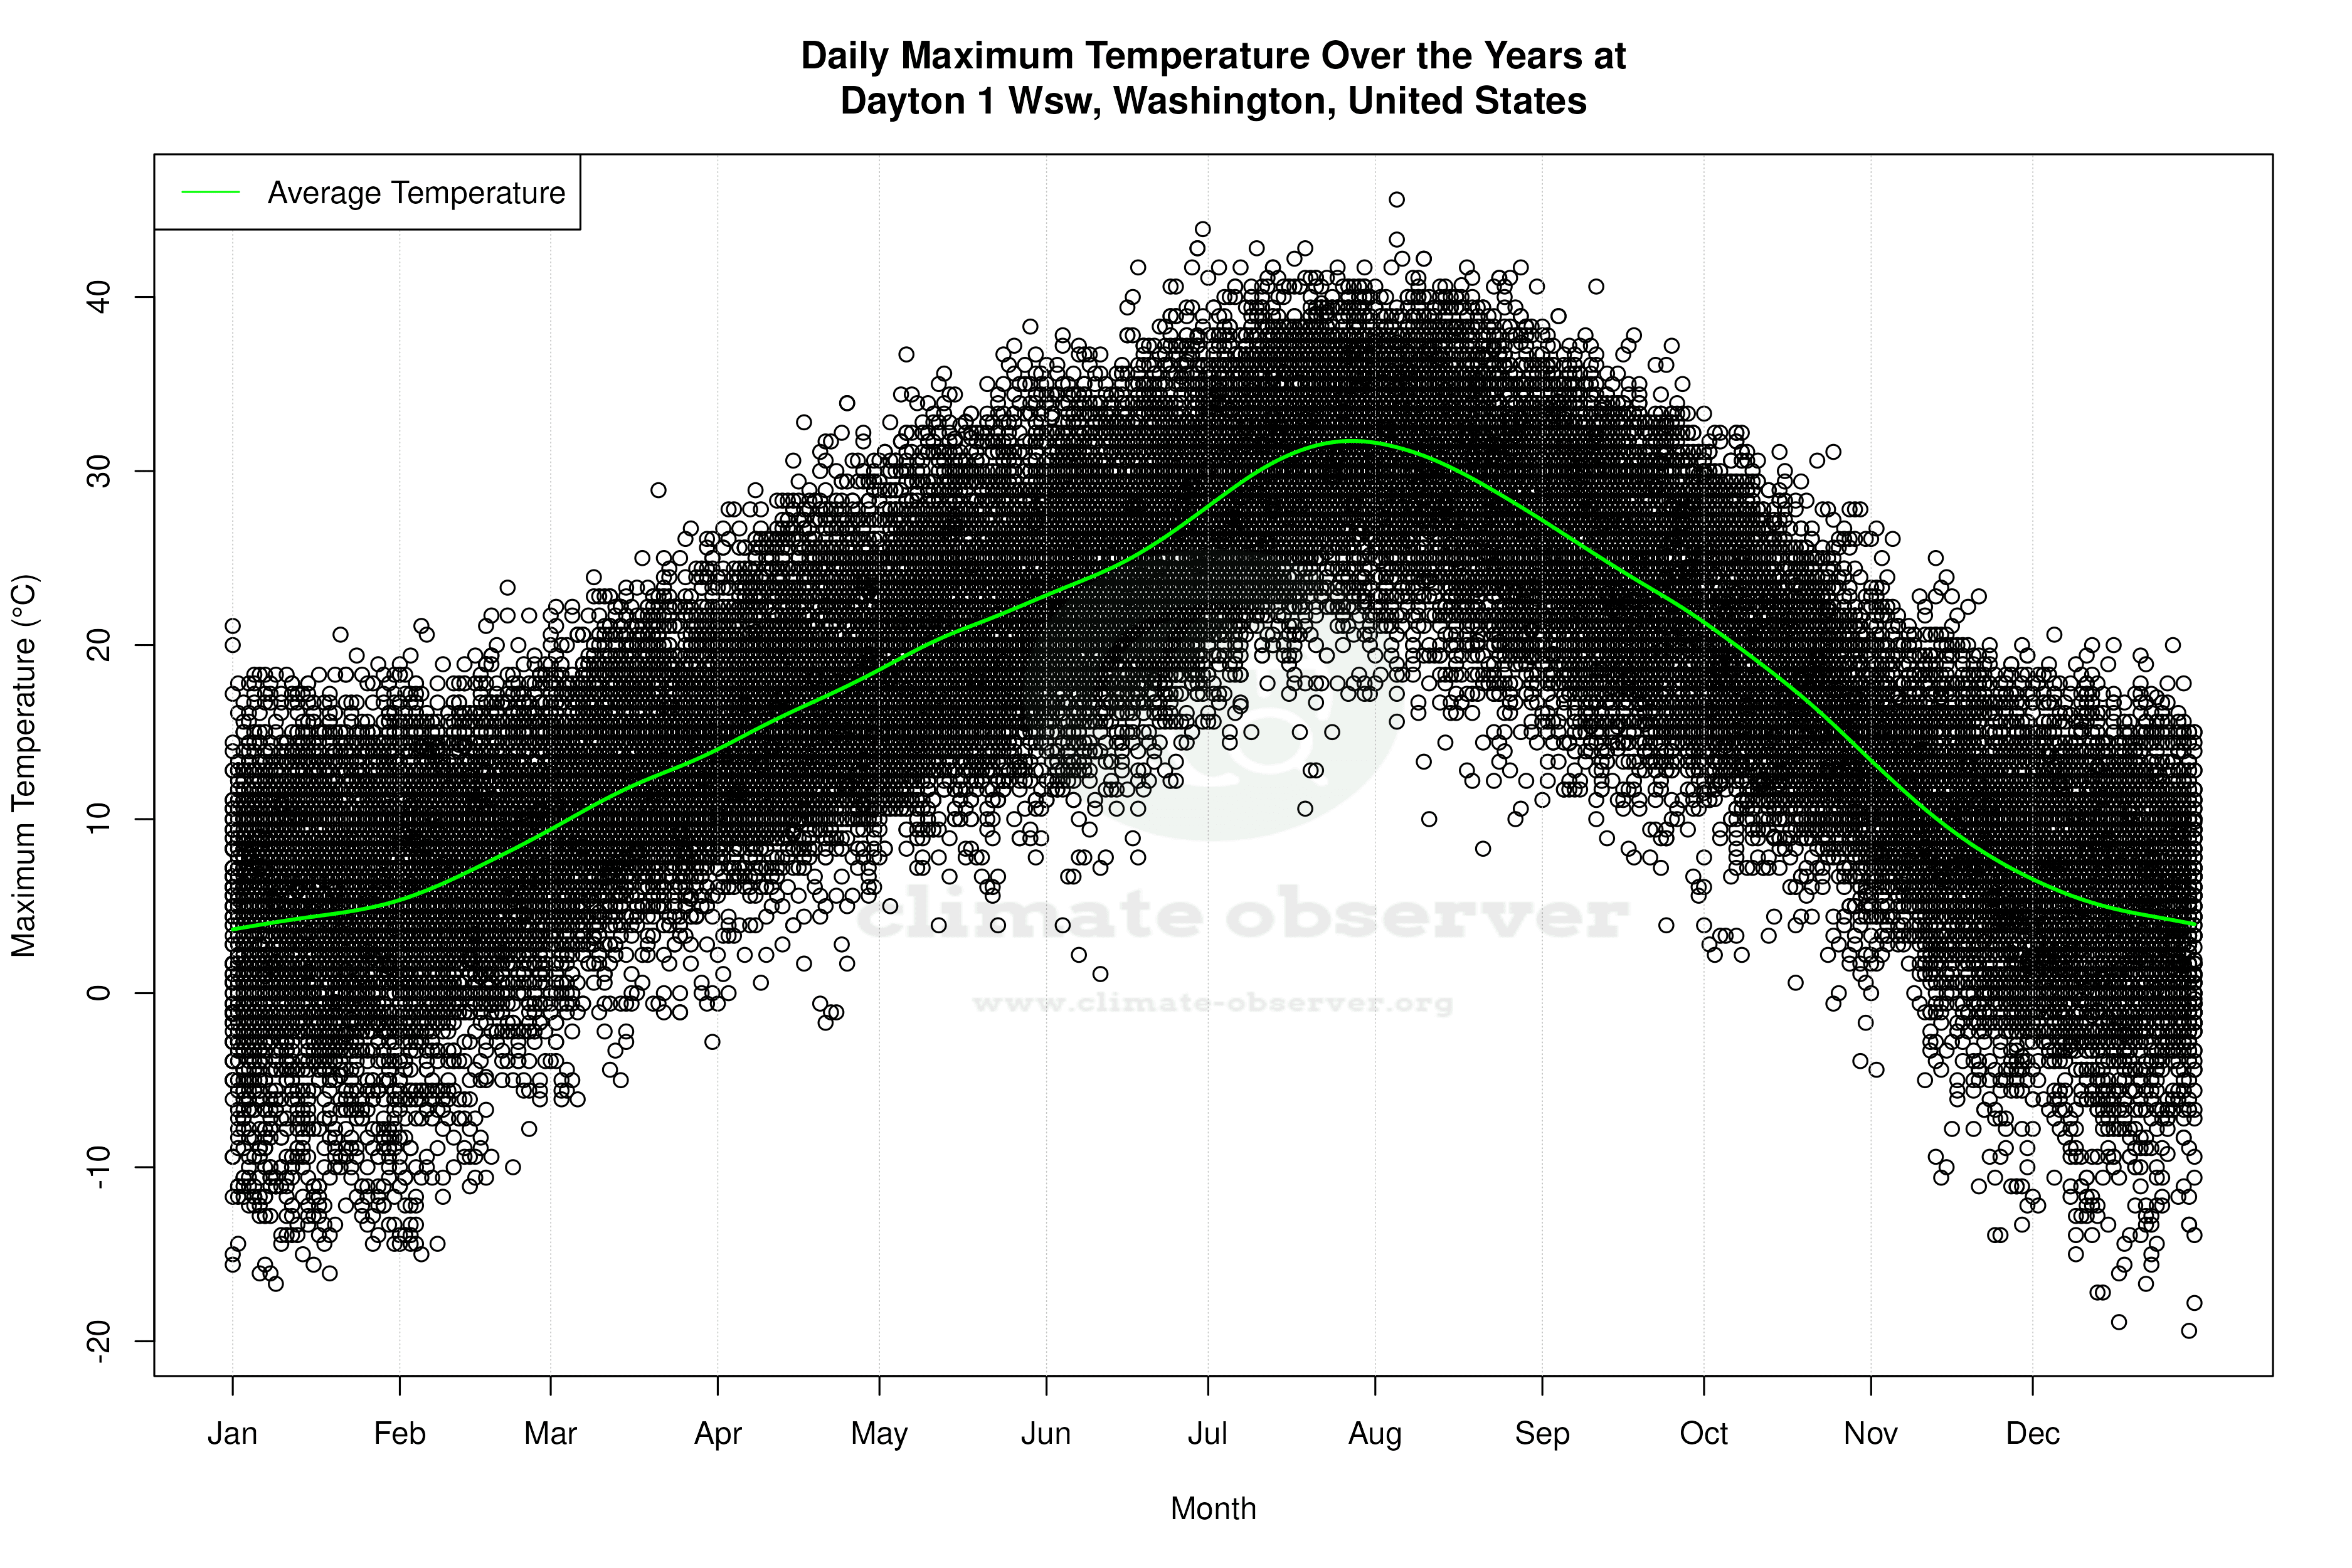


Average Max Temperature Throughout Year | 1 of 5
