Climate for Station: Evanston 1 e, Wyoming, United States
Loading live weather...
Climate Analysis & Overview
Evanston 1 e, located in the heart of Wyoming, is experiencing a nuanced climate evolution with a mix of warming highs and cooling lows over the past decade. The region's precipitation is becoming slightly more evenly distributed, providing a subtle shift in local weather patterns.
Köppen Climate and Geographic Influences
Evanston, Wyoming, falls under the Köppen climate classification of Dfb, which denotes a humid continental climate with warm summers and cold, snowy winters. Situated at an elevation that subjects it to the influences of the Uinta Mountains, the area's climate is shaped by its topography, which can lead to significant temperature variations and precipitation patterns. The presence of the Bear River also plays a role in moderating local temperatures, albeit subtly.
Temperature Trends: A Tale of Two Directions
Over the past decade, Evanston has experienced a warming trend in high temperatures, with an increase of 1.21°C (2.17°F). This contrasts with a cooling trend in low temperatures, which have decreased by 0.46°C (0.83°F). However, when examining the all-time trends, both highs and lows show a warming pattern, albeit more modestly. Highs have risen by 0.13°C (0.23°F), while lows have increased by 0.21°C (0.38°F). This divergence between short-term and long-term trends highlights the complexity of climate dynamics in this region.
Precipitation Patterns: A Subtle Shift
The Precipitation Concentration Index (PCI) for Evanston has seen a slight decrease from a baseline of 12.22 to a current value of 11.46. This indicates that precipitation events are becoming more evenly distributed throughout the year, as opposed to being concentrated in fewer, more intense events. Although the change is marginal, it suggests a trend towards more consistent rainfall, which could have implications for local water resources and agricultural practices.
Record Extremes: The Temperature Bookends
Evanston's climate is marked by its extreme temperature records. The highest recorded temperature is 37.2°C (98.96°F), while the lowest plummets to -38.9°C (-38.02°F). These extremes underscore the area's susceptibility to significant temperature fluctuations, a characteristic feature of its continental climate.
Regional Climate Context and Implications
The climate trends observed in Evanston are occurring against the backdrop of broader regional climate goals in the United States, which aim to mitigate the impacts of climate change through emissions reductions and sustainable practices. Recent weather events, such as unseasonably warm winters or late spring snowfalls, are reflective of the ongoing changes in the region's climate patterns. These shifts are vital for local policymakers and residents to consider in their planning and adaptation strategies.
Station Statistics
10-Year Trend
High: +1.24 °F/decade
Low: -2.16 °F/decade
Rain: -0.024 in/decade
25-Year Trend
High: +1.10 °F/decade
Low: +0.21 °F/decade
Rain: -0.004 in/decade
50-Year Trend
High: +0.23 °F/decade
Low: +0.63 °F/decade
Rain: -0.001 in/decade
All-Time Trend
High: +0.25 °F/decade
Low: +0.39 °F/decade
Rain: +0.001 in/decade
Percentage Above-Average Days
Last 12 Months: 59.2%
This Year: 60.7%
Precipitation Concentration Index (PCI) ℹ️
Last 12 Months: 11.2
Historical Average: 11.1
Percentile Rank of Last 12 Months ℹ️
High: 81st percentile
Low: 80th percentile
Rain: 34th percentile
Change in Variance ℹ️
High: +3.1%
Low: +2.9%
Intraday: -4.0%
Data Coverage
84.1%
First Year of Data
1899
Station Location
Historical Weather Records
| Max High | Avg High | Min High | Max Avg | Avg Avg | Min Avg | Max Low | Avg Low | Min Low | Max Precipitation | Avg Precipitation | Max Snow | Avg Snow | |
|---|---|---|---|---|---|---|---|---|---|---|---|---|---|
| Record | 98.96 °F | — | -16.96 °F | 80.47 °F | — | -19.64 °F | 69.08 °F | — | -38.02 °F | 2.63 in | — | 20.00 in | — |
| January | 57.02 °F | 31.36 °F | -4.00 °F | 41.36 °F | 19.79 °F | -14.26 °F | 35.96 °F | 7.94 °F | -34.96 °F | 0.85 in | 0.04 in | 20.00 in | 0.35 in |
| February | 69.98 °F | 33.92 °F | -5.08 °F | 45.50 °F | 22.01 °F | -12.55 °F | 46.04 °F | 10.39 °F | -38.02 °F | 1.32 in | 0.04 in | 12.99 in | 0.35 in |
| March | 75.02 °F | 41.29 °F | 10.04 °F | 58.14 °F | 30.85 °F | 4.28 °F | 48.42 °F | 17.32 °F | -29.92 °F | 2.00 in | 0.04 in | 20.00 in | 0.27 in |
| April | 93.02 °F | 51.96 °F | 21.92 °F | 61.34 °F | 38.25 °F | 15.62 °F | 57.92 °F | 25.54 °F | -7.06 °F | 1.00 in | 0.05 in | 7.99 in | 0.16 in |
| May | 87.98 °F | 62.30 °F | 32.09 °F | 71.98 °F | 48.02 °F | 25.41 °F | 60.08 °F | 32.90 °F | 8.96 °F | 2.63 in | 0.05 in | 10.98 in | 0.06 in |
| June | 98.96 °F | 72.48 °F | 35.96 °F | 77.67 °F | 58.98 °F | 34.09 °F | 69.08 °F | 39.50 °F | 19.04 °F | 1.56 in | 0.04 in | 9.02 in | 0.01 in |
| July | 98.96 °F | 81.44 °F | 55.94 °F | 80.47 °F | 67.49 °F | 45.75 °F | 66.87 °F | 45.61 °F | 24.08 °F | 1.87 in | 0.03 in | 0.51 in | 0.00 in |
| August | 93.92 °F | 79.60 °F | 53.06 °F | 77.99 °F | 65.41 °F | 46.40 °F | 69.08 °F | 44.23 °F | 23.00 °F | 1.54 in | 0.03 in | 0.00 in | 0.00 in |
| September | 93.02 °F | 71.00 °F | 33.08 °F | 76.82 °F | 55.56 °F | 26.44 °F | 62.06 °F | 36.14 °F | 3.02 °F | 1.42 in | 0.04 in | 14.02 in | 0.02 in |
| October | 82.04 °F | 58.10 °F | 10.04 °F | 65.66 °F | 42.33 °F | 6.26 °F | 51.08 °F | 27.38 °F | -7.96 °F | 1.17 in | 0.04 in | 12.01 in | 0.09 in |
| November | 69.08 °F | 43.06 °F | 3.02 °F | 52.52 °F | 29.59 °F | -1.48 °F | 42.98 °F | 17.37 °F | -22.00 °F | 1.26 in | 0.04 in | 12.01 in | 0.24 in |
| December | 64.04 °F | 33.06 °F | -16.96 °F | 44.96 °F | 20.57 °F | -19.64 °F | 50.00 °F | 9.66 °F | -34.06 °F | 0.95 in | 0.04 in | 10.98 in | 0.29 in |
Data Visualisations
Remove WatermarksCurrent Year Climate Trends vs Historical


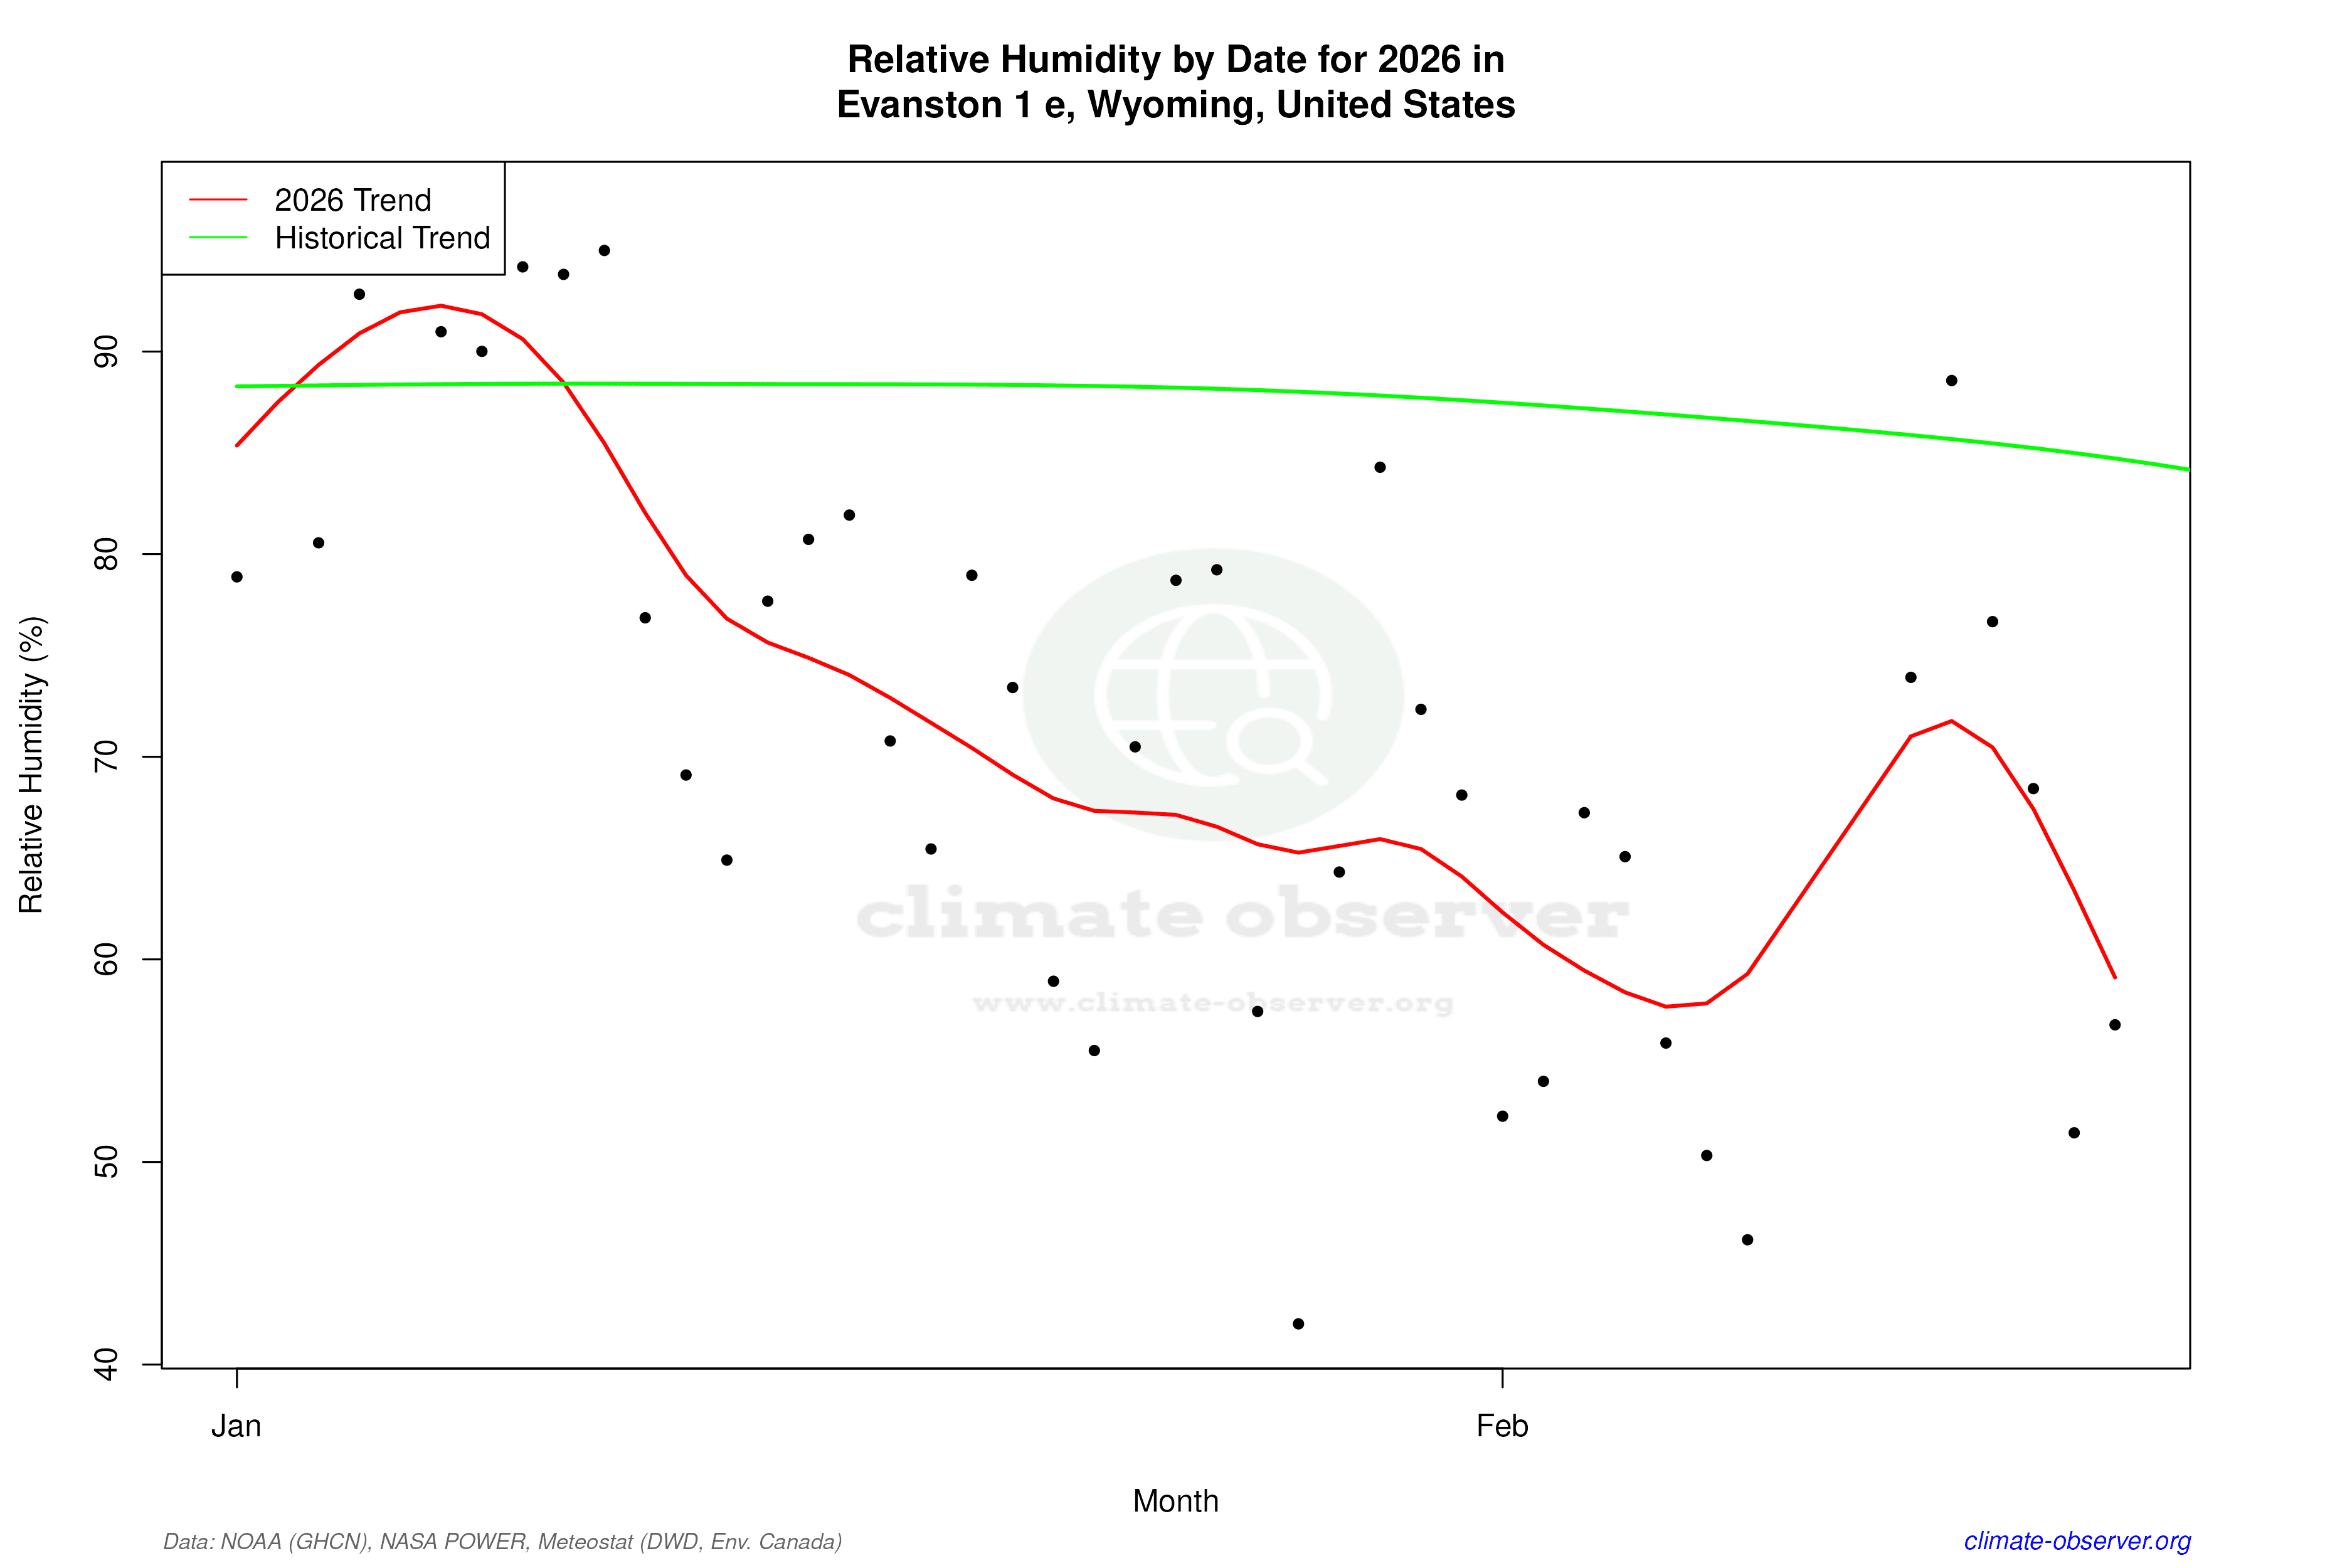

Max Temperature this Year | 1 of 6
Climate 12-Month Moving Averages


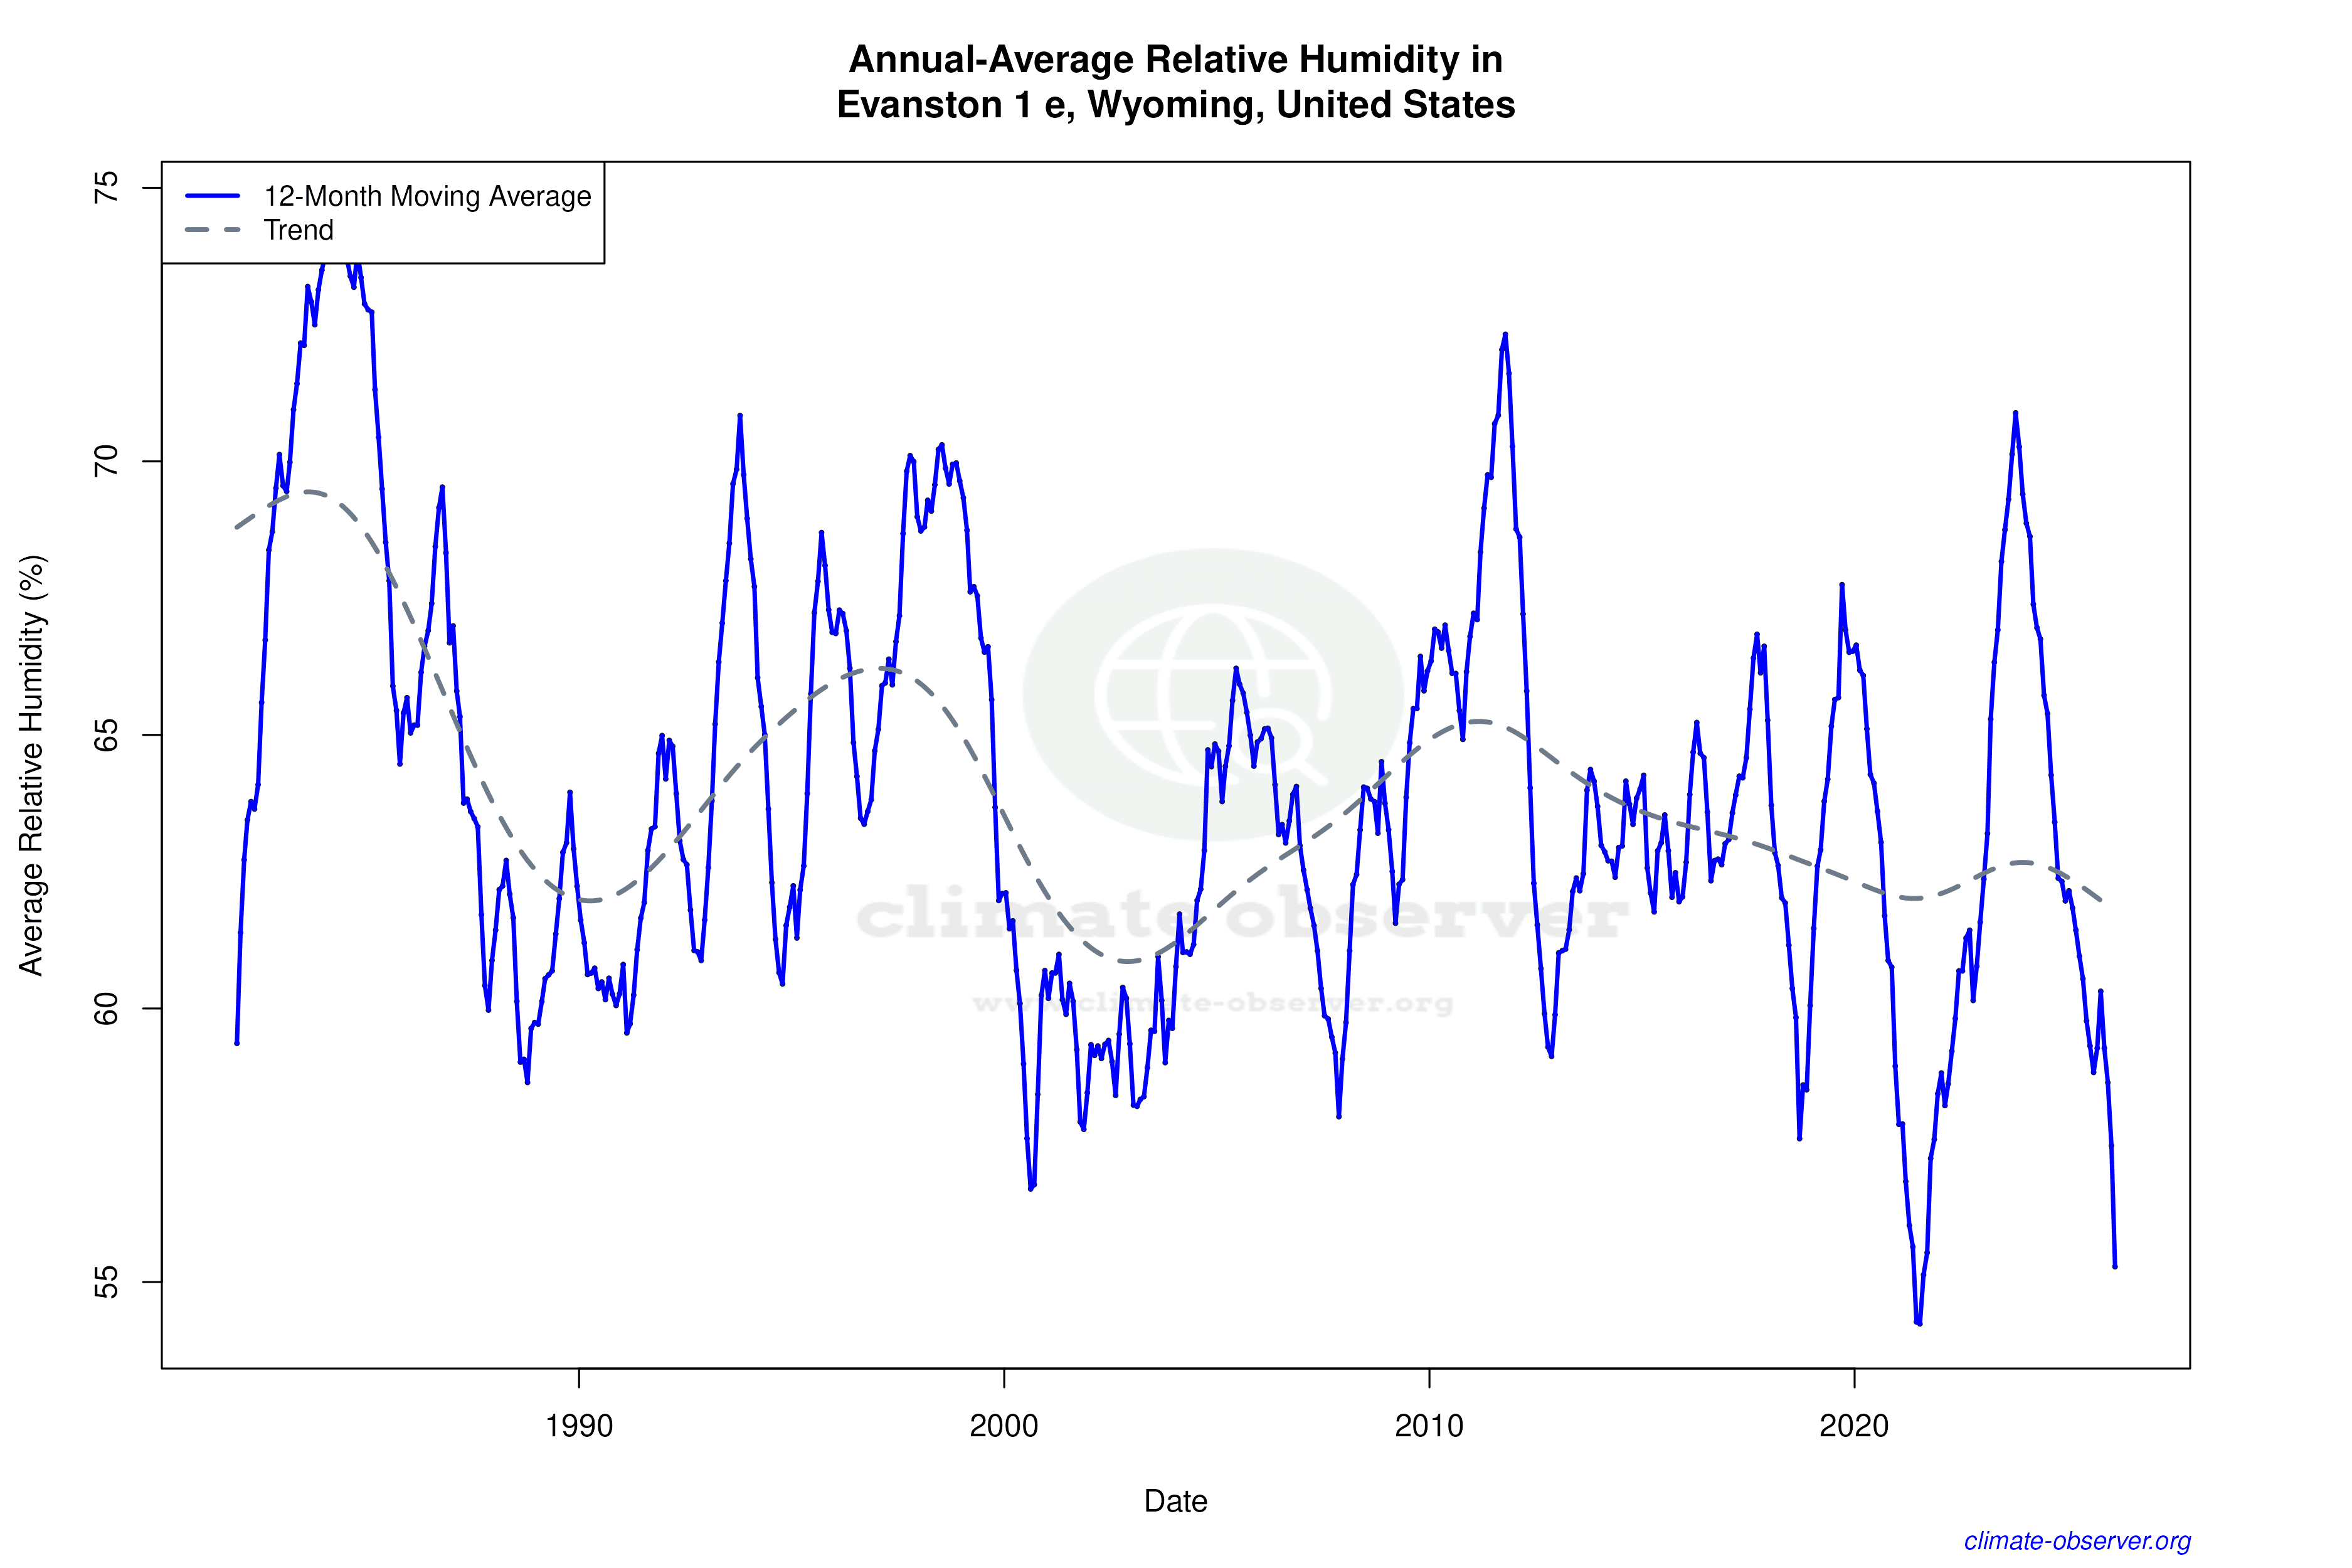

Max Temperature 12-Month MA | 1 of 6
Daily Data Points and Averages Throughout the Year


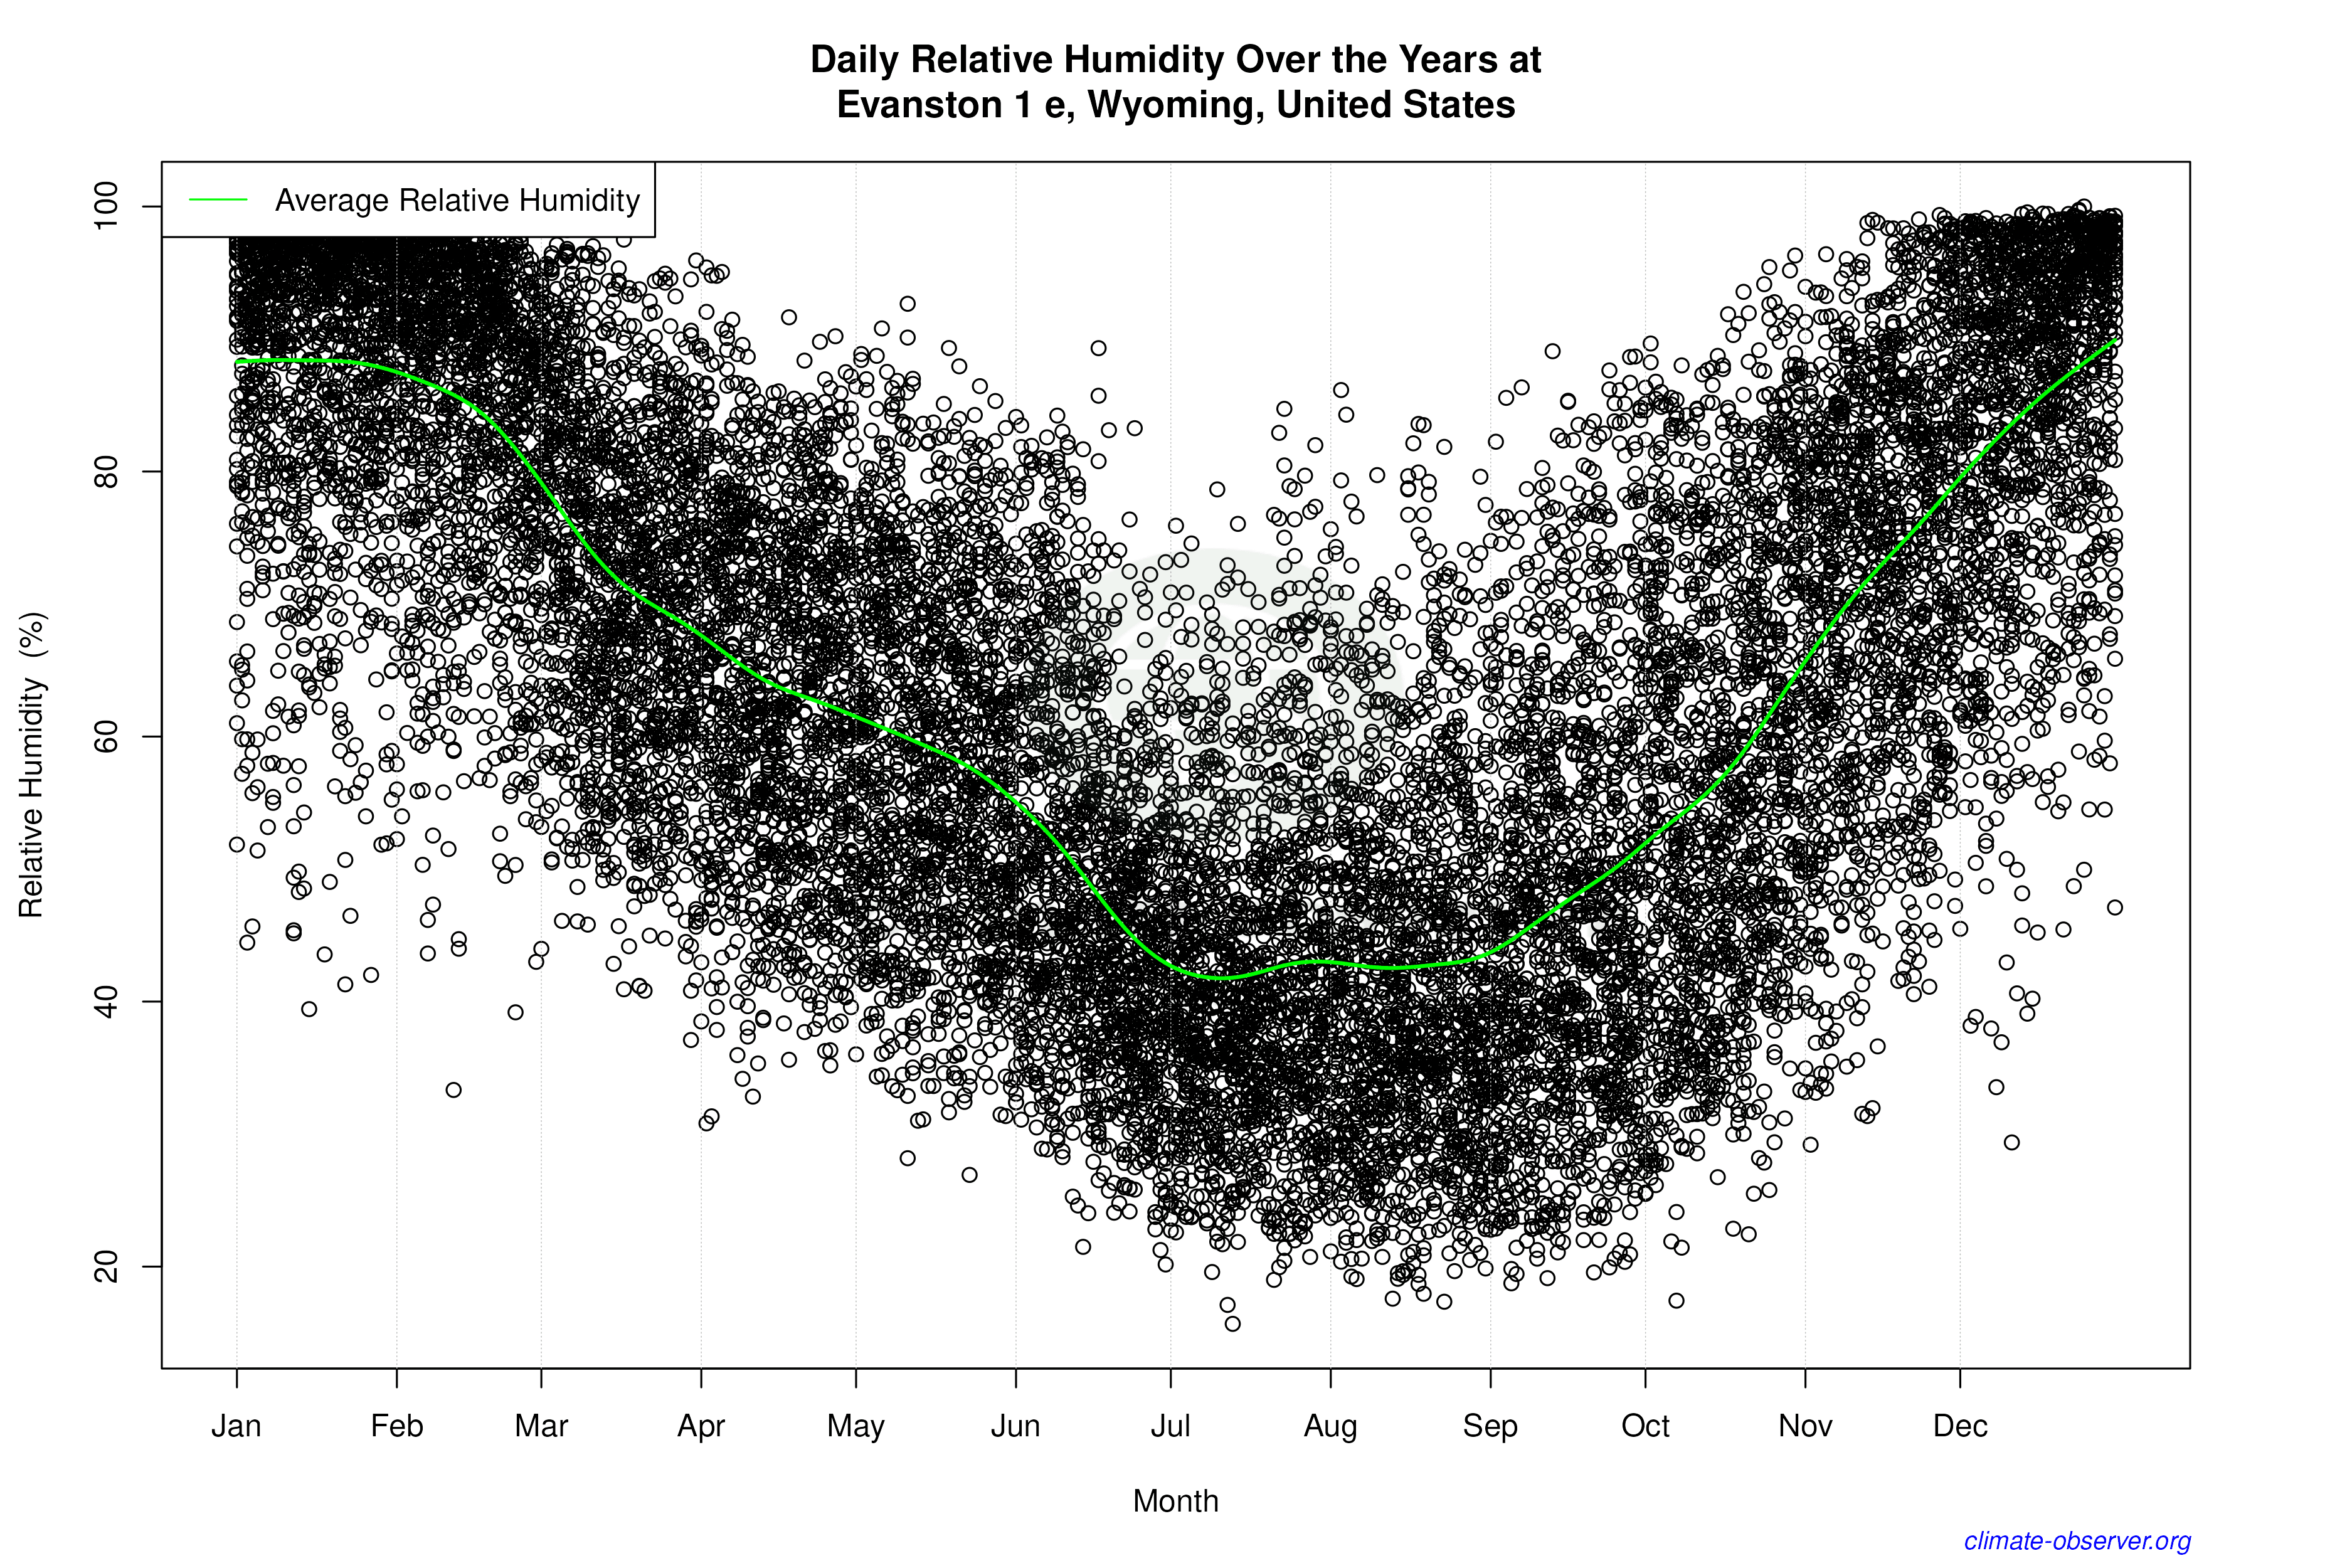

Average Max Temperature Throughout Year | 1 of 5
