Climate for Station: Lake Yellowstone, Wyoming, United States
Loading live weather...
Climate Analysis & Overview
Lake Yellowstone's climate is characterised by a subtle warming trend over the long term, despite recent cooling in the past decade. The region's precipitation patterns remain largely stable, with only a marginal change in concentration. This nuanced climate profile reflects the complex interplay of local geography and broader climatic shifts.
Geographical Influences and Climate Classification
Lake Yellowstone, situated at 44.5622°N, 110.3986°W in Wyoming, is enveloped by the majestic landscapes of the Yellowstone National Park. This location falls under the Köppen climate classification of Dfc, denoting a subarctic climate with cool summers and cold, snowy winters. The park's high elevation and mountainous terrain significantly influence local weather patterns, contributing to its pronounced temperature variations and precipitation distribution.
Long-term Warming Amid Recent Cooling
Over the all-time recorded period, Lake Yellowstone has experienced a slight warming trend, with high temperatures rising by 0.01°C (0.02°F) and low temperatures by 0.15°C (0.27°F). This is contrasted by the past decade, which has seen a cooling trend with high temperatures falling by 1.02°C (1.84°F) and low temperatures by 1.45°C (2.62°F). These recent declines suggest a temporary deviation from the long-term warming pattern, possibly influenced by localised climatic phenomena or broader atmospheric changes.
Temperature Extremes and Variability
The region is marked by significant temperature extremes, with recorded highs reaching 34.4°C (93.9°F) and lows plummeting to -48.9°C (-56.0°F). Such variability is typical for high-altitude, interior continental climates, where rapid temperature shifts can occur. These extremes underscore the resilience required for both the ecosystem and human activities in the area.
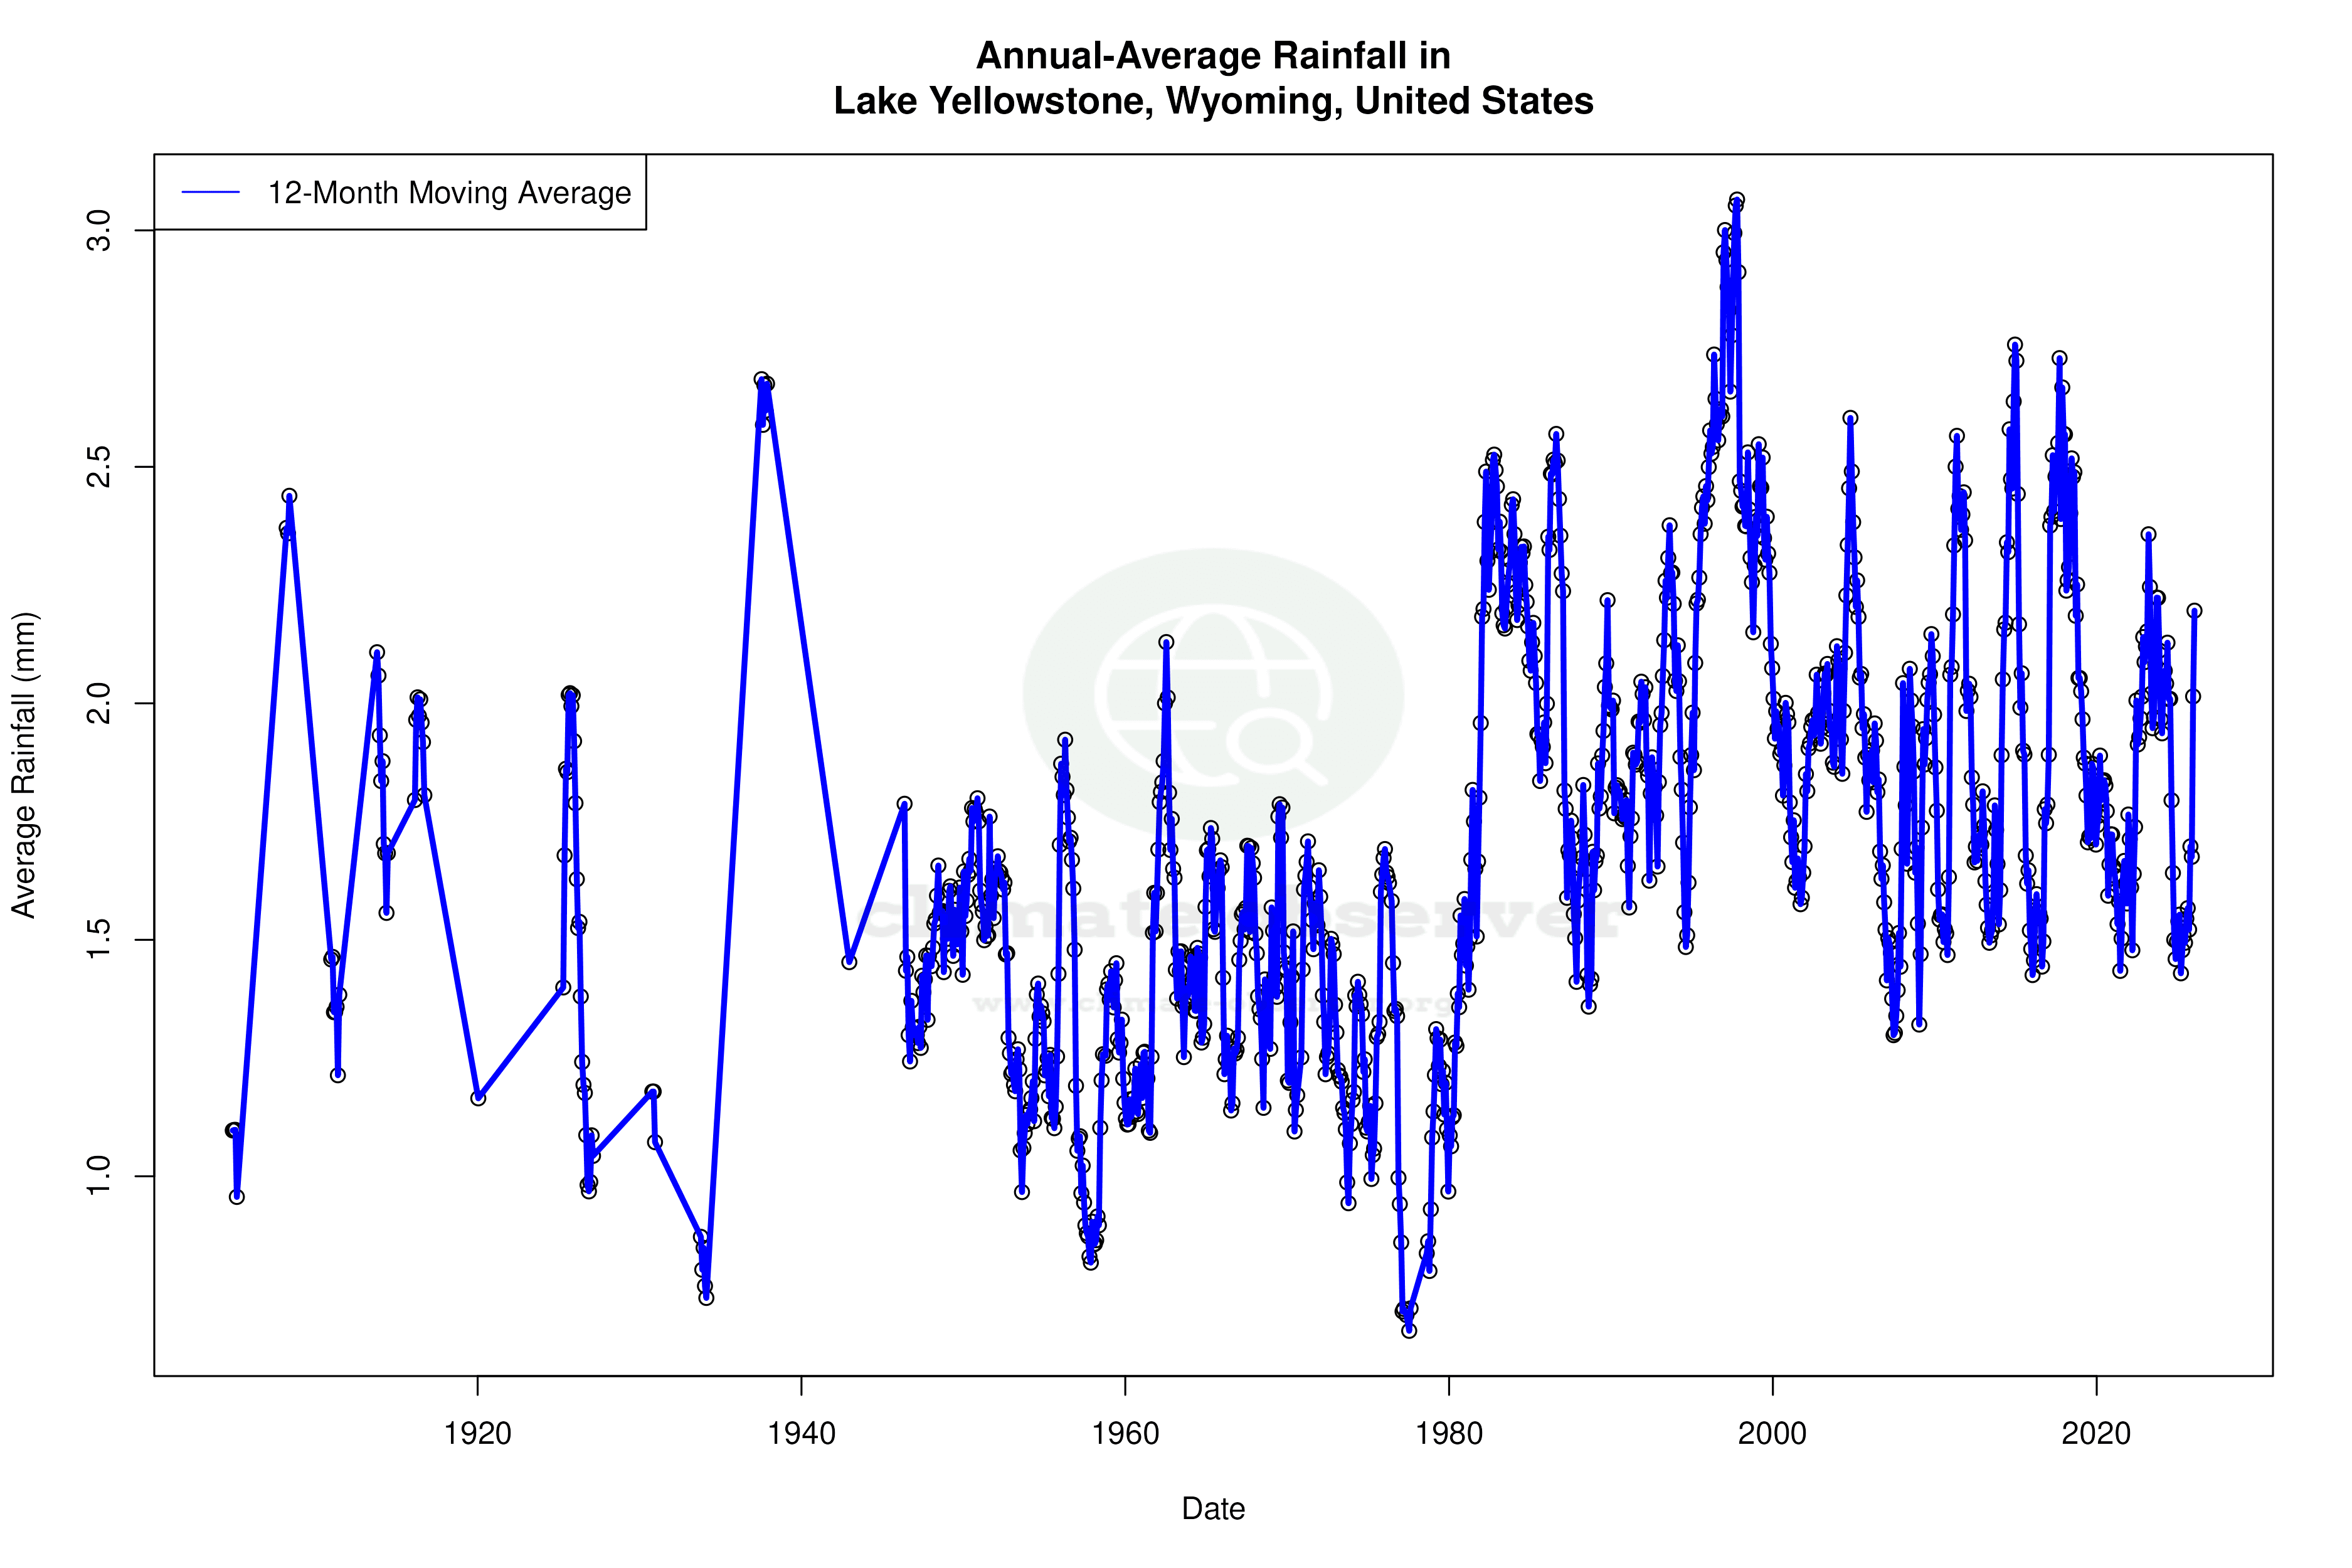
Precipitation Patterns and Stability
The Precipitation Concentration Index (PCI) for Lake Yellowstone shows a baseline of 11.04, with a current value of 11.04, indicating a marginal increase. A PCI above 20 suggests highly concentrated precipitation events, while values below 10 indicate more evenly distributed rainfall. The current PCI implies that precipitation remains relatively evenly distributed, with only a slight increase in concentration over time. This stability is crucial for maintaining the ecological balance within the park.
Regional Climate Context and Implications
The climate profile of Lake Yellowstone is set against the backdrop of the United States' regional climate goals, which aim to mitigate the impacts of climate change through adaptive strategies and emissions reductions. Understanding localised trends, such as those observed at Lake Yellowstone, is essential for informing these broader efforts. Recent weather events in the region, including unseasonably warm spells or sudden cold snaps, further highlight the importance of ongoing monitoring and research to anticipate and adapt to future climatic shifts.
Station Statistics
10-Year Trend
High: +1.02 °F/decade
Low: -0.25 °F/decade
Rain: -0.016 in/decade
25-Year Trend
High: -0.19 °F/decade
Low: +1.89 °F/decade
Rain: -0.001 in/decade
50-Year Trend
High: +0.12 °F/decade
Low: +1.36 °F/decade
Rain: +0.001 in/decade
All-Time Trend
High: +0.04 °F/decade
Low: +0.27 °F/decade
Rain: +0.003 in/decade
Percentage Above-Average Days
Last 12 Months: 49.9%
This Year: 41.4%
Precipitation Concentration Index (PCI) ℹ️
Last 12 Months: 10.8
Historical Average: 10.7
Percentile Rank of Last 12 Months ℹ️
High: 86th percentile
Low: 97th percentile
Rain: 55th percentile
Change in Variance ℹ️
High: +10.0%
Low: -16.1%
Intraday: -23.3%
Data Coverage
82.8%
First Year of Data
1904
Station Location
Historical Weather Records
| Max High | Avg High | Min High | Max Avg | Avg Avg | Min Avg | Max Low | Avg Low | Min Low | Max Precipitation | Avg Precipitation | Max Snow | Avg Snow | |
|---|---|---|---|---|---|---|---|---|---|---|---|---|---|
| Record | 93.92 °F | — | -14.98 °F | 72.36 °F | — | -31.27 °F | 68.00 °F | — | -56.02 °F | 3.27 in | — | 17.99 in | — |
| January | 48.02 °F | 22.88 °F | -14.08 °F | 51.62 °F | 11.49 °F | -26.50 °F | 32.00 °F | -0.42 °F | -50.98 °F | 1.70 in | 0.08 in | 17.99 in | 1.09 in |
| February | 55.94 °F | 27.52 °F | -14.98 °F | 34.34 °F | 13.28 °F | -22.18 °F | 33.08 °F | 0.24 °F | -56.02 °F | 2.00 in | 0.07 in | 14.02 in | 0.89 in |
| March | 60.08 °F | 34.63 °F | 8.96 °F | 42.44 °F | 20.71 °F | -11.56 °F | 33.98 °F | 5.64 °F | -43.06 °F | 1.20 in | 0.07 in | 17.99 in | 0.86 in |
| April | 73.04 °F | 42.79 °F | 12.02 °F | 51.55 °F | 28.18 °F | 1.76 °F | 39.92 °F | 15.84 °F | -29.02 °F | 1.12 in | 0.07 in | 14.02 in | 0.57 in |
| May | 78.08 °F | 51.66 °F | 19.94 °F | 58.96 °F | 38.64 °F | 17.06 °F | 55.94 °F | 25.81 °F | -2.02 °F | 1.70 in | 0.07 in | 15.98 in | 0.25 in |
| June | 91.04 °F | 61.54 °F | 33.98 °F | 68.86 °F | 48.25 °F | 28.85 °F | 60.98 °F | 33.66 °F | 14.00 °F | 1.42 in | 0.07 in | 9.02 in | 0.05 in |
| July | 91.94 °F | 71.77 °F | 41.00 °F | 72.36 °F | 56.51 °F | 38.30 °F | 68.00 °F | 39.33 °F | 15.08 °F | 1.32 in | 0.05 in | 4.02 in | 0.00 in |
| August | 93.92 °F | 70.86 °F | 41.00 °F | 70.66 °F | 55.06 °F | 35.60 °F | 66.92 °F | 37.91 °F | 12.92 °F | 1.40 in | 0.05 in | 4.02 in | 0.00 in |
| September | 91.04 °F | 61.62 °F | 28.04 °F | 64.42 °F | 45.61 °F | 19.40 °F | 66.02 °F | 30.79 °F | -5.08 °F | 1.63 in | 0.05 in | 12.99 in | 0.07 in |
| October | 89.06 °F | 48.87 °F | 10.04 °F | 52.95 °F | 33.69 °F | 1.45 °F | 44.96 °F | 23.00 °F | -18.35 °F | 3.27 in | 0.06 in | 9.02 in | 0.28 in |
| November | 71.60 °F | 34.24 °F | -0.94 °F | 54.86 °F | 21.46 °F | -7.96 °F | 39.20 °F | 12.69 °F | -29.92 °F | 1.75 in | 0.07 in | 15.98 in | 0.75 in |
| December | 64.40 °F | 25.12 °F | -14.98 °F | 62.96 °F | 13.03 °F | -31.27 °F | 41.00 °F | 4.00 °F | -47.92 °F | 1.78 in | 0.07 in | 15.00 in | 0.92 in |
Data Visualisations
Remove WatermarksCurrent Year Climate Trends vs Historical


Max Temperature this Year | 1 of 6
Climate 12-Month Moving Averages


Max Temperature 12-Month MA | 1 of 6
Daily Data Points and Averages Throughout the Year


Average Max Temperature Throughout Year | 1 of 5
