Climate for Station: Booth Lake Alaska, Alaska, United States
Loading live weather...
Climate Analysis & Overview
Booth Lake, Alaska, situated on Kodiak Island, presents a compelling case of climatic contrasts, with recent warming trends in highs and lows juxtaposed against long-term cooling. The absence of precipitation concentration data leaves a gap in understanding the hydrological dynamics of the region.
Climatic Dichotomy on Kodiak Island
Booth Lake, located at 57.2678°N, -154.565°W on Kodiak Island, Alaska, finds itself in a subarctic maritime climate zone, characterised by cool summers and relatively mild winters. The island's geography, surrounded by the North Pacific Ocean, plays a crucial role in moderating temperatures and influencing weather patterns. Recent data reveals a 10-year warming trend with highs increasing by 0.66°C (1.19°F) and lows by 0.88°C (1.58°F). However, when viewed through the lens of all-time data, the region has experienced a cooling trend with highs falling by 0.50°C (0.90°F) and lows by 0.45°C (0.81°F). This duality underscores the complexity of climate dynamics in this unique location.
Temperature Extremes and Records
Booth Lake has recorded significant temperature extremes, with a maximum high of 27.8°C (82.0°F) and a minimum low of -23.9°C (-11.0°F). These records highlight the broad thermal range experienced in this subarctic maritime climate. The cooling all-time trends suggest a historical shift towards lower temperatures, contrasting with the recent decade's warming, possibly influenced by broader regional or global climate fluctuations.
Precipitation Patterns and Data Gaps
The Precipitation Concentration Index (PCI) provides insights into how rainfall is distributed over time. However, Booth Lake's PCI data is currently unavailable, indicating a monitoring gap. This absence leaves questions about whether precipitation is becoming more concentrated in fewer events or more evenly distributed. Understanding these patterns is crucial for assessing potential impacts on local ecosystems and water resources.
Regional Climate Context and Implications
As part of the United States, Alaska plays a critical role in national climate strategies, particularly in monitoring and adapting to climate change impacts. The contrasting trends observed at Booth Lake may reflect broader regional climate shifts, potentially influencing local biodiversity and community resilience. Recent warming trends could align with global patterns of increasing temperatures, while the historical cooling might be attributed to natural variability or regional climatic influences.
Navigating Climate Uncertainties
The juxtaposition of short-term warming against long-term cooling trends at Booth Lake exemplifies the complexities faced by climatologists in deciphering climate signals. The absence of PCI data further complicates the narrative, highlighting the need for comprehensive monitoring to better understand and predict future climatic shifts in this ecologically significant region.
Station Statistics
10-Year Trend
High: +1.16 °F/decade
Low: +1.72 °F/decade
Rain: N/A
25-Year Trend
High: -0.91 °F/decade
Low: -0.82 °F/decade
Rain: N/A
50-Year Trend
High: -0.91 °F/decade
Low: -0.82 °F/decade
Rain: N/A
All-Time Trend
High: -0.91 °F/decade
Low: -0.82 °F/decade
Rain: N/A
Percentage Above-Average Days
Last 12 Months: 52.3%
This Year: N/A%
Precipitation Concentration Index (PCI) ℹ️
Last 12 Months: N/A
Historical Average: N/A
Percentile Rank of Last 12 Months ℹ️
High: 86th percentile
Low: 89th percentile
Rain: N/A
Change in Variance ℹ️
High: +6.7%
Low: +11.1%
Intraday: -10.4%
Data Coverage
74.3%
First Year of Data
1995
Station Location
Historical Weather Records
| Max High | Avg High | Min High | Max Avg | Avg Avg | Min Avg | Max Low | Avg Low | Min Low | Max Precipitation | Avg Precipitation | Max Snow | Avg Snow | |
|---|---|---|---|---|---|---|---|---|---|---|---|---|---|
| Record | 82.04 °F | — | -0.94 °F | 74.30 °F | — | -3.28 °F | 71.06 °F | — | -11.02 °F | — | — | — | — |
| January | 53.06 °F | 34.04 °F | -0.94 °F | 47.66 °F | 29.67 °F | -3.28 °F | 44.06 °F | 24.36 °F | -5.08 °F | — | — | — | — |
| February | 50.00 °F | 36.93 °F | 8.06 °F | 53.96 °F | 32.06 °F | 0.68 °F | 42.08 °F | 26.56 °F | -11.02 °F | — | — | — | — |
| March | 75.02 °F | 35.69 °F | 8.06 °F | 74.30 °F | 30.22 °F | 4.46 °F | 71.06 °F | 24.17 °F | -7.96 °F | — | — | — | — |
| April | 68.00 °F | 42.91 °F | 23.00 °F | 53.78 °F | 36.97 °F | 20.30 °F | 44.06 °F | 30.48 °F | 5.00 °F | — | — | — | — |
| May | 75.92 °F | 50.60 °F | 28.94 °F | 63.32 °F | 43.89 °F | 27.14 °F | 51.08 °F | 36.62 °F | 21.92 °F | — | — | — | — |
| June | 80.96 °F | 55.36 °F | 44.96 °F | 64.76 °F | 49.33 °F | 41.54 °F | 55.94 °F | 43.13 °F | 26.06 °F | — | — | — | — |
| July | 78.08 °F | 58.74 °F | 48.02 °F | 64.04 °F | 53.07 °F | 45.68 °F | 57.02 °F | 47.49 °F | 33.08 °F | — | — | — | — |
| August | 82.04 °F | 59.98 °F | 50.00 °F | 66.20 °F | 53.85 °F | 43.52 °F | 57.92 °F | 47.37 °F | 26.06 °F | — | — | — | — |
| September | 69.98 °F | 54.94 °F | 39.92 °F | 58.64 °F | 49.19 °F | 35.78 °F | 55.94 °F | 42.78 °F | 23.00 °F | — | — | — | — |
| October | 64.04 °F | 45.99 °F | 24.98 °F | 54.68 °F | 40.60 °F | 19.58 °F | 51.98 °F | 34.44 °F | 3.92 °F | — | — | — | — |
| November | 55.04 °F | 38.15 °F | 8.96 °F | 50.72 °F | 33.74 °F | 3.74 °F | 48.02 °F | 28.28 °F | -0.04 °F | — | — | — | — |
| December | 75.92 °F | 33.86 °F | 6.08 °F | 67.82 °F | 29.86 °F | 3.02 °F | 44.96 °F | 24.63 °F | -5.08 °F | — | — | — | — |
Data Visualisations
Remove WatermarksCurrent Year Climate Trends vs Historical


Max Temperature this Year | 1 of 6
Climate 12-Month Moving Averages


Max Temperature 12-Month MA | 1 of 6
Daily Data Points and Averages Throughout the Year

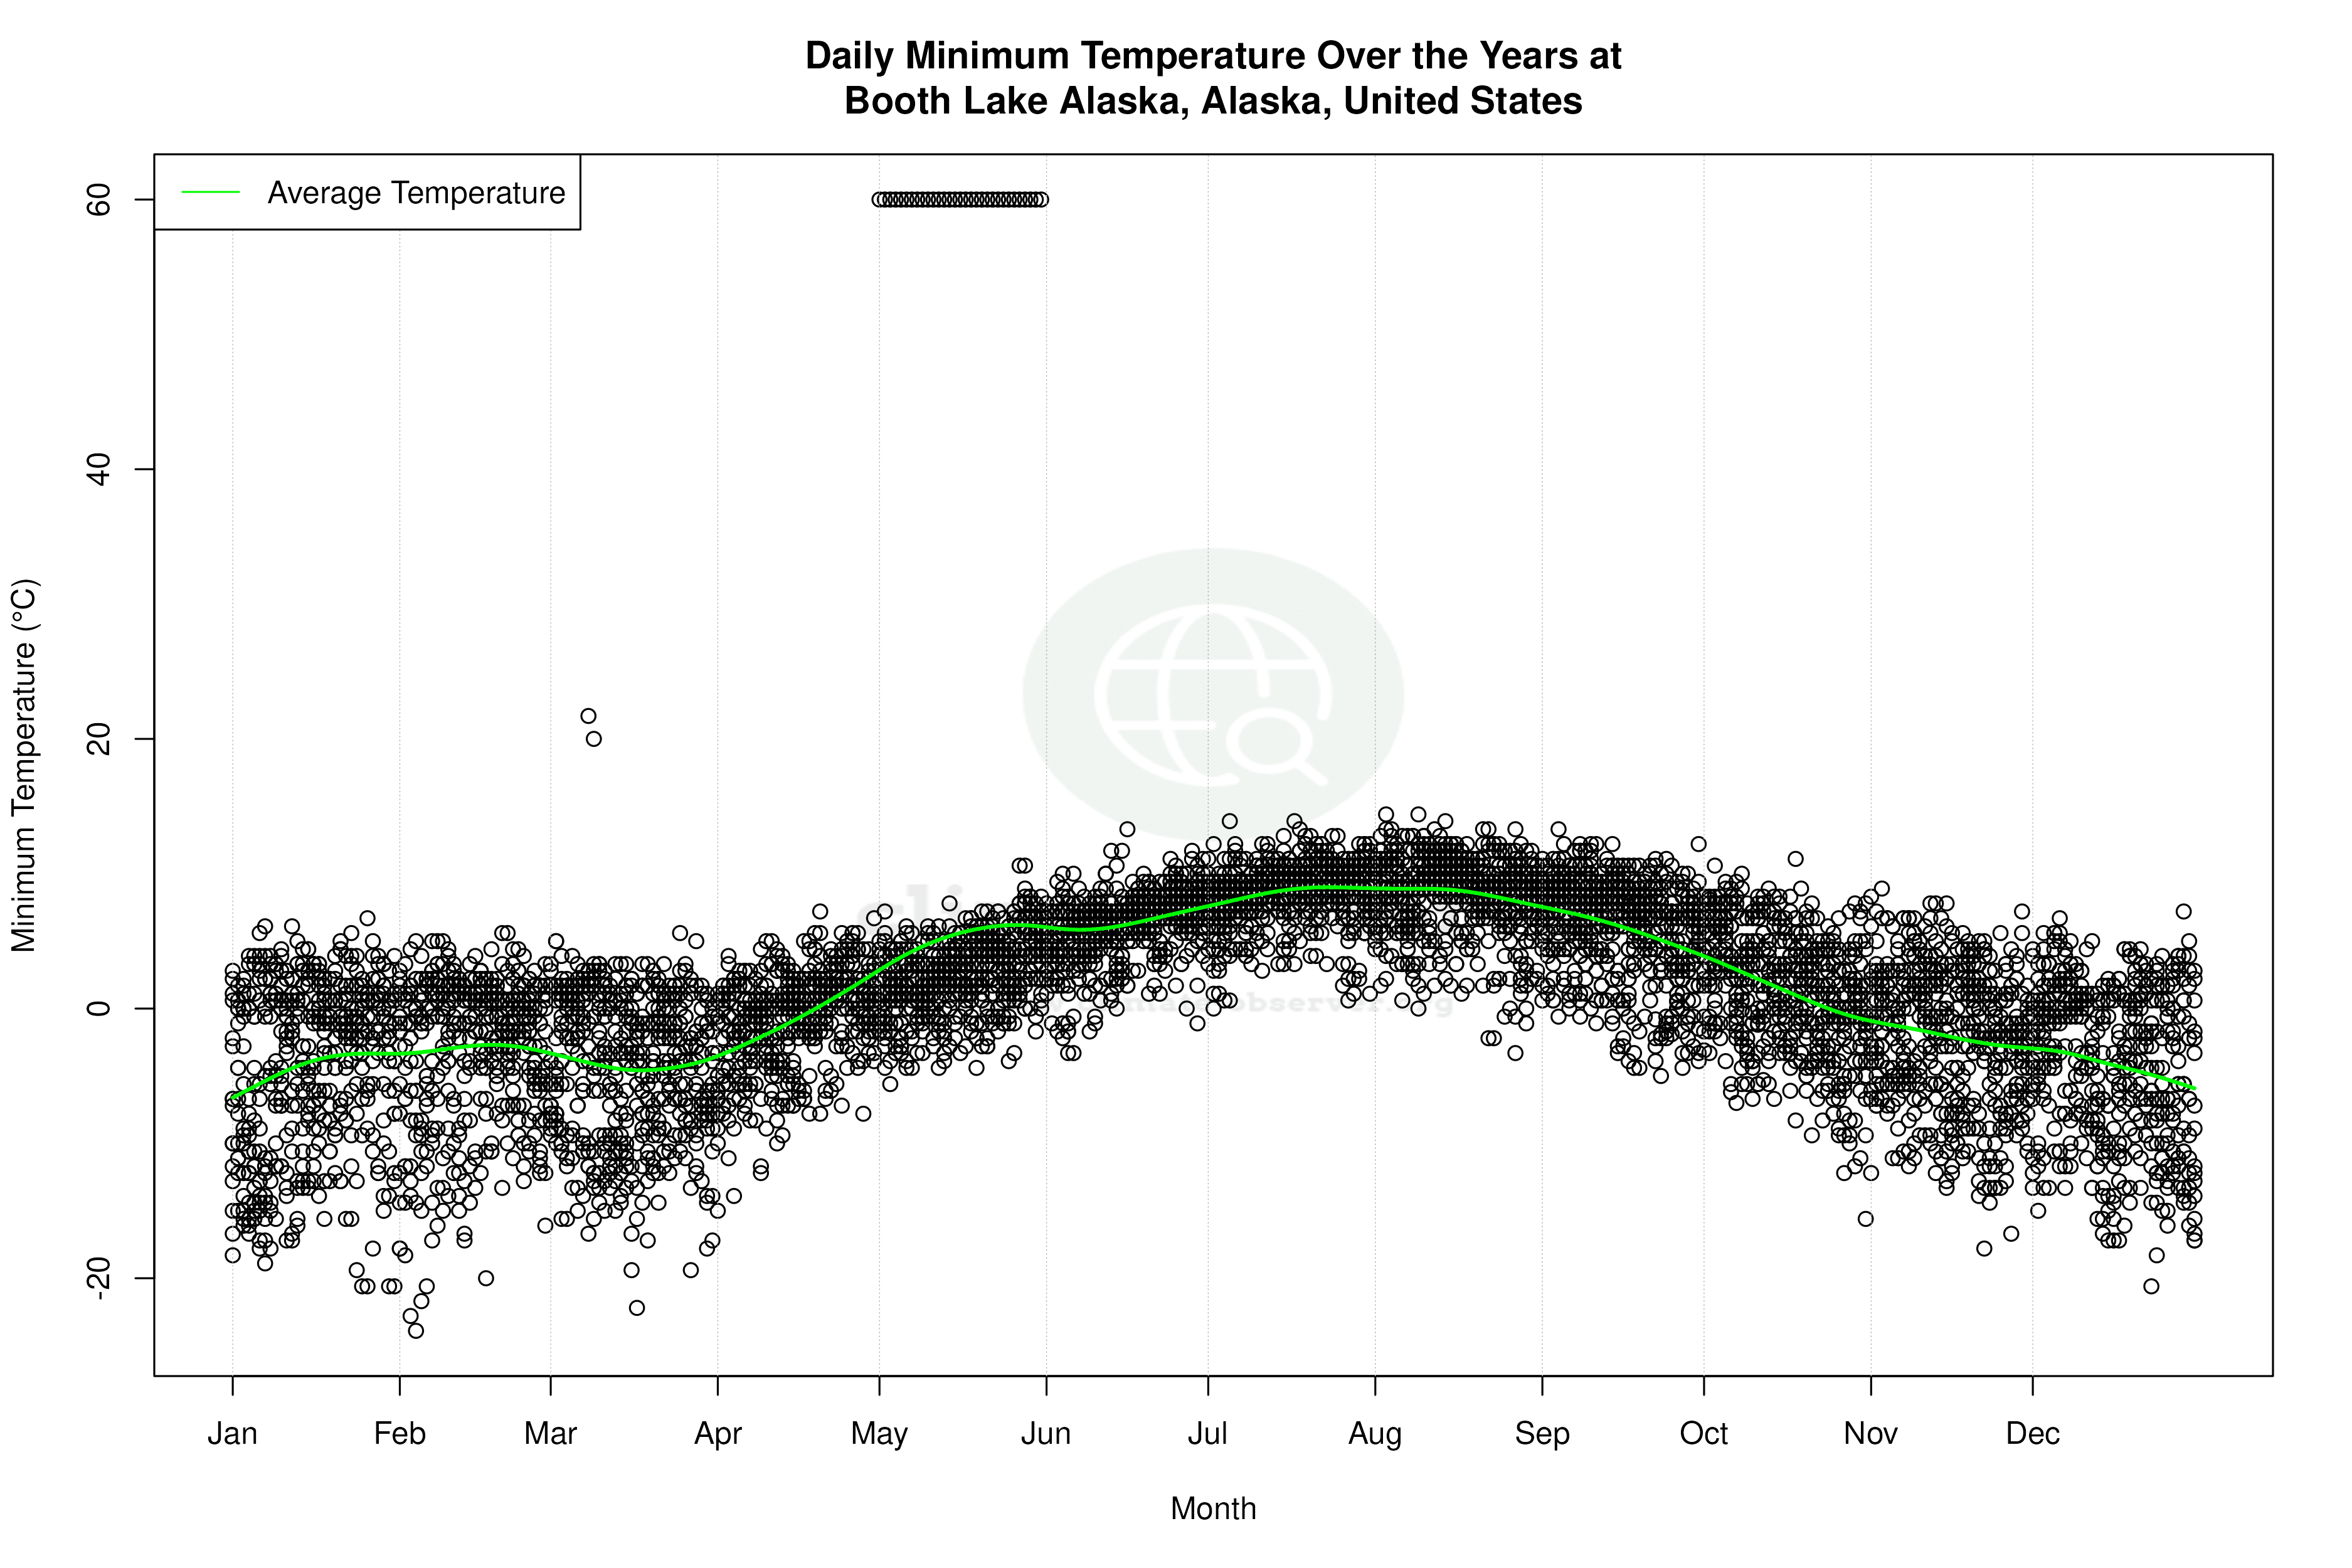


Average Max Temperature Throughout Year | 1 of 5
