Climate for Station: Miami Intl Ap, Florida, United States
Loading live weather...
Climate Analysis & Overview
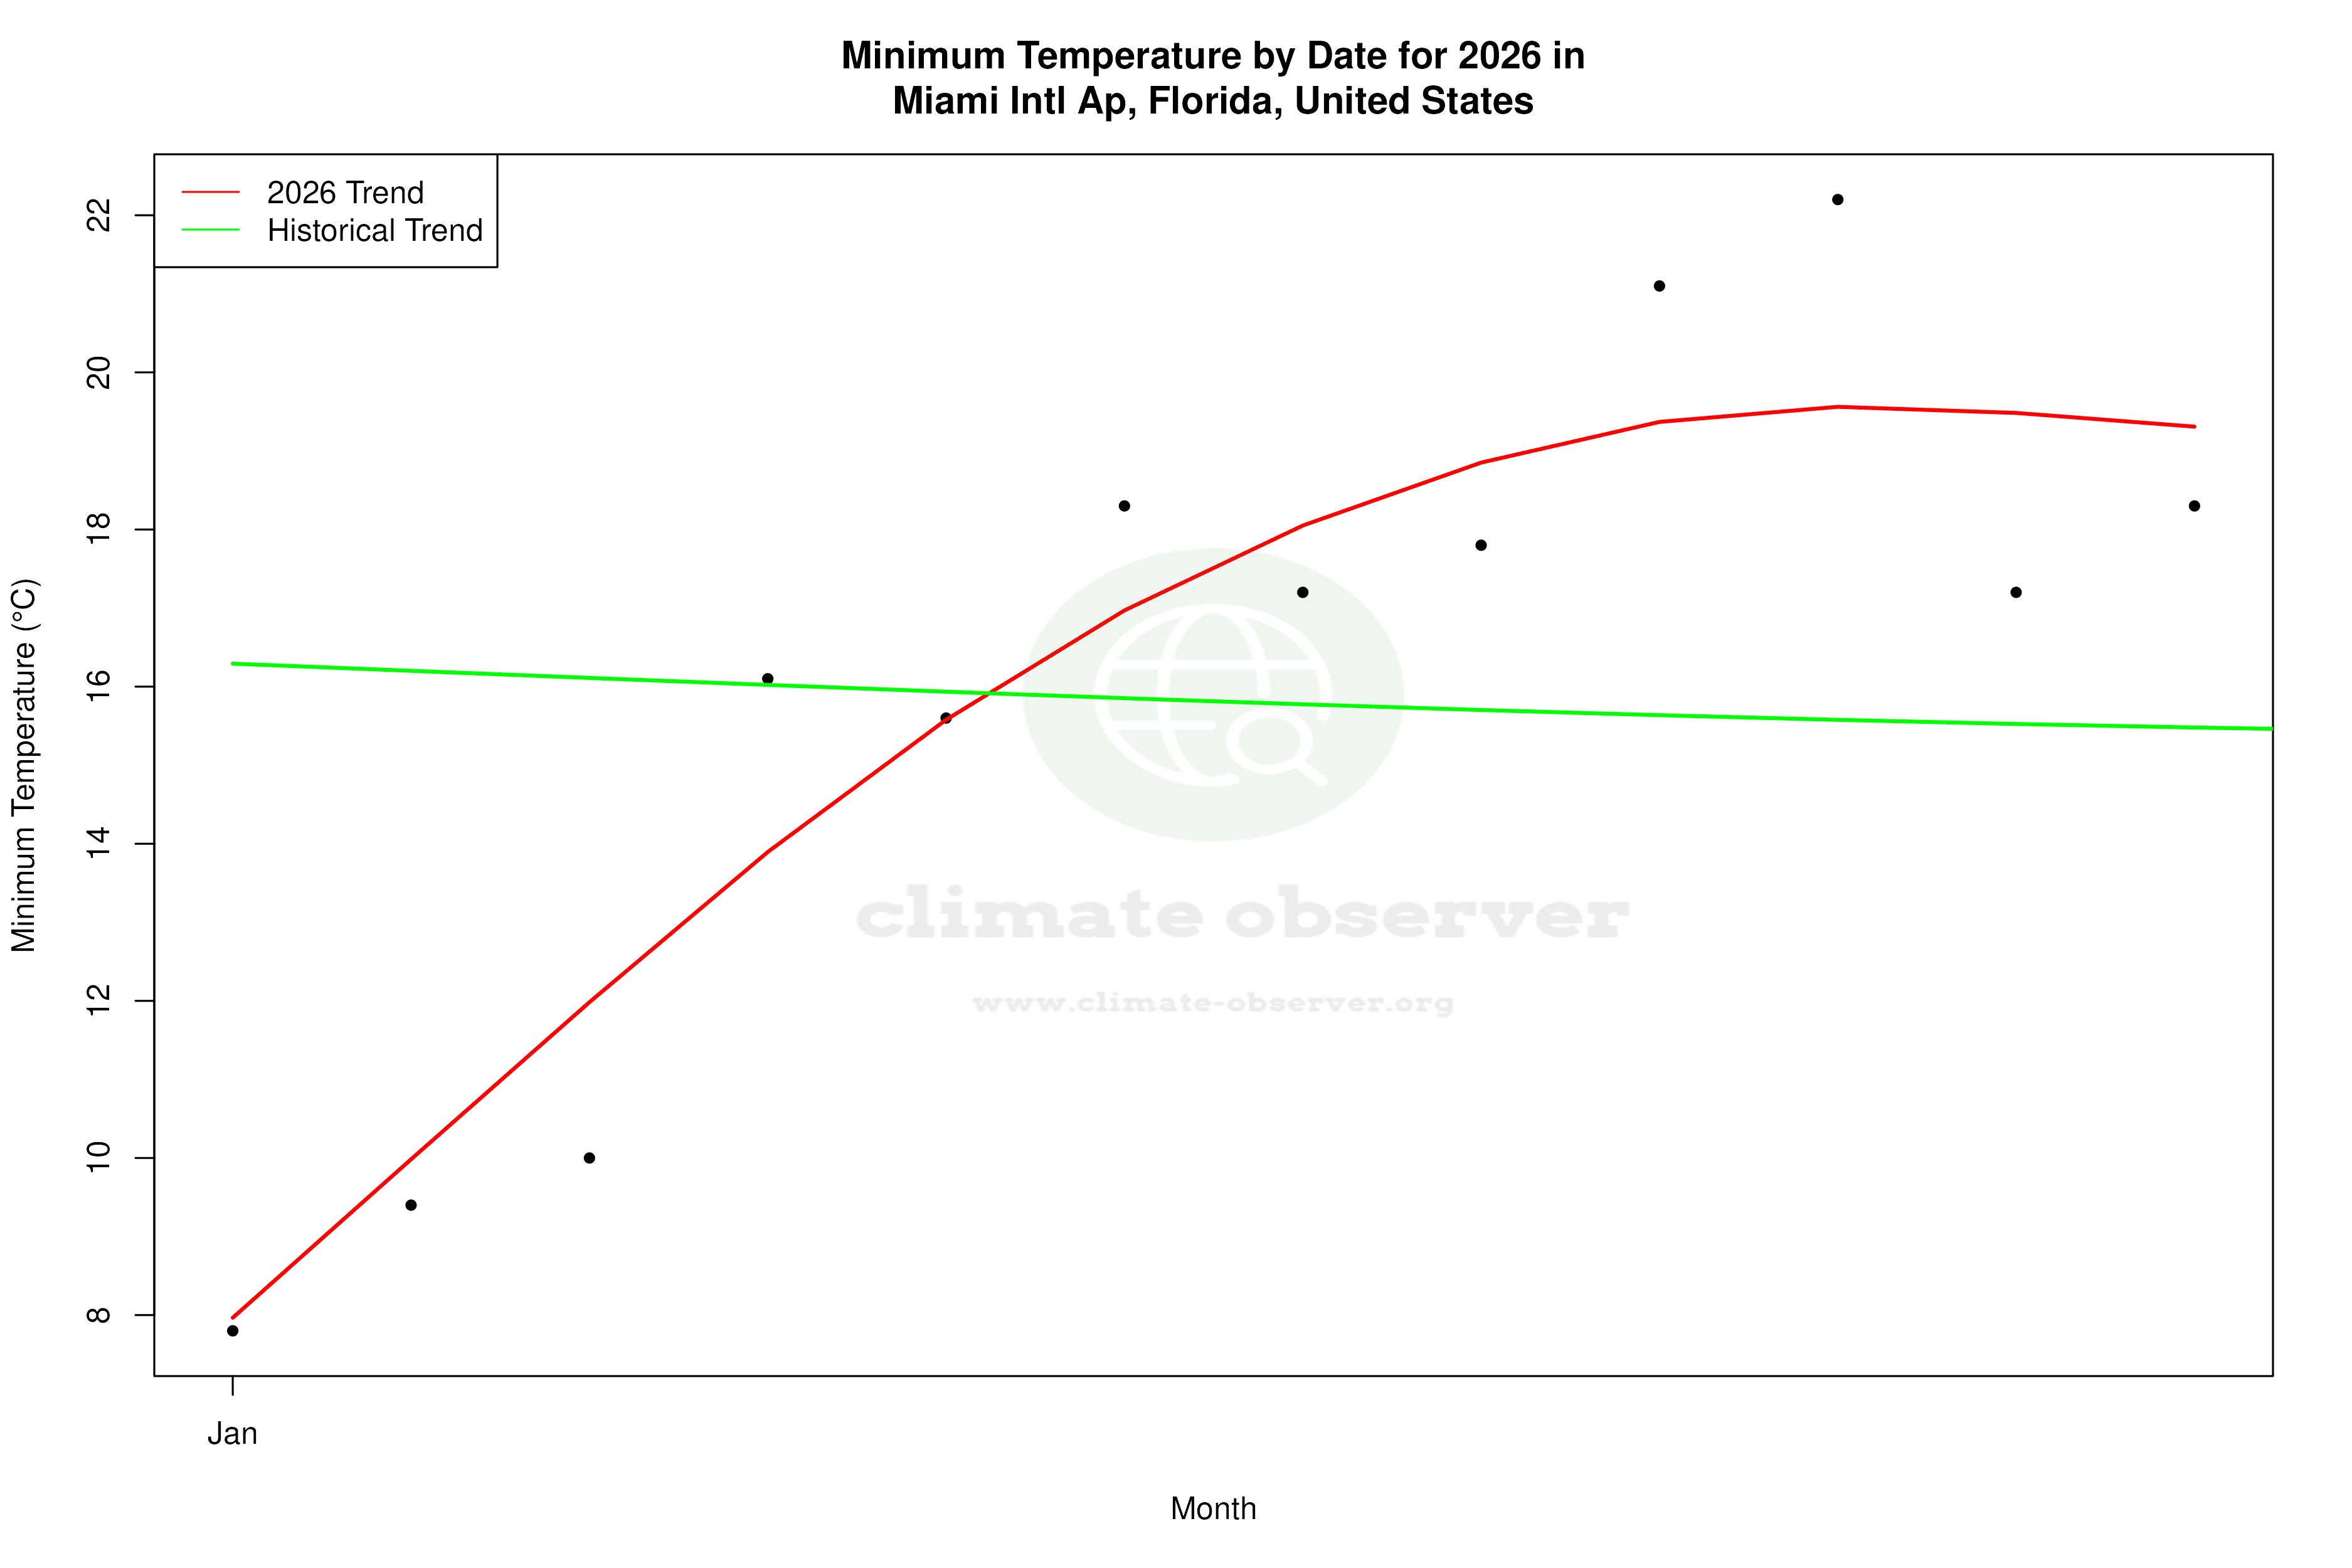
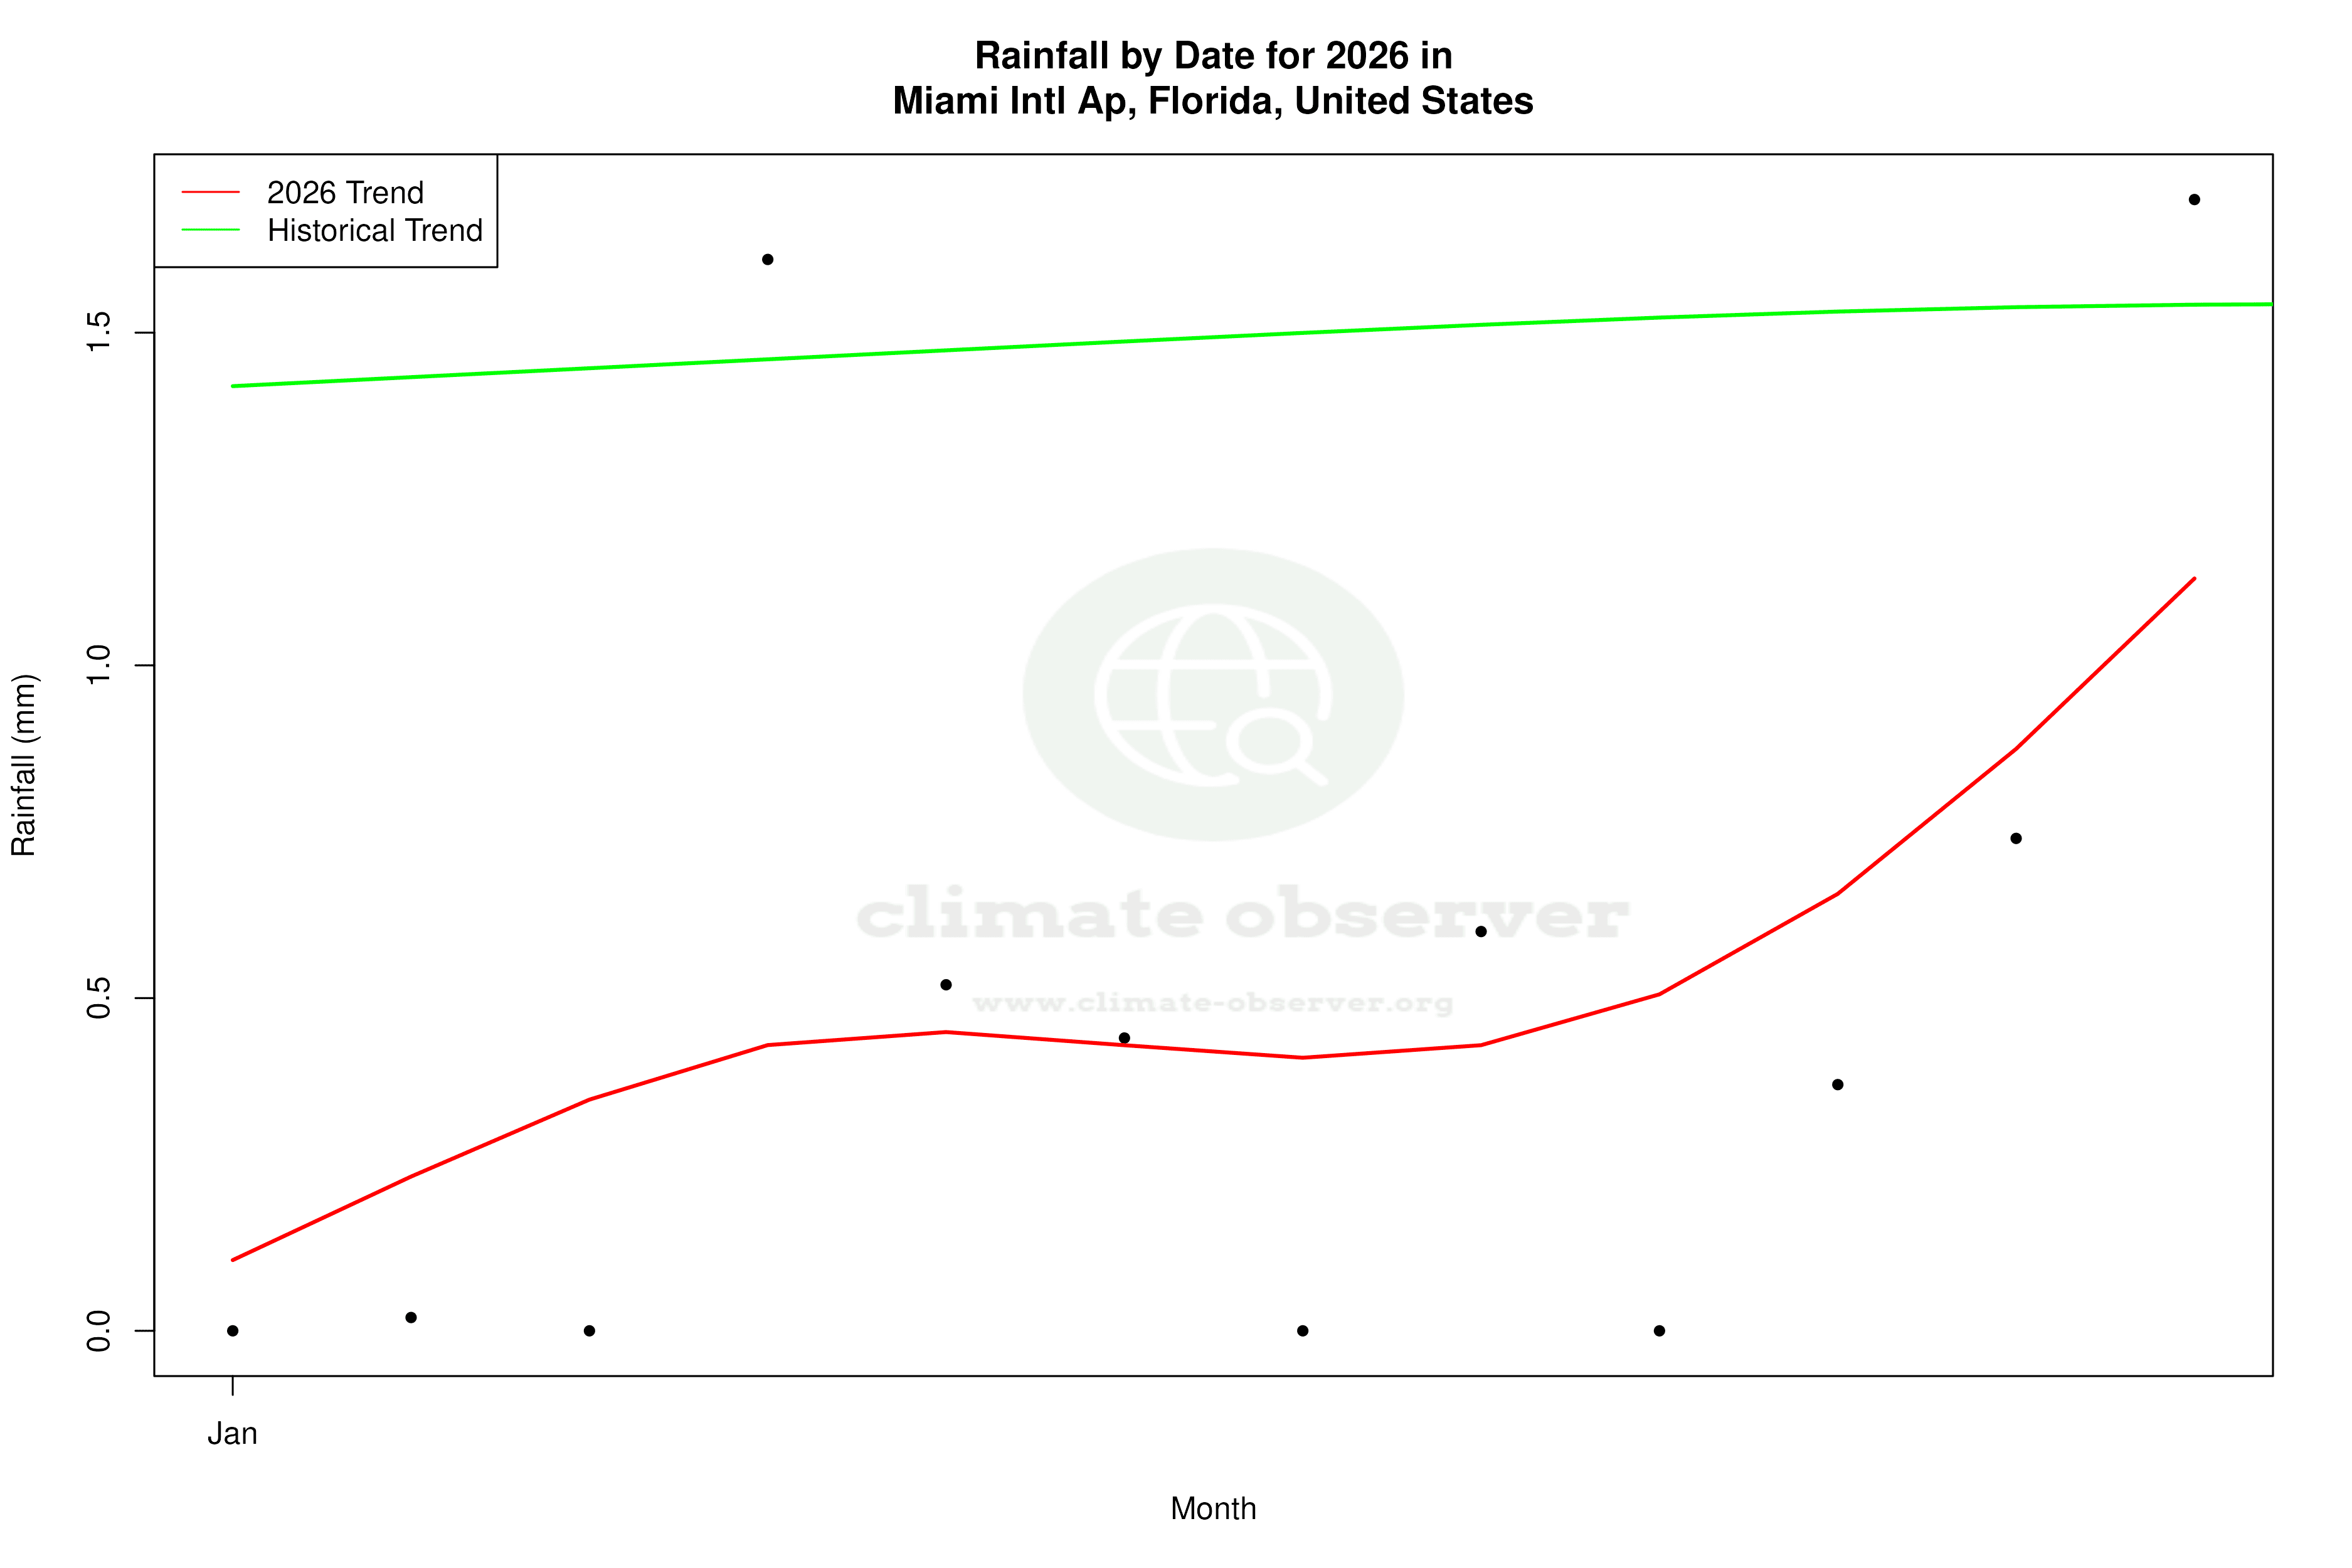
Miami International Airport is experiencing a subtle warming trend, with highs rising by 0.21°C (0.38°F) over the long term and lows by 0.31°C (0.56°F). The precipitation distribution has become slightly more even, reflecting a decrease in the Precipitation Concentration Index from 14.12 to 12.81.
Tropical Climate Dynamics
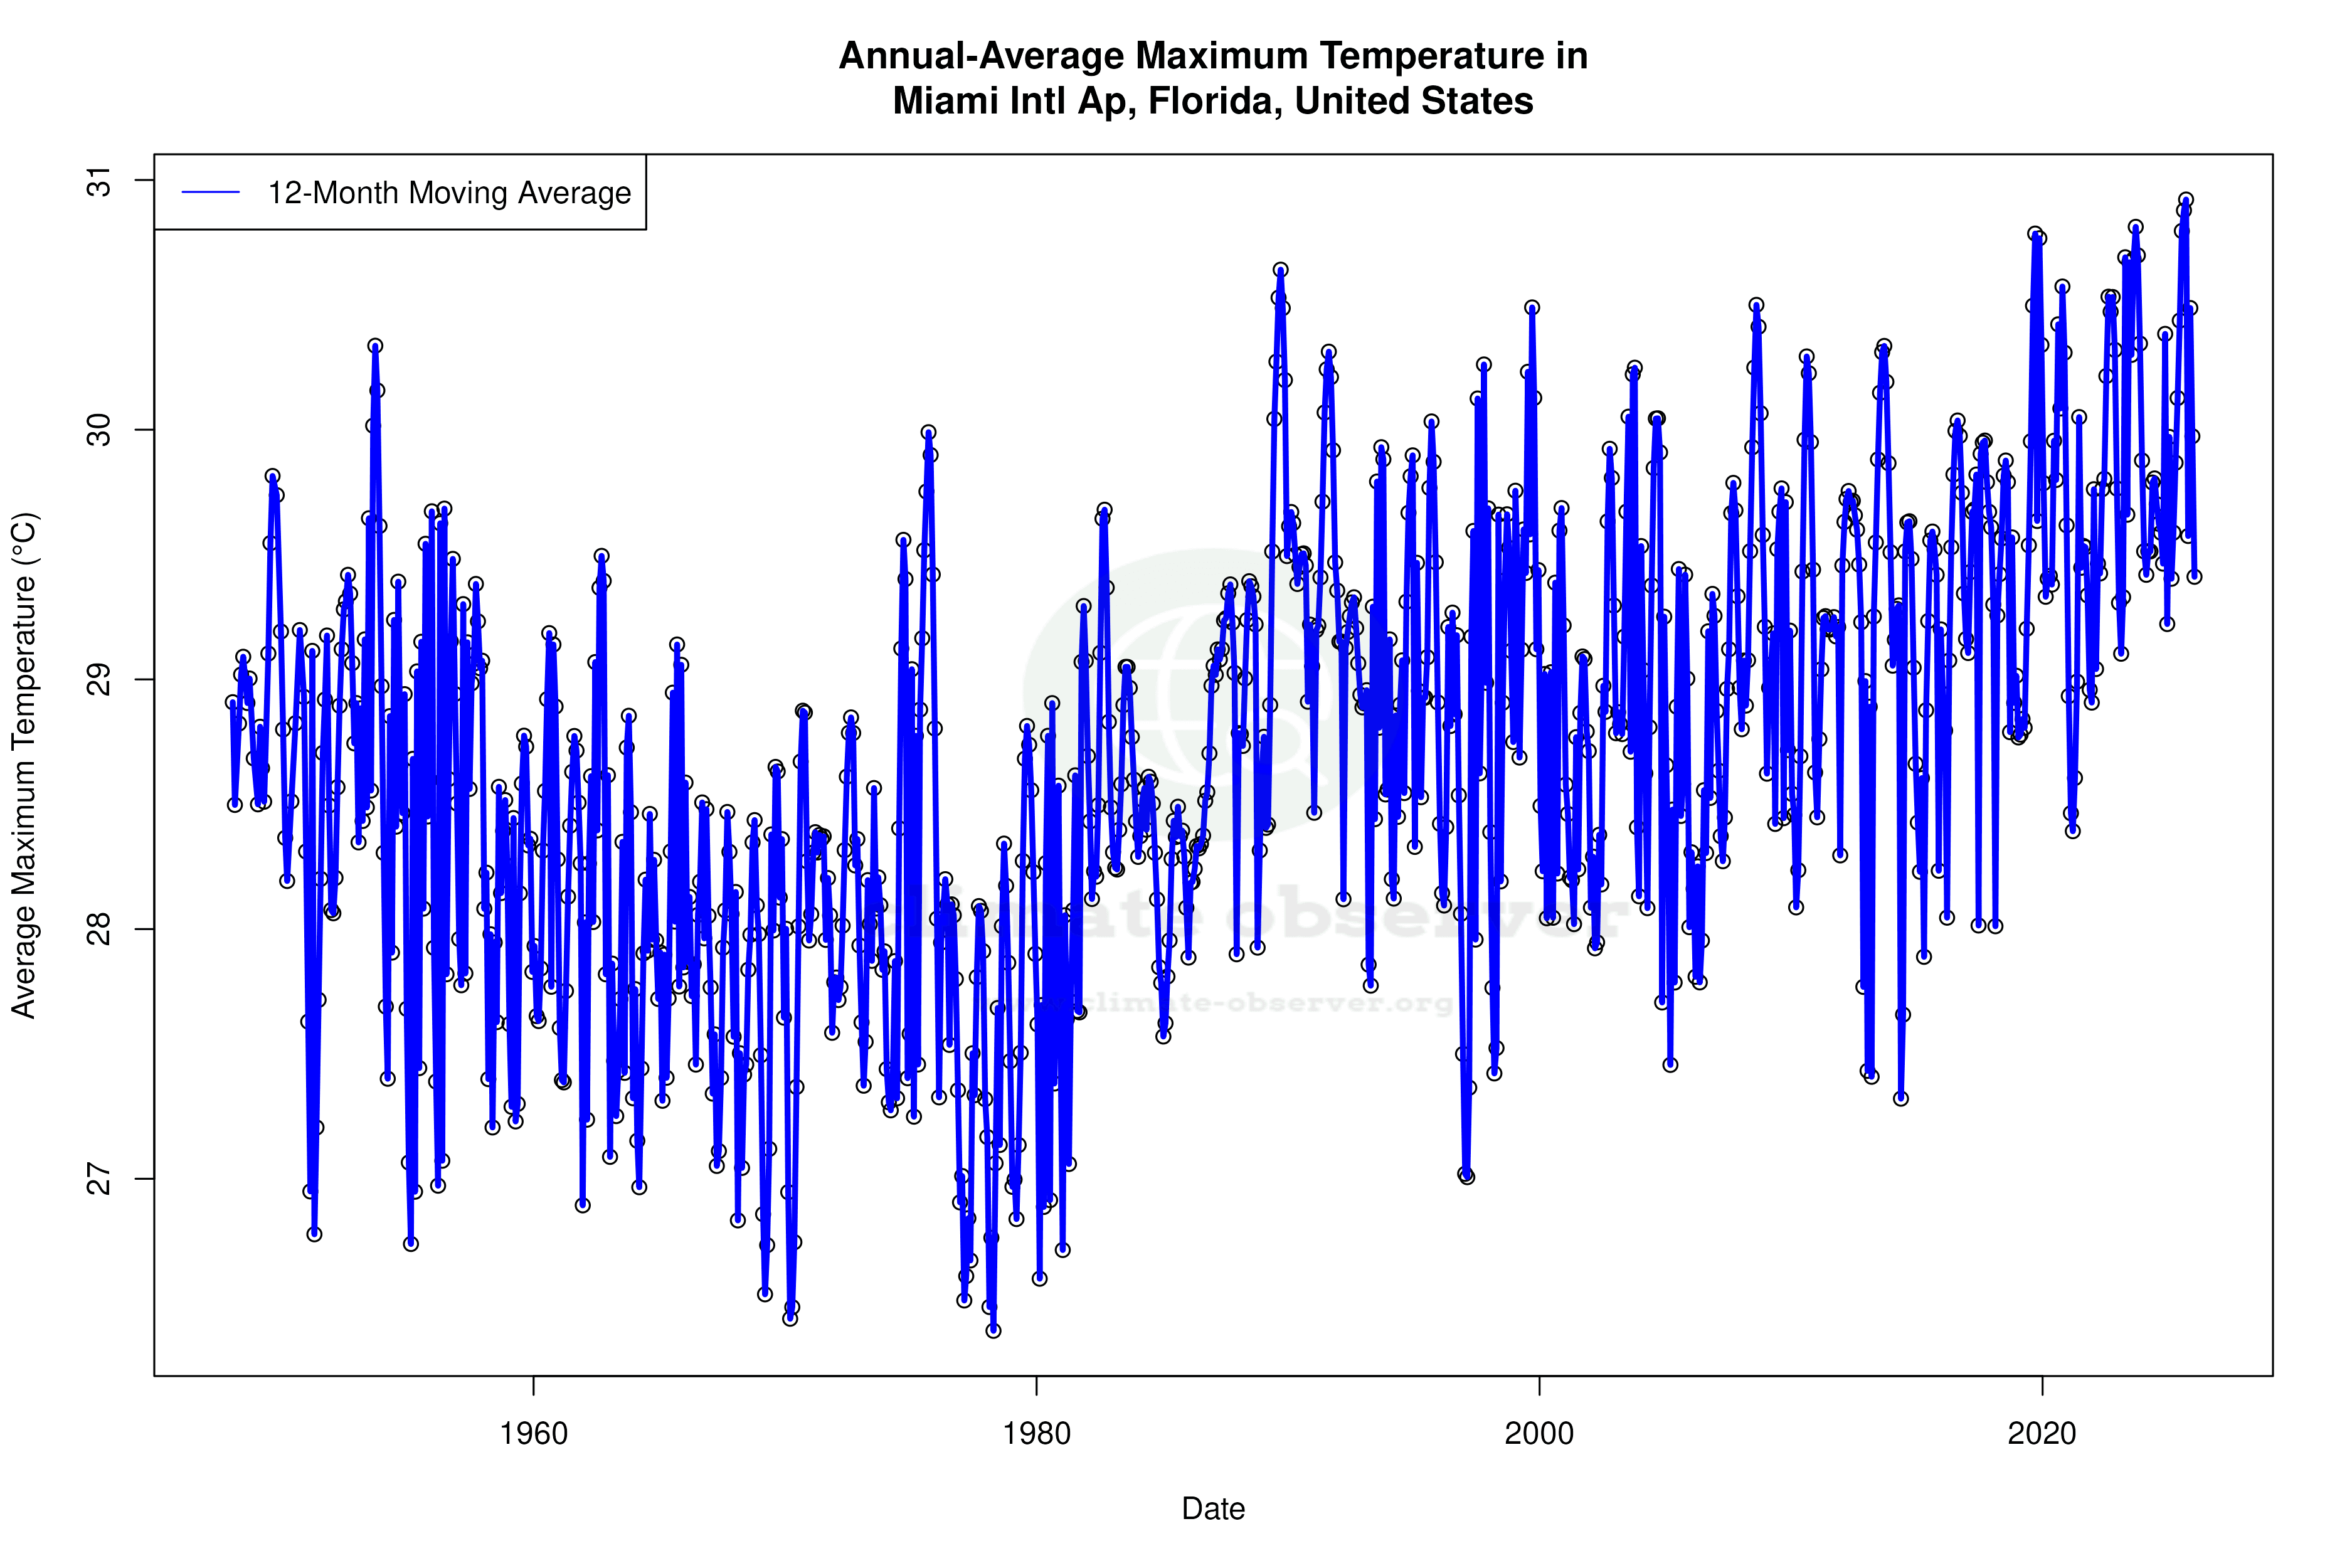
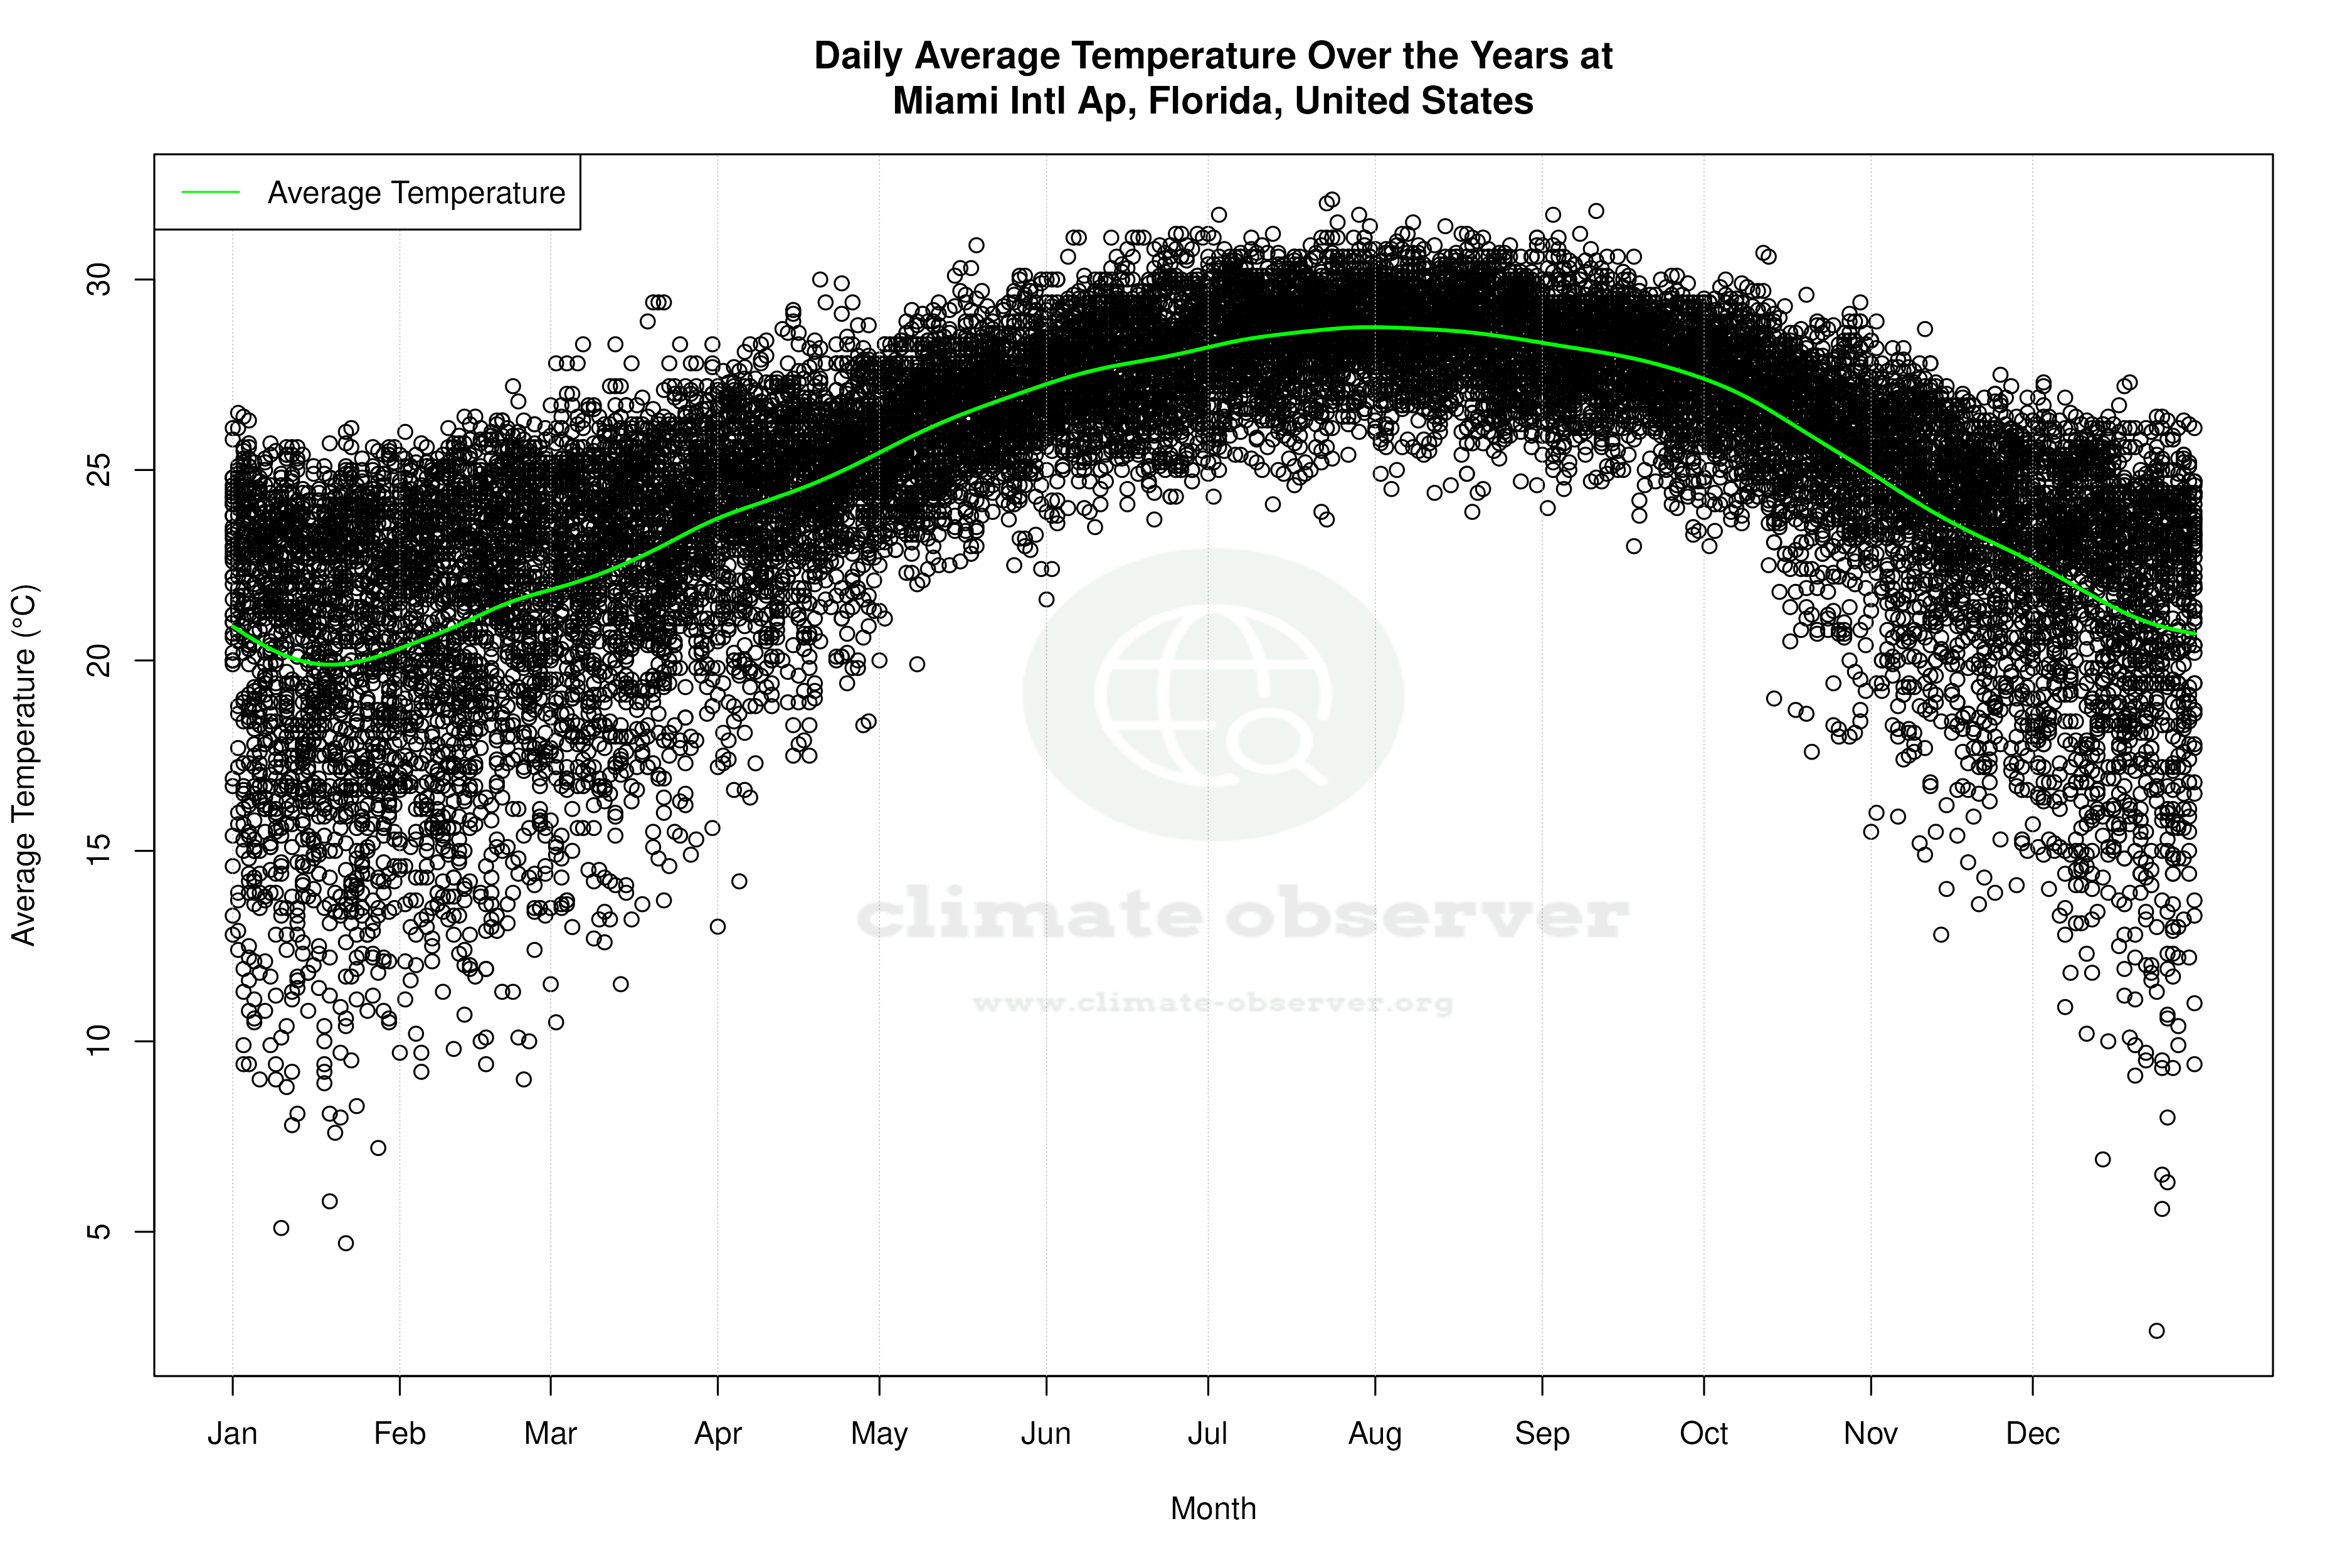
Miami International Airport, located at 25.7881°N, 80.3169°W, experiences a tropical monsoon climate, classified as 'Am' in the Köppen system. This classification is characterised by a pronounced wet season and a relatively dry winter. The city's proximity to the Atlantic Ocean and the Gulf Stream moderates temperature extremes, ensuring mild winters and hot, humid summers. The all-time temperature trends indicate a warming pattern, with highs increasing by 0.21°C (0.38°F) and lows by 0.31°C (0.56°F). This warming aligns with broader regional climate goals aimed at understanding and mitigating the impacts of climate change.
Temperature Trends: A Decade in Review
Over the past decade, Miami has seen a modest increase in high temperatures, with a rise of 0.20°C (0.36°F), while low temperatures have shown a negligible increase of 0.01°C (0.02°F). This recent trend suggests a stabilisation in nighttime temperatures, potentially influenced by urban heat island effects and increased vegetation in urban planning. The all-time trend, however, is more pronounced, indicating a consistent warming that is likely to influence future climate resilience strategies.
Precipitation Patterns: A Shift Towards Evenness
The Precipitation Concentration Index (PCI) at Miami International Airport has decreased from a baseline of 14.12 to a current value of 12.81. This shift suggests that rainfall is becoming more evenly distributed throughout the year, with fewer intense, isolated events. A PCI under 10 indicates very even distribution, while values over 20 suggest high concentration. The current PCI reflects a slight change towards more regular precipitation, which may benefit water management and agricultural planning in the region.
Extreme Weather Records
Miami's climate extremes are marked by a record high of 36.7°C (98.1°F) and a record low of -1.1°C (30.0°F). These records highlight the city's vulnerability to both heatwaves and rare cold snaps, which can strain infrastructure and ecosystems. Understanding these extremes is crucial for developing adaptive strategies to protect both human and environmental health.
Broader Implications and Future Outlook
The observed warming trends and changes in precipitation distribution at Miami International Airport are consistent with larger patterns observed across the southeastern United States. These changes are critical for informing local and regional climate adaptation measures, particularly as Miami continues to face challenges related to sea-level rise and extreme weather events. The city's climate profile underscores the importance of ongoing monitoring and research to support sustainable development and resilience in the face of climate change.
Station Statistics
10-Year Trend
High: -0.33 °F/decade
Low: -0.57 °F/decade
Rain: -0.004 in/decade
25-Year Trend
High: +0.74 °F/decade
Low: +0.95 °F/decade
Rain: +0.004 in/decade
50-Year Trend
High: +0.54 °F/decade
Low: +0.64 °F/decade
Rain: +0.009 in/decade
All-Time Trend
High: +0.35 °F/decade
Low: +0.51 °F/decade
Rain: +0.003 in/decade
Percentage Above-Average Days
Last 12 Months: 61.4%
This Year: 65.1%
Precipitation Concentration Index (PCI) ℹ️
Last 12 Months: 13.8
Historical Average: 14.0
Percentile Rank of Last 12 Months ℹ️
High: 72nd percentile
Low: 75th percentile
Rain: 44th percentile
Change in Variance ℹ️
High: -11.5%
Low: -22.3%
Intraday: -29.5%
Data Coverage
92.0%
First Year of Data
1948
Station Location
Historical Weather Records
| Max High | Avg High | Min High | Max Avg | Avg Avg | Min Avg | Max Low | Avg Low | Min Low | Max Precipitation | Avg Precipitation | Max Snow | Avg Snow | |
|---|---|---|---|---|---|---|---|---|---|---|---|---|---|
| Record | 98.06 °F | — | 44.74 °F | 89.78 °F | — | 36.32 °F | 84.02 °F | — | 30.02 °F | 11.51 in | — | 0.00 in | — |
| January | 87.98 °F | 75.96 °F | 47.10 °F | 79.70 °F | 68.19 °F | 40.46 °F | 77.00 °F | 60.03 °F | 30.02 °F | 2.40 in | 0.06 in | 0.00 in | 0.00 in |
| February | 89.06 °F | 77.57 °F | 51.98 °F | 80.96 °F | 70.03 °F | 43.34 °F | 77.00 °F | 61.80 °F | 35.06 °F | 4.54 in | 0.07 in | 0.00 in | 0.00 in |
| March | 93.02 °F | 80.20 °F | 53.06 °F | 84.92 °F | 72.83 °F | 50.90 °F | 80.06 °F | 64.91 °F | 32.00 °F | 7.07 in | 0.07 in | 0.00 in | 0.00 in |
| April | 96.98 °F | 83.16 °F | 66.02 °F | 86.00 °F | 76.00 °F | 55.42 °F | 80.06 °F | 68.71 °F | 42.08 °F | 4.85 in | 0.10 in | 0.00 in | 0.00 in |
| May | 98.06 °F | 86.28 °F | 73.04 °F | 87.62 °F | 79.53 °F | 67.82 °F | 82.94 °F | 72.58 °F | 55.04 °F | 11.51 in | 0.19 in | 0.00 in | 0.00 in |
| June | 98.06 °F | 88.59 °F | 75.92 °F | 88.16 °F | 81.96 °F | 70.88 °F | 84.02 °F | 75.41 °F | 60.08 °F | 6.60 in | 0.32 in | 0.00 in | 0.00 in |
| July | 98.06 °F | 89.93 °F | 78.08 °F | 89.78 °F | 83.46 °F | 74.66 °F | 84.02 °F | 76.82 °F | 69.08 °F | 5.49 in | 0.21 in | 0.00 in | 0.00 in |
| August | 98.06 °F | 90.18 °F | 80.06 °F | 88.70 °F | 83.48 °F | 75.02 °F | 84.02 °F | 77.06 °F | 68.00 °F | 6.41 in | 0.27 in | 0.00 in | 0.00 in |
| September | 96.98 °F | 88.73 °F | 75.02 °F | 89.24 °F | 82.28 °F | 73.40 °F | 84.02 °F | 76.18 °F | 68.00 °F | 6.07 in | 0.31 in | 0.00 in | 0.00 in |
| October | 95.00 °F | 85.38 °F | 69.98 °F | 87.26 °F | 79.33 °F | 58.93 °F | 84.02 °F | 72.91 °F | 51.13 °F | 9.95 in | 0.22 in | 0.00 in | 0.00 in |
| November | 91.04 °F | 80.93 °F | 62.06 °F | 84.02 °F | 74.68 °F | 55.04 °F | 80.96 °F | 67.17 °F | 39.02 °F | 6.78 in | 0.09 in | 0.00 in | 0.00 in |
| December | 89.06 °F | 77.48 °F | 44.74 °F | 81.14 °F | 70.67 °F | 36.32 °F | 78.98 °F | 62.66 °F | 30.02 °F | 4.38 in | 0.06 in | 0.00 in | 0.00 in |
Data Visualisations
Remove WatermarksCurrent Year Climate Trends vs Historical


Max Temperature this Year | 1 of 6
Climate 12-Month Moving Averages


Max Temperature 12-Month MA | 1 of 6
Daily Data Points and Averages Throughout the Year


Average Max Temperature Throughout Year | 1 of 5
