Climate for Station: Tampa Intl Ap, Florida, United States
Loading live weather...
Climate Analysis & Overview
Tampa International Airport's climate profile reveals a warming trend in high temperatures over the long term, contrasting with a cooling trend in recent lows. The precipitation pattern has become slightly more concentrated, indicating a shift in rainfall distribution.
Subtropical Climate Dynamics
Tampa International Airport, located at 27.96°N, -82.54°W, is situated in a humid subtropical climate zone, characterised by hot, humid summers and mild winters. The proximity to the Gulf of Mexico influences the area's weather patterns, contributing to the warmth and humidity typical of this region. This maritime influence also moderates temperature extremes, although the station has recorded an all-time high of 37.8°C (100.0°F) and a low of -7.8°C (18.0°F).
Temperature Trends: A Mixed Picture
Over the past decade, Tampa has experienced a slight warming in high temperatures, with an increase of 0.03°C (0.06°F). However, there is a notable cooling trend in low temperatures, with a decrease of 0.14°C (0.25°F). When considering the all-time trends, high temperatures have risen by 0.13°C (0.23°F), while low temperatures have increased by 0.30°C (0.54°F). This discrepancy between short-term and long-term trends suggests a complex interplay of factors influencing temperature variations.
Precipitation Patterns: A Shift Towards Concentration
The Precipitation Concentration Index (PCI) for Tampa has shown a marginal increase from a baseline of 13.62 to a current value of 14.39. This indicates a slight shift towards more concentrated rainfall events, where precipitation is increasingly falling in fewer, more intense episodes. While this change is not drastic, it suggests a trend towards less evenly distributed rainfall, which could have implications for water management and flood risk in the region.
Regional Climate Goals and Implications
As part of the broader United States climate goals, which aim to mitigate climate change impacts and promote sustainable practices, understanding local climate dynamics is crucial. The warming trend in high temperatures aligns with global patterns of rising temperatures, potentially influencing local ecosystems and human activities. The slight increase in precipitation concentration may also necessitate adjustments in infrastructure to handle more intense rainfall events.
Interpreting the Data: A Complex Climate Narrative
The climate data from Tampa International Airport presents a nuanced story of both warming and cooling trends, depending on the timeframe and temperature metric considered. The increase in high temperatures over the long term is consistent with global warming trends, while the cooling in recent low temperatures adds complexity to the narrative. The slight increase in the PCI further underscores the evolving nature of Tampa's climate, with implications for local weather patterns and regional climate strategies.
Station Statistics
10-Year Trend
High: +0.05 °F/decade
Low: -0.19 °F/decade
Rain: +0.013 in/decade
25-Year Trend
High: +1.31 °F/decade
Low: +1.66 °F/decade
Rain: +0.009 in/decade
50-Year Trend
High: +0.55 °F/decade
Low: +1.16 °F/decade
Rain: +0.006 in/decade
All-Time Trend
High: +0.23 °F/decade
Low: +0.53 °F/decade
Rain: +0.000 in/decade
Percentage Above-Average Days
Last 12 Months: 65.5%
This Year: 76.1%
Precipitation Concentration Index (PCI) ℹ️
Last 12 Months: 14.6
Historical Average: 14.5
Percentile Rank of Last 12 Months ℹ️
High: 93rd percentile
Low: 91st percentile
Rain: 42nd percentile
Change in Variance ℹ️
High: -12.8%
Low: -14.5%
Intraday: -28.6%
Data Coverage
98.7%
First Year of Data
1940
Station Location
Historical Weather Records
| Max High | Avg High | Min High | Max Avg | Avg Avg | Min Avg | Max Low | Avg Low | Min Low | Max Precipitation | Avg Precipitation | Max Snow | Avg Snow | |
|---|---|---|---|---|---|---|---|---|---|---|---|---|---|
| Record | 100.04 °F | — | 37.94 °F | 89.78 °F | — | 29.30 °F | 84.92 °F | — | 17.96 °F | 11.45 in | — | 0.20 in | — |
| January | 86.00 °F | 70.37 °F | 39.02 °F | 78.08 °F | 60.47 °F | 30.92 °F | 71.96 °F | 50.94 °F | 21.02 °F | 3.29 in | 0.07 in | 0.20 in | 0.00 in |
| February | 89.06 °F | 72.56 °F | 46.04 °F | 78.98 °F | 62.83 °F | 37.40 °F | 73.04 °F | 53.26 °F | 24.08 °F | 3.14 in | 0.09 in | 0.00 in | 0.00 in |
| March | 91.04 °F | 76.91 °F | 50.00 °F | 80.06 °F | 67.29 °F | 39.56 °F | 75.92 °F | 57.83 °F | 28.94 °F | 4.33 in | 0.10 in | 0.00 in | 0.00 in |
| April | 96.08 °F | 82.10 °F | 57.02 °F | 84.02 °F | 72.39 °F | 50.72 °F | 78.98 °F | 62.81 °F | 39.92 °F | 3.33 in | 0.07 in | 0.00 in | 0.00 in |
| May | 98.06 °F | 87.50 °F | 68.00 °F | 86.54 °F | 77.91 °F | 60.98 °F | 80.96 °F | 68.76 °F | 48.92 °F | 11.45 in | 0.09 in | 0.00 in | 0.00 in |
| June | 98.96 °F | 89.90 °F | 75.02 °F | 89.06 °F | 81.29 °F | 69.98 °F | 82.94 °F | 73.76 °F | 58.55 °F | 9.88 in | 0.23 in | 0.00 in | 0.00 in |
| July | 100.04 °F | 90.41 °F | 80.06 °F | 89.78 °F | 82.14 °F | 73.22 °F | 84.92 °F | 75.20 °F | 62.96 °F | 9.07 in | 0.24 in | 0.00 in | 0.00 in |
| August | 98.06 °F | 90.54 °F | 75.92 °F | 89.78 °F | 82.12 °F | 73.94 °F | 84.92 °F | 75.31 °F | 66.92 °F | 4.92 in | 0.27 in | 0.00 in | 0.00 in |
| September | 96.08 °F | 89.26 °F | 75.02 °F | 87.62 °F | 80.67 °F | 67.55 °F | 84.02 °F | 73.76 °F | 59.00 °F | 4.67 in | 0.21 in | 0.00 in | 0.00 in |
| October | 95.00 °F | 84.48 °F | 62.06 °F | 85.46 °F | 75.26 °F | 53.42 °F | 80.96 °F | 66.96 °F | 39.92 °F | 5.26 in | 0.07 in | 0.00 in | 0.00 in |
| November | 91.94 °F | 77.84 °F | 50.00 °F | 82.58 °F | 68.11 °F | 40.82 °F | 78.08 °F | 58.75 °F | 23.00 °F | 3.81 in | 0.05 in | 0.00 in | 0.00 in |
| December | 86.00 °F | 72.67 °F | 37.94 °F | 78.08 °F | 62.74 °F | 29.30 °F | 73.94 °F | 53.56 °F | 17.96 °F | 3.63 in | 0.07 in | 0.00 in | 0.00 in |
Data Visualisations
Remove WatermarksCurrent Year Climate Trends vs Historical


Max Temperature this Year | 1 of 6
Climate 12-Month Moving Averages


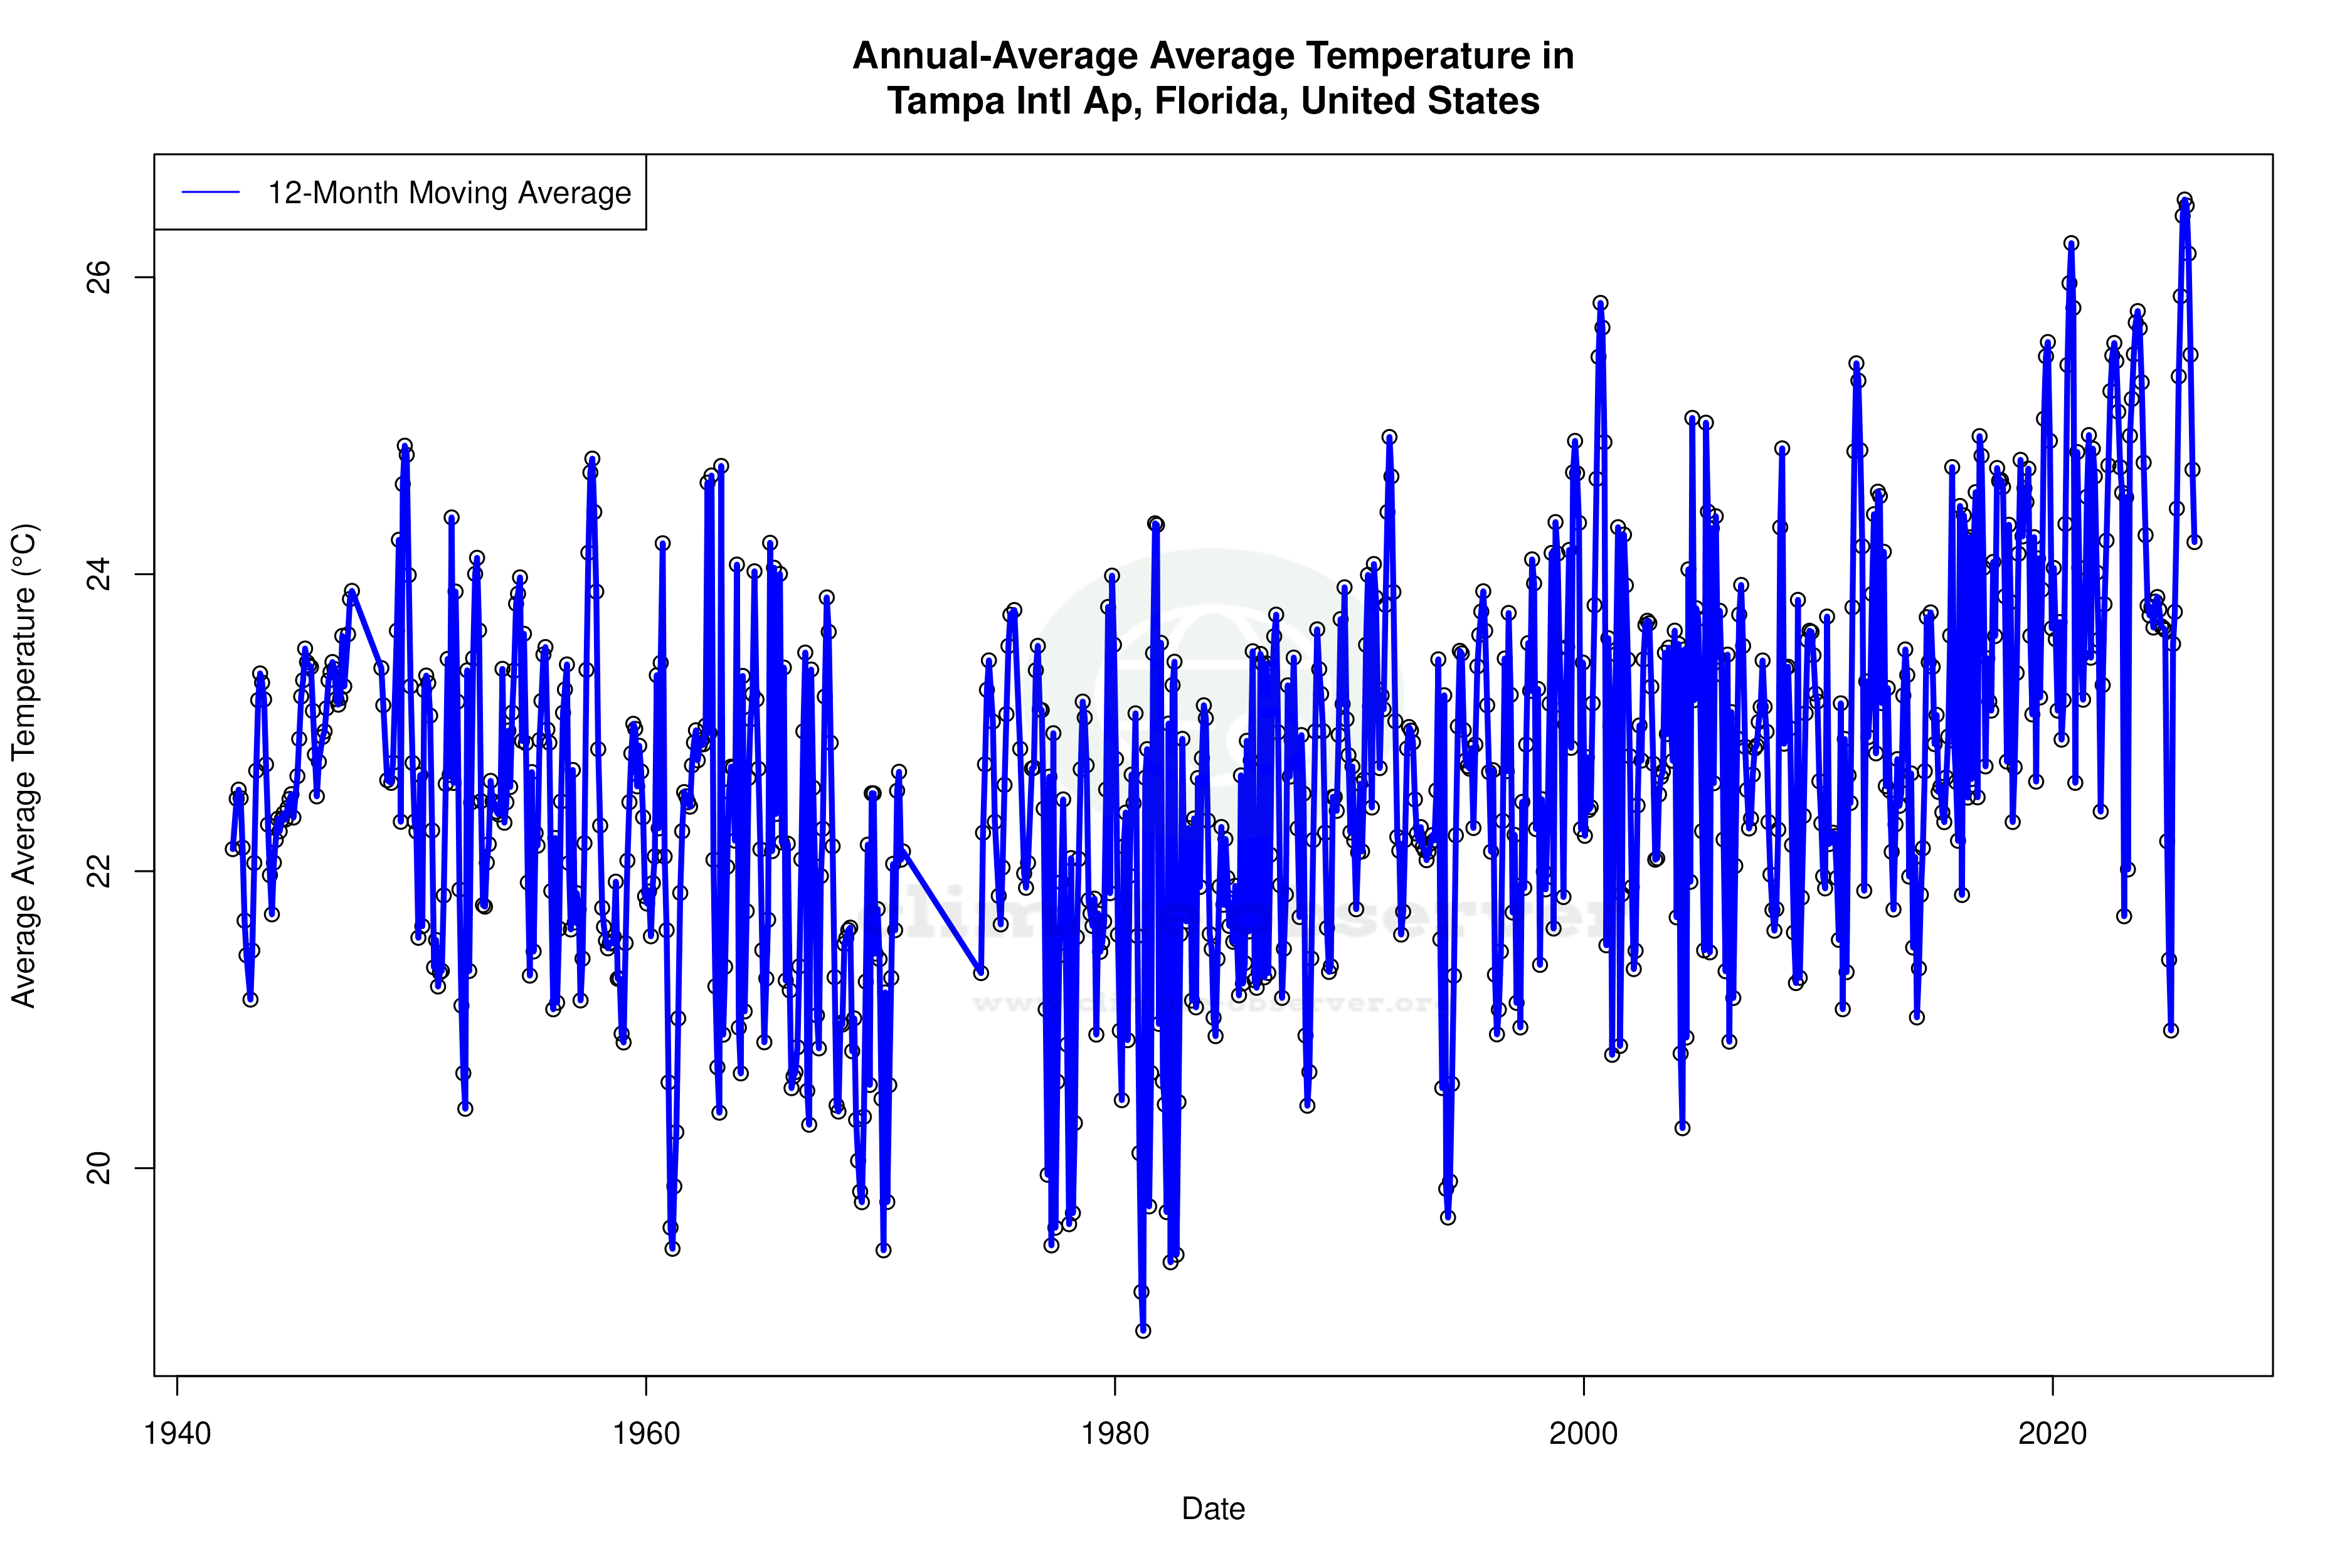


Max Temperature 12-Month MA | 1 of 6
Daily Data Points and Averages Throughout the Year


Average Max Temperature Throughout Year | 1 of 5
