Climate for Station: New Orleans Audubon, Louisiana, United States
Loading live weather...
Climate Analysis & Overview
New Orleans Audubon, located in the heart of a humid subtropical climate, exhibits intriguing thermal trends. Over the past decade, both high and low temperatures have shown a cooling trend, contrasting with the long-term warming trend. Precipitation has become slightly more evenly distributed, indicating a subtle shift in rainfall patterns.
Subtropical Climate Dynamics
Situated at coordinates 29.92°N, -90.13°W, New Orleans Audubon experiences a humid subtropical climate, characterised by hot, humid summers and mild winters. The proximity to the Gulf of Mexico significantly influences local weather patterns, contributing to high humidity and frequent rainfall. This location's unique geography, with its low elevation and coastal proximity, makes it particularly susceptible to both tropical storms and the broader impacts of climate change.
Thermal Trends: A Complex Picture
The past decade has seen a cooling trend in both high and low temperatures, with highs decreasing by 0.29°C (0.52°F) and lows by 0.18°C (0.32°F). This short-term cooling contrasts with the all-time trend, where high temperatures have shown a slight warming of 0.02°C (0.04°F), while low temperatures have risen by 0.21°C (0.38°F). This divergence highlights the complexity of climate patterns in New Orleans, where short-term fluctuations can differ from long-term trends.
Precipitation Patterns: A Subtle Shift
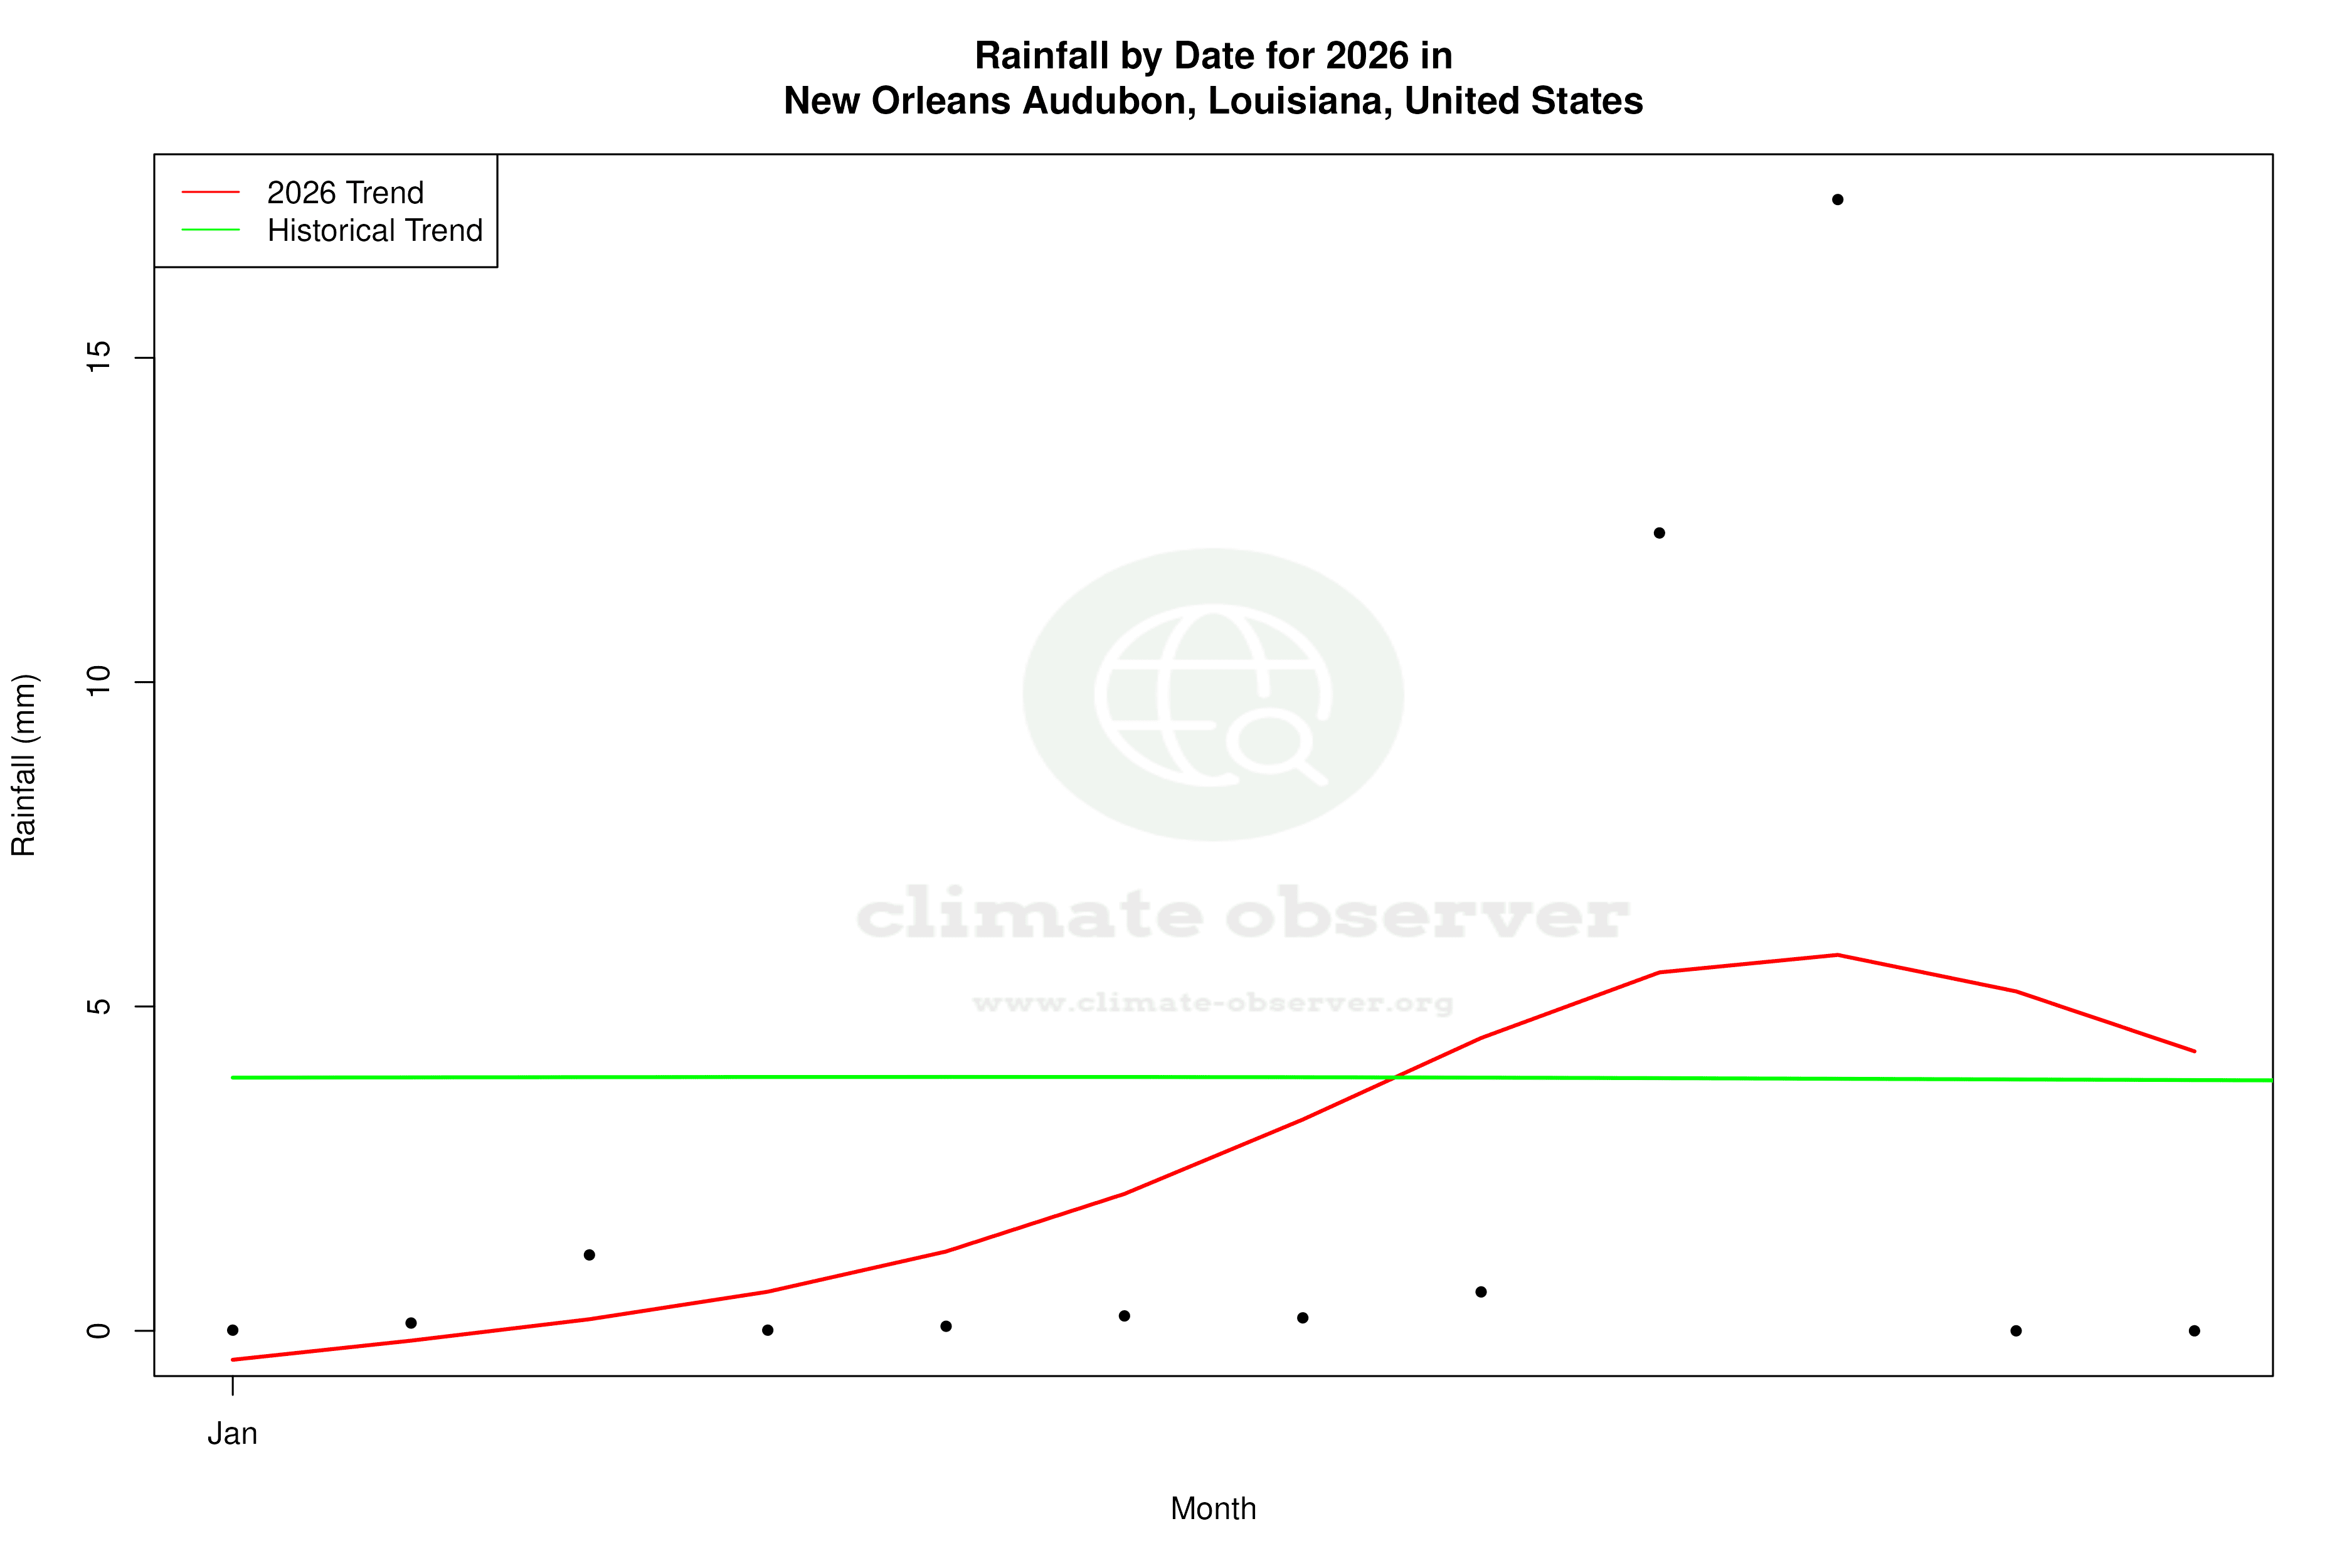
The Precipitation Concentration Index (PCI) for New Orleans Audubon has decreased from a baseline of 12.10 to 10.91, indicating a marginal shift towards more evenly distributed rainfall events. The PCI measures how rainfall is spread over time, with lower values suggesting less concentration in intense events. This subtle change could reflect broader regional shifts towards more consistent precipitation, potentially reducing the risk of flooding from intense storms.
Extreme Temperature Records
New Orleans Audubon has recorded extreme temperatures with a maximum of 40.0°C (104.0°F) and a minimum of -17.8°C (0.0°F). These records underscore the range of climatic conditions experienced in the region, from sweltering summer heat to rare cold snaps. Such extremes are crucial for understanding the potential impacts of climate variability on local ecosystems and infrastructure.
Regional Climate Considerations
In the context of the United States' climate goals, which focus on reducing greenhouse gas emissions and enhancing resilience to climate impacts, the trends observed at New Orleans Audubon are particularly relevant. The cooling trend over the past decade may offer temporary respite from heat-related stresses, but the long-term warming trend and changes in precipitation patterns underscore the need for adaptive strategies. These insights are vital for informing local policy and planning efforts aimed at mitigating and adapting to climate change impacts in the Gulf Coast region.
Station Statistics
10-Year Trend
High: -2.03 °F/decade
Low: -2.03 °F/decade
Rain: -0.059 in/decade
25-Year Trend
High: +0.50 °F/decade
Low: +0.87 °F/decade
Rain: -0.002 in/decade
50-Year Trend
High: +0.46 °F/decade
Low: +0.56 °F/decade
Rain: -0.002 in/decade
All-Time Trend
High: +0.04 °F/decade
Low: +0.37 °F/decade
Rain: +0.000 in/decade
Percentage Above-Average Days
Last 12 Months: 59.1%
This Year: 52.0%
Precipitation Concentration Index (PCI) ℹ️
Last 12 Months: 12.8
Historical Average: 12.3
Percentile Rank of Last 12 Months ℹ️
High: 60th percentile
Low: 75th percentile
Rain: 19th percentile
Change in Variance ℹ️
High: -3.5%
Low: -2.7%
Intraday: -25.5%
Data Coverage
87.9%
First Year of Data
1893
Station Location
Historical Weather Records
| Max High | Avg High | Min High | Max Avg | Avg Avg | Min Avg | Max Low | Avg Low | Min Low | Max Precipitation | Avg Precipitation | Max Snow | Avg Snow | |
|---|---|---|---|---|---|---|---|---|---|---|---|---|---|
| Record | 104.00 °F | — | 24.98 °F | 91.76 °F | — | 17.96 °F | 84.92 °F | — | -0.04 °F | 13.08 in | — | 10.00 in | — |
| January | 84.02 °F | 63.66 °F | 24.98 °F | 76.64 °F | 53.31 °F | 18.68 °F | 73.04 °F | 45.04 °F | -0.04 °F | 5.65 in | 0.15 in | 4.02 in | 0.00 in |
| February | 86.00 °F | 66.61 °F | 28.94 °F | 76.64 °F | 56.69 °F | 23.90 °F | 73.04 °F | 47.70 °F | 6.08 °F | 6.45 in | 0.17 in | 10.00 in | 0.01 in |
| March | 91.04 °F | 73.01 °F | 37.94 °F | 80.24 °F | 62.85 °F | 32.36 °F | 75.02 °F | 53.70 °F | 26.06 °F | 9.00 in | 0.16 in | 0.00 in | 0.00 in |
| April | 98.96 °F | 79.21 °F | 48.02 °F | 80.96 °F | 69.27 °F | 46.40 °F | 78.98 °F | 59.92 °F | 32.00 °F | 13.00 in | 0.17 in | 0.00 in | 0.00 in |
| May | 98.96 °F | 85.55 °F | 62.06 °F | 87.08 °F | 76.10 °F | 57.02 °F | 84.02 °F | 66.75 °F | 46.04 °F | 9.31 in | 0.16 in | 0.00 in | 0.00 in |
| June | 104.00 °F | 90.57 °F | 71.96 °F | 90.32 °F | 80.95 °F | 67.10 °F | 84.02 °F | 72.51 °F | 53.96 °F | 6.43 in | 0.20 in | 0.00 in | 0.00 in |
| July | 102.02 °F | 91.63 °F | 77.00 °F | 91.22 °F | 82.13 °F | 72.50 °F | 84.92 °F | 74.41 °F | 64.04 °F | 4.67 in | 0.22 in | 0.00 in | 0.00 in |
| August | 104.00 °F | 91.62 °F | 73.04 °F | 91.76 °F | 82.17 °F | 73.04 °F | 84.92 °F | 74.50 °F | 64.04 °F | 7.12 in | 0.20 in | 0.00 in | 0.00 in |
| September | 100.94 °F | 88.24 °F | 62.96 °F | 89.78 °F | 78.97 °F | 60.98 °F | 82.94 °F | 71.26 °F | 51.98 °F | 12.96 in | 0.19 in | 0.00 in | 0.00 in |
| October | 96.98 °F | 80.94 °F | 50.00 °F | 86.00 °F | 70.84 °F | 42.62 °F | 84.92 °F | 61.89 °F | 35.06 °F | 13.08 in | 0.11 in | 0.00 in | 0.00 in |
| November | 91.94 °F | 71.85 °F | 39.02 °F | 80.06 °F | 61.77 °F | 35.06 °F | 78.08 °F | 52.54 °F | 6.98 °F | 6.21 in | 0.12 in | 0.00 in | 0.00 in |
| December | 84.92 °F | 65.37 °F | 26.96 °F | 77.72 °F | 55.60 °F | 17.96 °F | 75.02 °F | 47.02 °F | 1.94 °F | 4.63 in | 0.16 in | 4.49 in | 0.00 in |
Data Visualisations
Remove WatermarksCurrent Year Climate Trends vs Historical


Max Temperature this Year | 1 of 6
Climate 12-Month Moving Averages


Max Temperature 12-Month MA | 1 of 6
Daily Data Points and Averages Throughout the Year


Average Max Temperature Throughout Year | 1 of 5
