Climate for Station: Morgantown Muni Ap, West Virginia, United States
Loading live weather...
Climate Analysis & Overview
Morgantown Muni Ap is experiencing a subtle warming trend in its daytime temperatures, while nighttime temperatures have shown a slight cooling over the past decade. Precipitation patterns have become marginally more even, reflecting regional climate shifts.
Appalachian Climate Dynamics
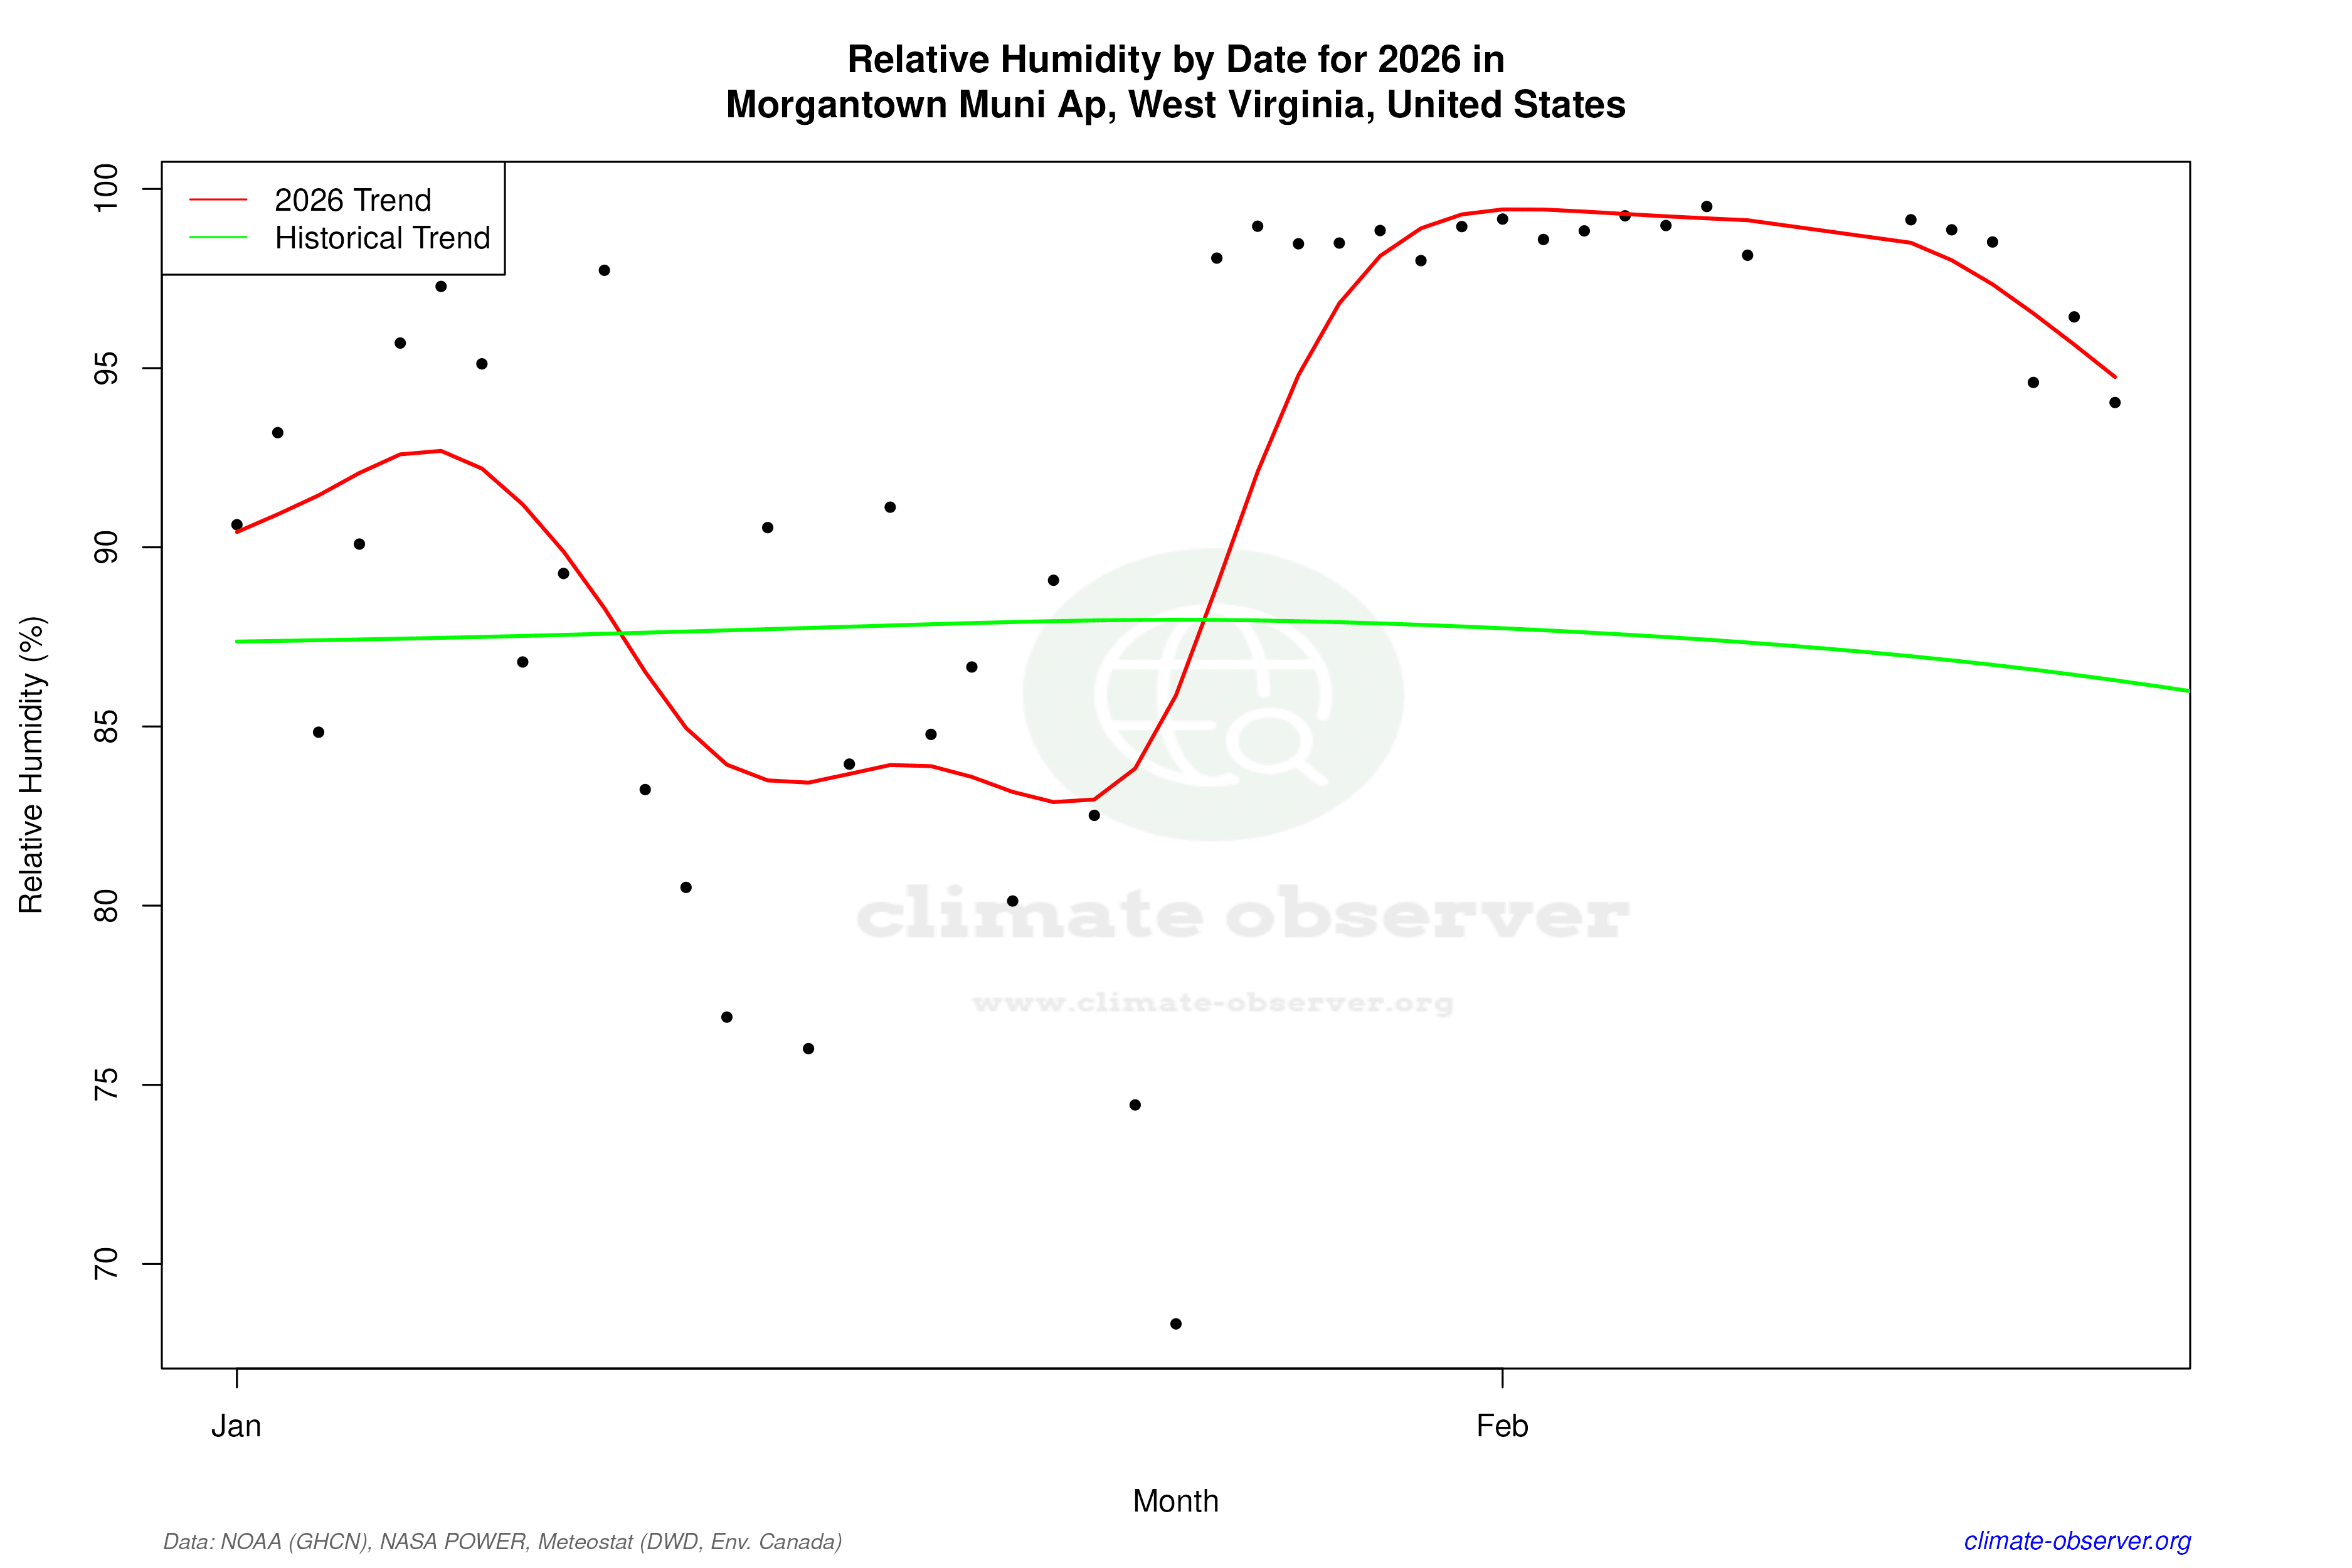
Located at 39.6497°N, -79.9206°W, Morgantown Muni Ap sits within the humid continental climate zone, characterised by cold winters and warm summers. The nearby Appalachian Mountains play a significant role in shaping the local climate, often acting as a barrier that influences precipitation and temperature patterns. Over the past decade, the region has seen a warming trend in high temperatures, with an increase of 0.28°C (0.50°F), while low temperatures have decreased by 0.42°C (0.76°F). This dichotomy suggests a shift towards warmer days but cooler nights, possibly influenced by regional atmospheric changes.
Long-term Temperature Trends
Analysing the all-time temperature trends, Morgantown Muni Ap has experienced a slight warming in high temperatures, with an increase of 0.09°C (0.16°F). In contrast, low temperatures have risen by a modest 0.03°C (0.06°F). These figures indicate a gradual warming trend over the years, aligning with broader global climate patterns. The maximum recorded temperature at the station is 42.2°C (108.0°F), while the minimum is -28.9°C (-20.0°F), showcasing the extremes that can occur in this region.
Precipitation Patterns and PCI
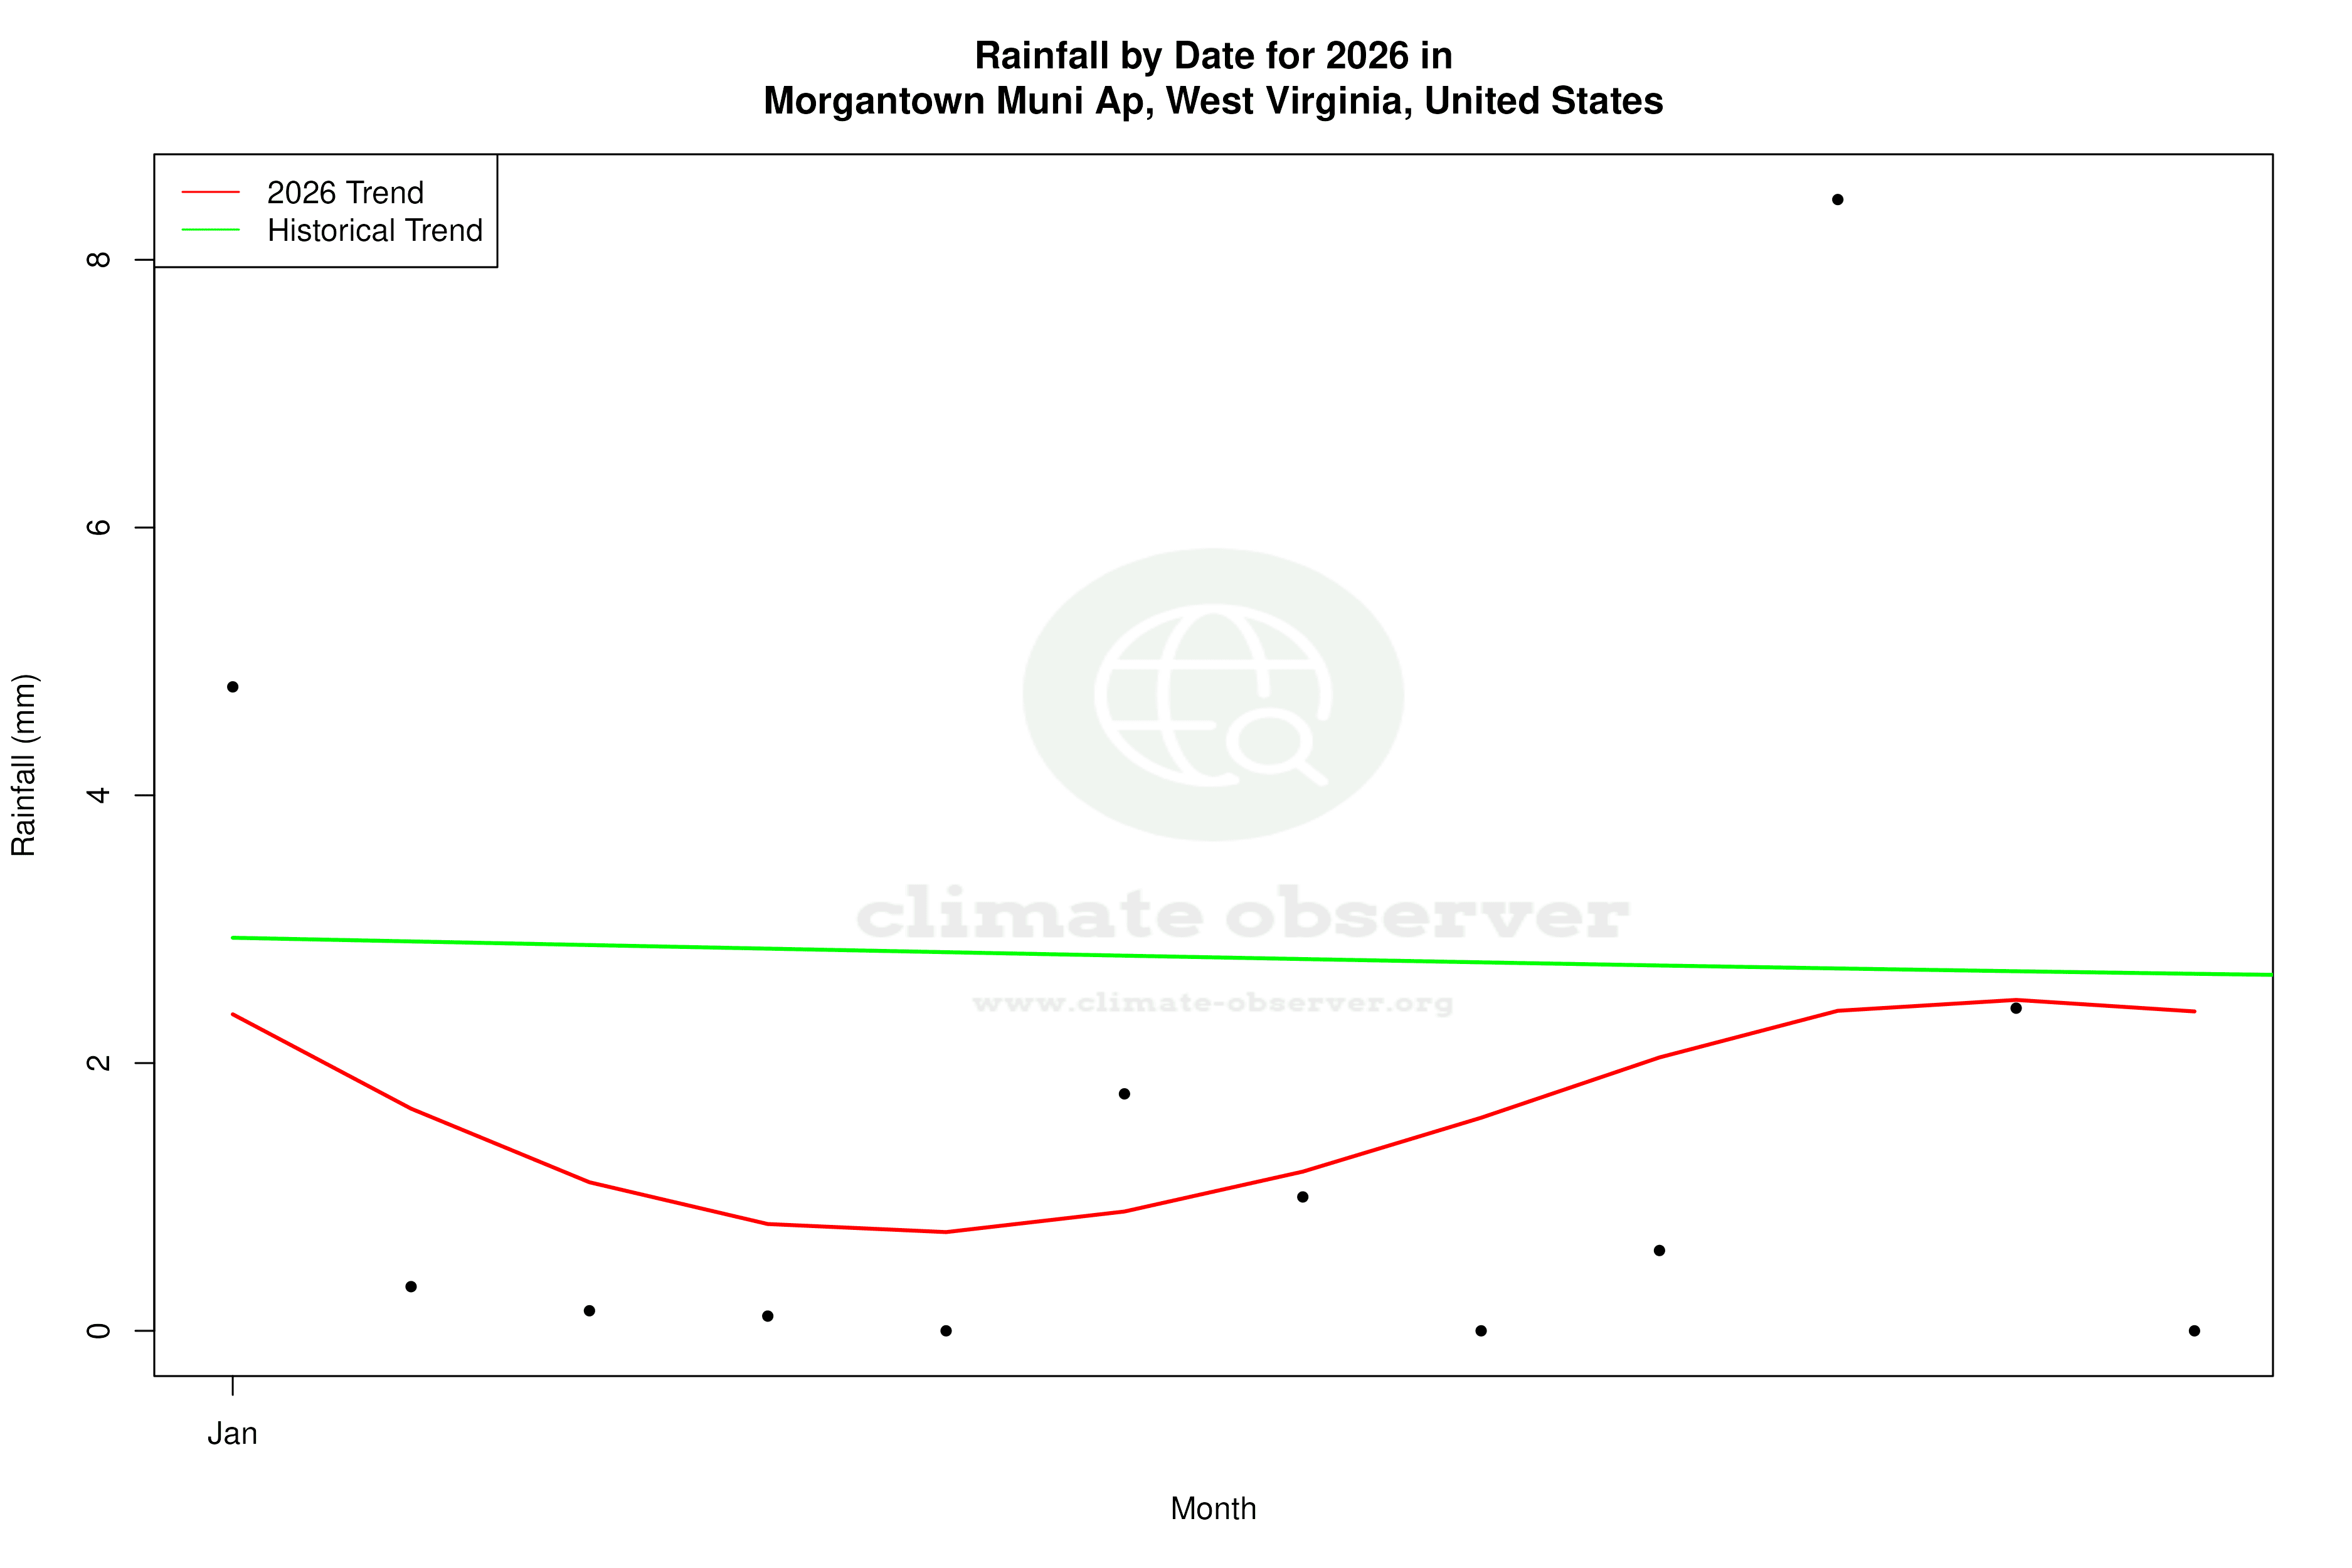
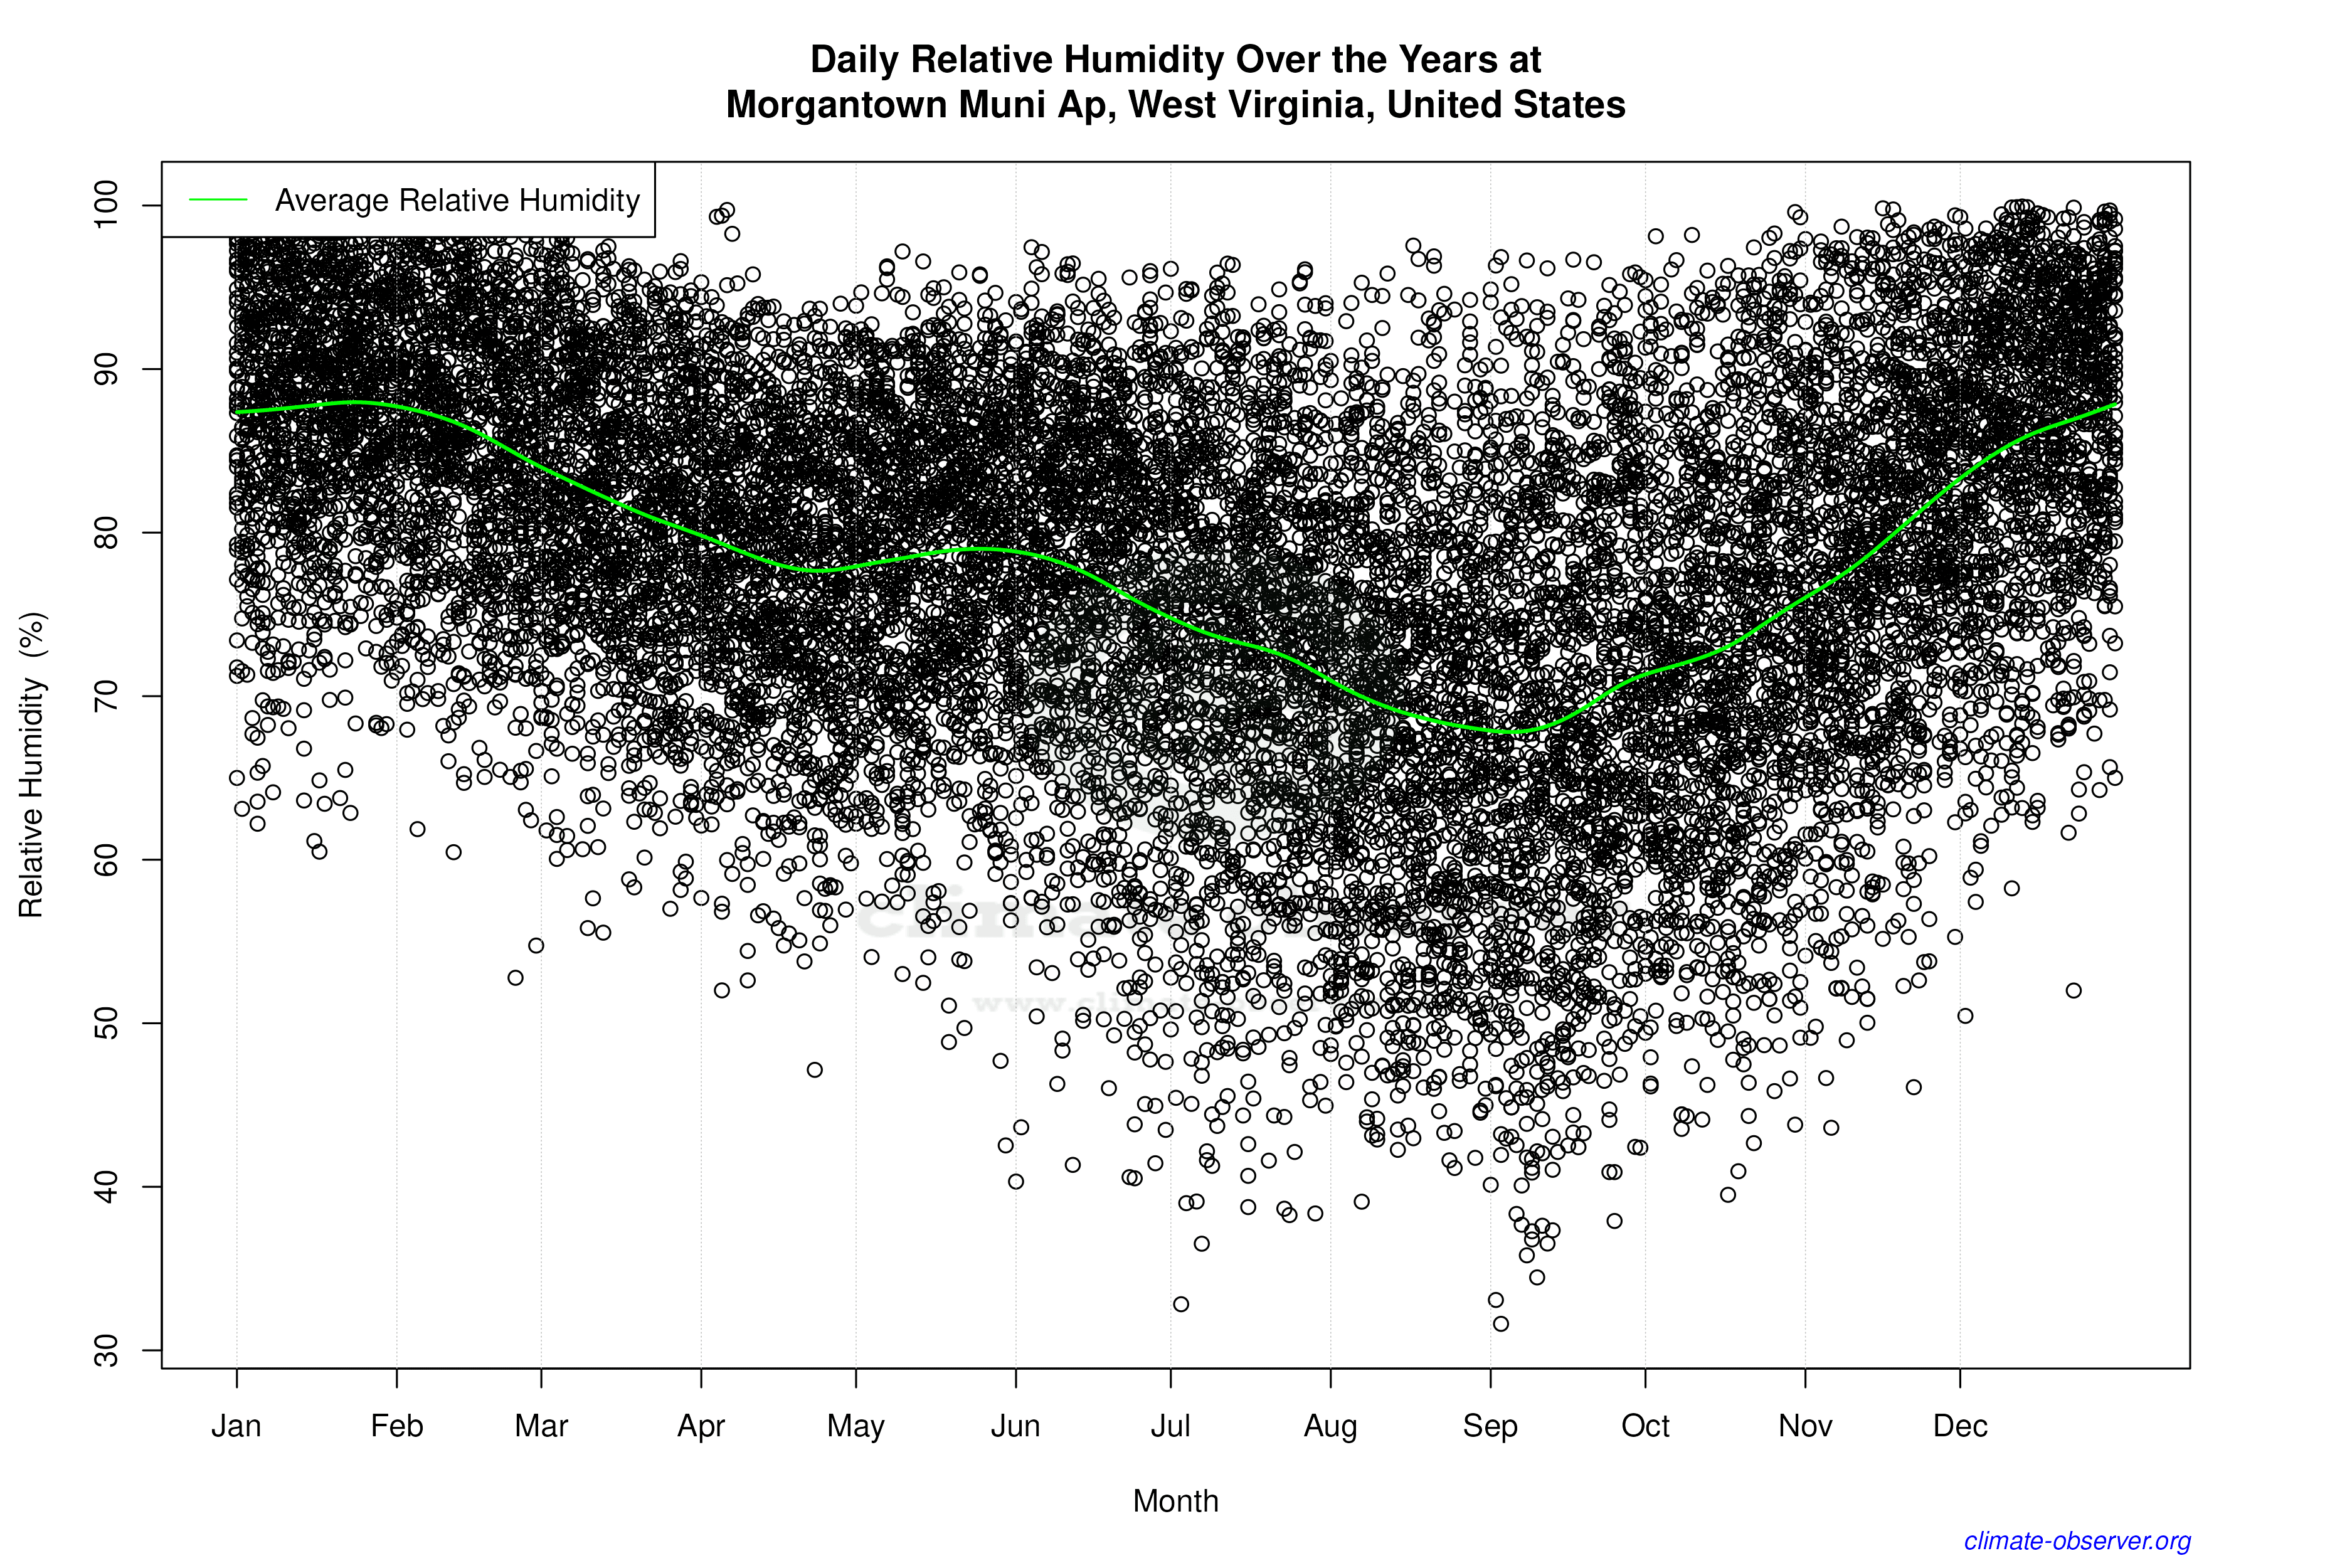
The Precipitation Concentration Index (PCI) offers insights into how rainfall is distributed over time. Morgantown Muni Ap's PCI has decreased from a baseline of 10.85 to a current value of 10.61, indicating a marginal shift towards more evenly distributed precipitation events. A PCI under 10 is considered very even, suggesting the region's precipitation is becoming less concentrated in intense events, which could be beneficial for agriculture and water management.
Regional Climate Context
The trends observed at Morgantown Muni Ap are consistent with broader efforts in the United States to understand and mitigate climate change impacts. Recent weather events, such as increased frequency of heatwaves in the Eastern United States, underscore the importance of monitoring these subtle shifts. The slight warming of daytime temperatures and the more even distribution of precipitation could have implications for local ecosystems and human activities.
Implications for Future Climate Monitoring
The data from Morgantown Muni Ap highlights the need for continuous monitoring to better understand the evolving climate dynamics in the Appalachian region. As the United States continues to pursue climate goals, such as reducing greenhouse gas emissions, understanding localised trends will be crucial in developing effective adaptation and mitigation strategies.
Station Statistics
10-Year Trend
High: +0.49 °F/decade
Low: -0.90 °F/decade
Rain: +0.002 in/decade
25-Year Trend
High: +1.29 °F/decade
Low: +1.01 °F/decade
Rain: +0.002 in/decade
50-Year Trend
High: +0.74 °F/decade
Low: +0.65 °F/decade
Rain: -0.000 in/decade
All-Time Trend
High: +0.16 °F/decade
Low: +0.06 °F/decade
Rain: -0.000 in/decade
Percentage Above-Average Days
Last 12 Months: 57.5%
This Year: 54.7%
Precipitation Concentration Index (PCI) ℹ️
Last 12 Months: 9.4
Historical Average: 9.7
Percentile Rank of Last 12 Months ℹ️
High: 80th percentile
Low: 76th percentile
Rain: 74th percentile
Change in Variance ℹ️
High: -7.1%
Low: -3.9%
Intraday: -4.9%
Data Coverage
85.2%
First Year of Data
1878
Station Location
Historical Weather Records
| Max High | Avg High | Min High | Max Avg | Avg Avg | Min Avg | Max Low | Avg Low | Min Low | Max Precipitation | Avg Precipitation | Max Snow | Avg Snow | |
|---|---|---|---|---|---|---|---|---|---|---|---|---|---|
| Record | 107.96 °F | — | -4.00 °F | 87.26 °F | — | -9.94 °F | 78.08 °F | — | -20.02 °F | 5.01 in | — | 20.00 in | — |
| January | 75.56 °F | 39.46 °F | -0.94 °F | 65.12 °F | 30.74 °F | -9.94 °F | 60.08 °F | 23.39 °F | -20.02 °F | 1.64 in | 0.10 in | 17.80 in | 0.32 in |
| February | 78.08 °F | 43.03 °F | 6.08 °F | 69.08 °F | 33.92 °F | 3.02 °F | 62.06 °F | 25.21 °F | -9.94 °F | 1.87 in | 0.10 in | 10.00 in | 0.26 in |
| March | 86.00 °F | 52.45 °F | 15.08 °F | 72.68 °F | 42.84 °F | -0.04 °F | 68.00 °F | 32.51 °F | -2.74 °F | 2.17 in | 0.12 in | 20.00 in | 0.19 in |
| April | 91.94 °F | 64.13 °F | 28.04 °F | 78.62 °F | 53.11 °F | 25.70 °F | 69.08 °F | 41.85 °F | 14.00 °F | 2.65 in | 0.12 in | 9.29 in | 0.02 in |
| May | 95.00 °F | 73.03 °F | 41.00 °F | 80.06 °F | 61.91 °F | 35.96 °F | 69.98 °F | 50.88 °F | 24.98 °F | 2.82 in | 0.13 in | 0.59 in | 0.00 in |
| June | 98.06 °F | 80.38 °F | 48.02 °F | 85.28 °F | 69.52 °F | 48.78 °F | 77.00 °F | 58.94 °F | 30.02 °F | 2.75 in | 0.14 in | 0.00 in | 0.00 in |
| July | 107.96 °F | 83.93 °F | 60.98 °F | 87.26 °F | 73.37 °F | 57.47 °F | 78.08 °F | 63.40 °F | 41.00 °F | 2.97 in | 0.15 in | 0.00 in | 0.00 in |
| August | 98.96 °F | 82.43 °F | 60.08 °F | 84.31 °F | 72.09 °F | 52.34 °F | 75.92 °F | 62.01 °F | 37.94 °F | 5.01 in | 0.12 in | 0.00 in | 0.00 in |
| September | 102.02 °F | 76.40 °F | 48.92 °F | 81.68 °F | 65.62 °F | 43.88 °F | 73.94 °F | 55.54 °F | 30.02 °F | 2.66 in | 0.11 in | 0.00 in | 0.00 in |
| October | 98.06 °F | 65.67 °F | 33.98 °F | 81.50 °F | 54.46 °F | 32.97 °F | 71.06 °F | 44.61 °F | 17.06 °F | 4.20 in | 0.09 in | 2.52 in | 0.00 in |
| November | 82.94 °F | 53.37 °F | 10.04 °F | 71.96 °F | 44.56 °F | 13.46 °F | 64.94 °F | 35.44 °F | 3.02 °F | 3.18 in | 0.10 in | 17.72 in | 0.07 in |
| December | 77.00 °F | 43.42 °F | -4.00 °F | 65.30 °F | 35.58 °F | -6.90 °F | 62.06 °F | 27.65 °F | -13.00 °F | 1.82 in | 0.11 in | 11.42 in | 0.19 in |
Data Visualisations
Remove WatermarksCurrent Year Climate Trends vs Historical


Max Temperature this Year | 1 of 6
Climate 12-Month Moving Averages


Max Temperature 12-Month MA | 1 of 6
Daily Data Points and Averages Throughout the Year


Average Max Temperature Throughout Year | 1 of 5
