Climate for Station: Oklahoma Cy will Rogers World, Oklahoma, United States
Loading live weather...
Climate Analysis & Overview
Oklahoma City's Will Rogers World Airport has experienced a warming trend, with highs increasing by 0.13°C (0.23°F) over the long term. However, recent years have shown a more pronounced warming of 0.36°C (0.65°F) in high temperatures, while lows have marginally decreased. Precipitation is becoming more concentrated, indicating a shift towards intense weather events.
Thermal Variability in the Heartland
Oklahoma City, located at 35.3883°N, 97.6003°W, experiences a humid subtropical climate (Köppen classification Cfa), characterised by hot summers and mild winters. The city's geography, situated in the Great Plains, makes it susceptible to significant temperature fluctuations and severe weather events. Over the past decade, the region has seen a warming trend in high temperatures, with a rise of 0.36°C (0.65°F). This is more pronounced than the all-time trend of 0.13°C (0.23°F), indicating an acceleration in warming. Conversely, low temperatures have shown a slight cooling of 0.04°C (0.07°F) over the past decade, contrasting with an all-time warming trend of 0.06°C (0.11°F). This divergence suggests increased thermal variability, possibly linked to broader climatic shifts.
Precipitation Patterns: A Shift Towards Extremes
The Precipitation Concentration Index (PCI) at Will Rogers World Airport has increased from a baseline of 13.36 to a current value of 15.56. This indicates that precipitation is becoming more concentrated, with rainfall occurring in fewer, more intense events. Such a shift could lead to challenges in water management and increased flood risks. Although the PCI has not yet reached the threshold of 20, which signifies highly concentrated precipitation, the trend suggests a move towards more extreme weather patterns.
Record Extremes: A Tale of Temperature Extremes
Oklahoma City has recorded temperature extremes from a scorching high of 45.0°C (113.0°F) to a frigid low of -25.5°C (-13.9°F). These records highlight the city's susceptibility to extreme weather events, a characteristic of its location in Tornado Alley. Such extremes are likely to become more frequent as climate change continues to influence regional weather patterns.
Implications for Regional Climate Goals
As the United States aims to address climate change, understanding local climate dynamics is crucial. The warming trends and increasing precipitation concentration at Will Rogers World Airport underscore the need for adaptive strategies. These include enhancing infrastructure resilience and implementing sustainable water management practices. The ongoing climatic shifts in Oklahoma City serve as a microcosm of broader national challenges, emphasising the importance of regional data in informing policy decisions.
Station Statistics
10-Year Trend
High: +1.59 °F/decade
Low: +0.70 °F/decade
Rain: +0.001 in/decade
25-Year Trend
High: +0.42 °F/decade
Low: +0.16 °F/decade
Rain: +0.007 in/decade
50-Year Trend
High: +0.54 °F/decade
Low: +0.33 °F/decade
Rain: +0.001 in/decade
All-Time Trend
High: +0.24 °F/decade
Low: +0.11 °F/decade
Rain: +0.002 in/decade
Percentage Above-Average Days
Last 12 Months: 66.6%
This Year: 73.3%
Precipitation Concentration Index (PCI) ℹ️
Last 12 Months: 12.4
Historical Average: 13.6
Percentile Rank of Last 12 Months ℹ️
High: 91st percentile
Low: 85th percentile
Rain: 79th percentile
Change in Variance ℹ️
High: -9.7%
Low: -2.3%
Intraday: +3.8%
Data Coverage
97.6%
First Year of Data
1941
Station Location
Historical Weather Records
| Max High | Avg High | Min High | Max Avg | Avg Avg | Min Avg | Max Low | Avg Low | Min Low | Max Precipitation | Avg Precipitation | Max Snow | Avg Snow | |
|---|---|---|---|---|---|---|---|---|---|---|---|---|---|
| Record | 113.00 °F | — | 3.02 °F | 97.16 °F | — | -0.76 °F | 84.02 °F | — | -13.90 °F | 7.53 in | — | 13.50 in | — |
| January | 80.06 °F | 48.17 °F | 8.24 °F | 66.74 °F | 36.89 °F | 1.22 °F | 60.08 °F | 26.80 °F | -9.94 °F | 1.58 in | 0.04 in | 8.31 in | 0.09 in |
| February | 91.94 °F | 53.28 °F | 4.10 °F | 69.44 °F | 41.63 °F | -0.76 °F | 60.08 °F | 30.96 °F | -13.90 °F | 2.21 in | 0.05 in | 11.81 in | 0.08 in |
| March | 96.08 °F | 62.50 °F | 14.00 °F | 75.56 °F | 50.36 °F | 6.26 °F | 66.02 °F | 39.17 °F | 1.04 °F | 2.38 in | 0.08 in | 8.39 in | 0.04 in |
| April | 100.04 °F | 71.84 °F | 35.06 °F | 78.98 °F | 60.20 °F | 29.84 °F | 69.98 °F | 49.00 °F | 19.94 °F | 3.45 in | 0.11 in | 0.79 in | 0.00 in |
| May | 104.00 °F | 79.15 °F | 48.02 °F | 86.54 °F | 68.41 °F | 42.62 °F | 75.92 °F | 58.20 °F | 32.00 °F | 5.63 in | 0.17 in | 0.00 in | 0.00 in |
| June | 105.08 °F | 87.80 °F | 62.06 °F | 91.40 °F | 77.02 °F | 56.84 °F | 80.06 °F | 66.96 °F | 46.94 °F | 4.56 in | 0.15 in | 0.12 in | 0.00 in |
| July | 109.94 °F | 93.26 °F | 64.04 °F | 94.10 °F | 81.77 °F | 63.50 °F | 82.04 °F | 70.93 °F | 53.06 °F | 3.23 in | 0.10 in | 0.00 in | 0.00 in |
| August | 113.00 °F | 92.76 °F | 66.92 °F | 97.16 °F | 80.91 °F | 61.34 °F | 84.02 °F | 70.05 °F | 50.00 °F | 3.51 in | 0.09 in | 0.00 in | 0.00 in |
| September | 107.96 °F | 84.76 °F | 46.94 °F | 91.04 °F | 72.98 °F | 44.96 °F | 78.98 °F | 62.34 °F | 35.96 °F | 7.53 in | 0.11 in | 0.00 in | 0.00 in |
| October | 96.08 °F | 73.93 °F | 32.00 °F | 82.04 °F | 61.93 °F | 29.66 °F | 73.04 °F | 50.91 °F | 15.98 °F | 4.52 in | 0.10 in | 0.20 in | 0.00 in |
| November | 87.08 °F | 60.88 °F | 26.06 °F | 74.12 °F | 49.43 °F | 19.94 °F | 68.00 °F | 38.65 °F | 10.94 °F | 2.09 in | 0.06 in | 5.51 in | 0.02 in |
| December | 86.00 °F | 50.88 °F | 3.02 °F | 68.90 °F | 39.98 °F | -0.58 °F | 64.04 °F | 29.99 °F | -7.96 °F | 2.48 in | 0.05 in | 13.50 in | 0.06 in |
Data Visualisations
Remove WatermarksCurrent Year Climate Trends vs Historical

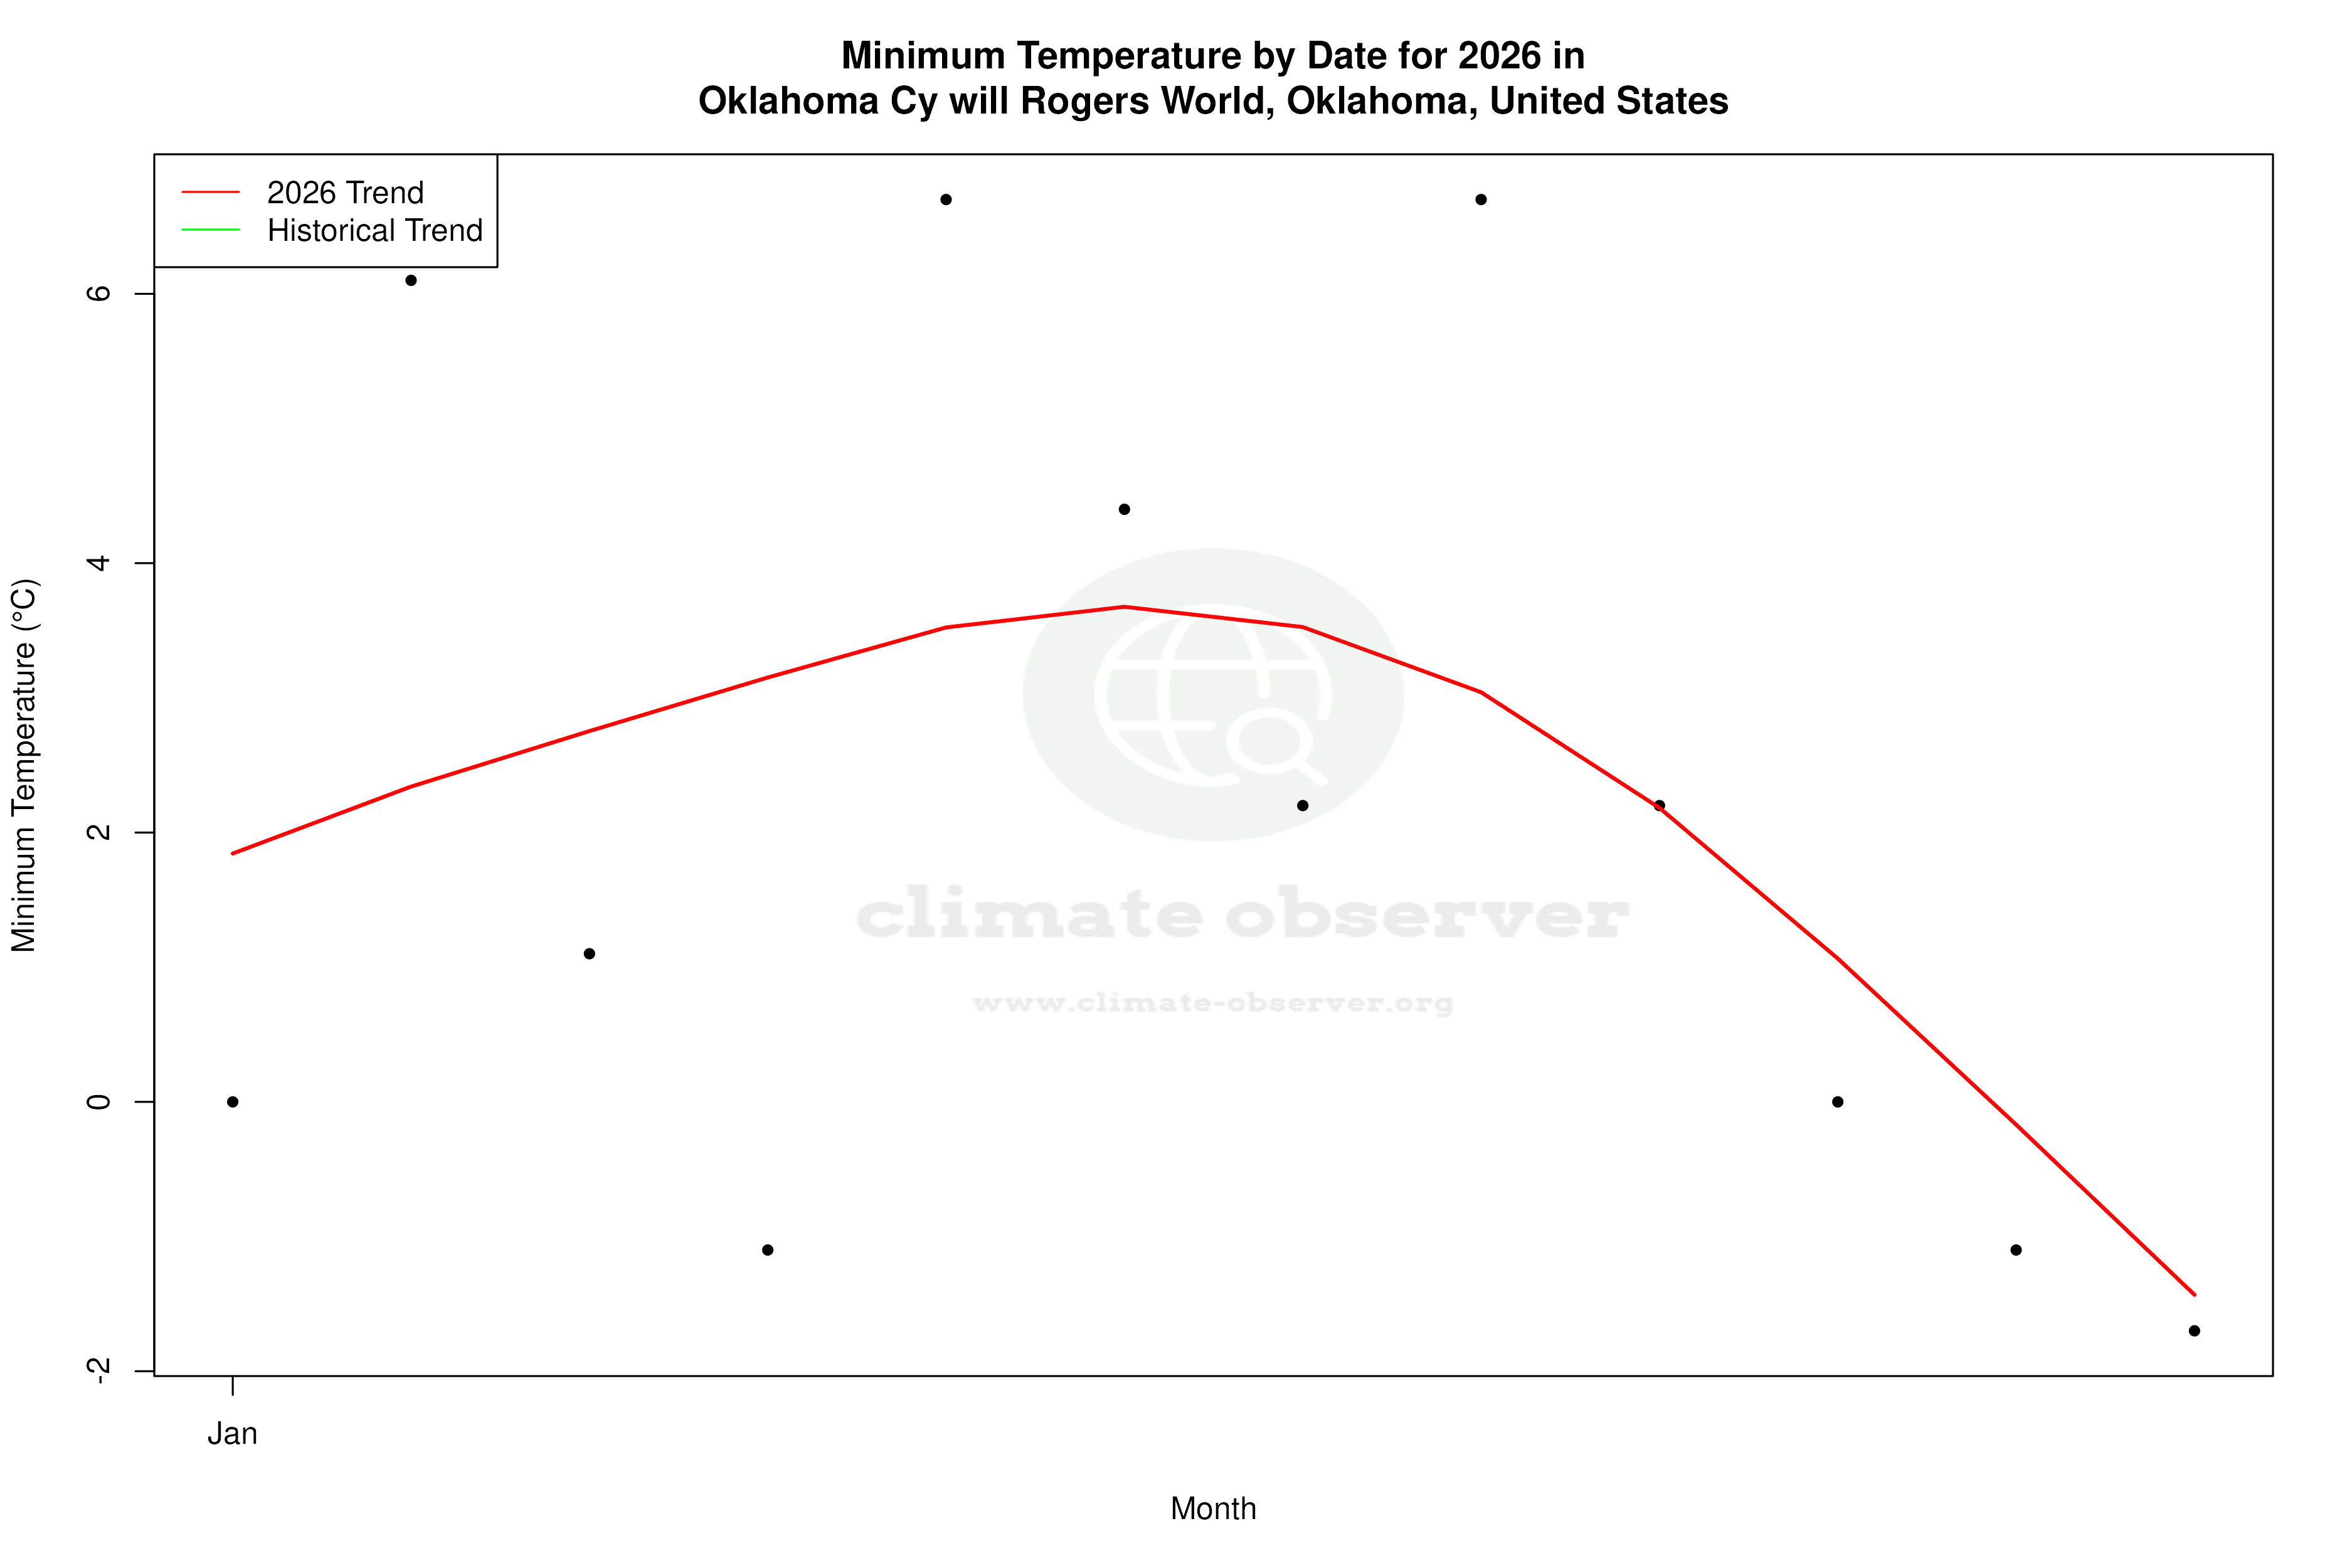

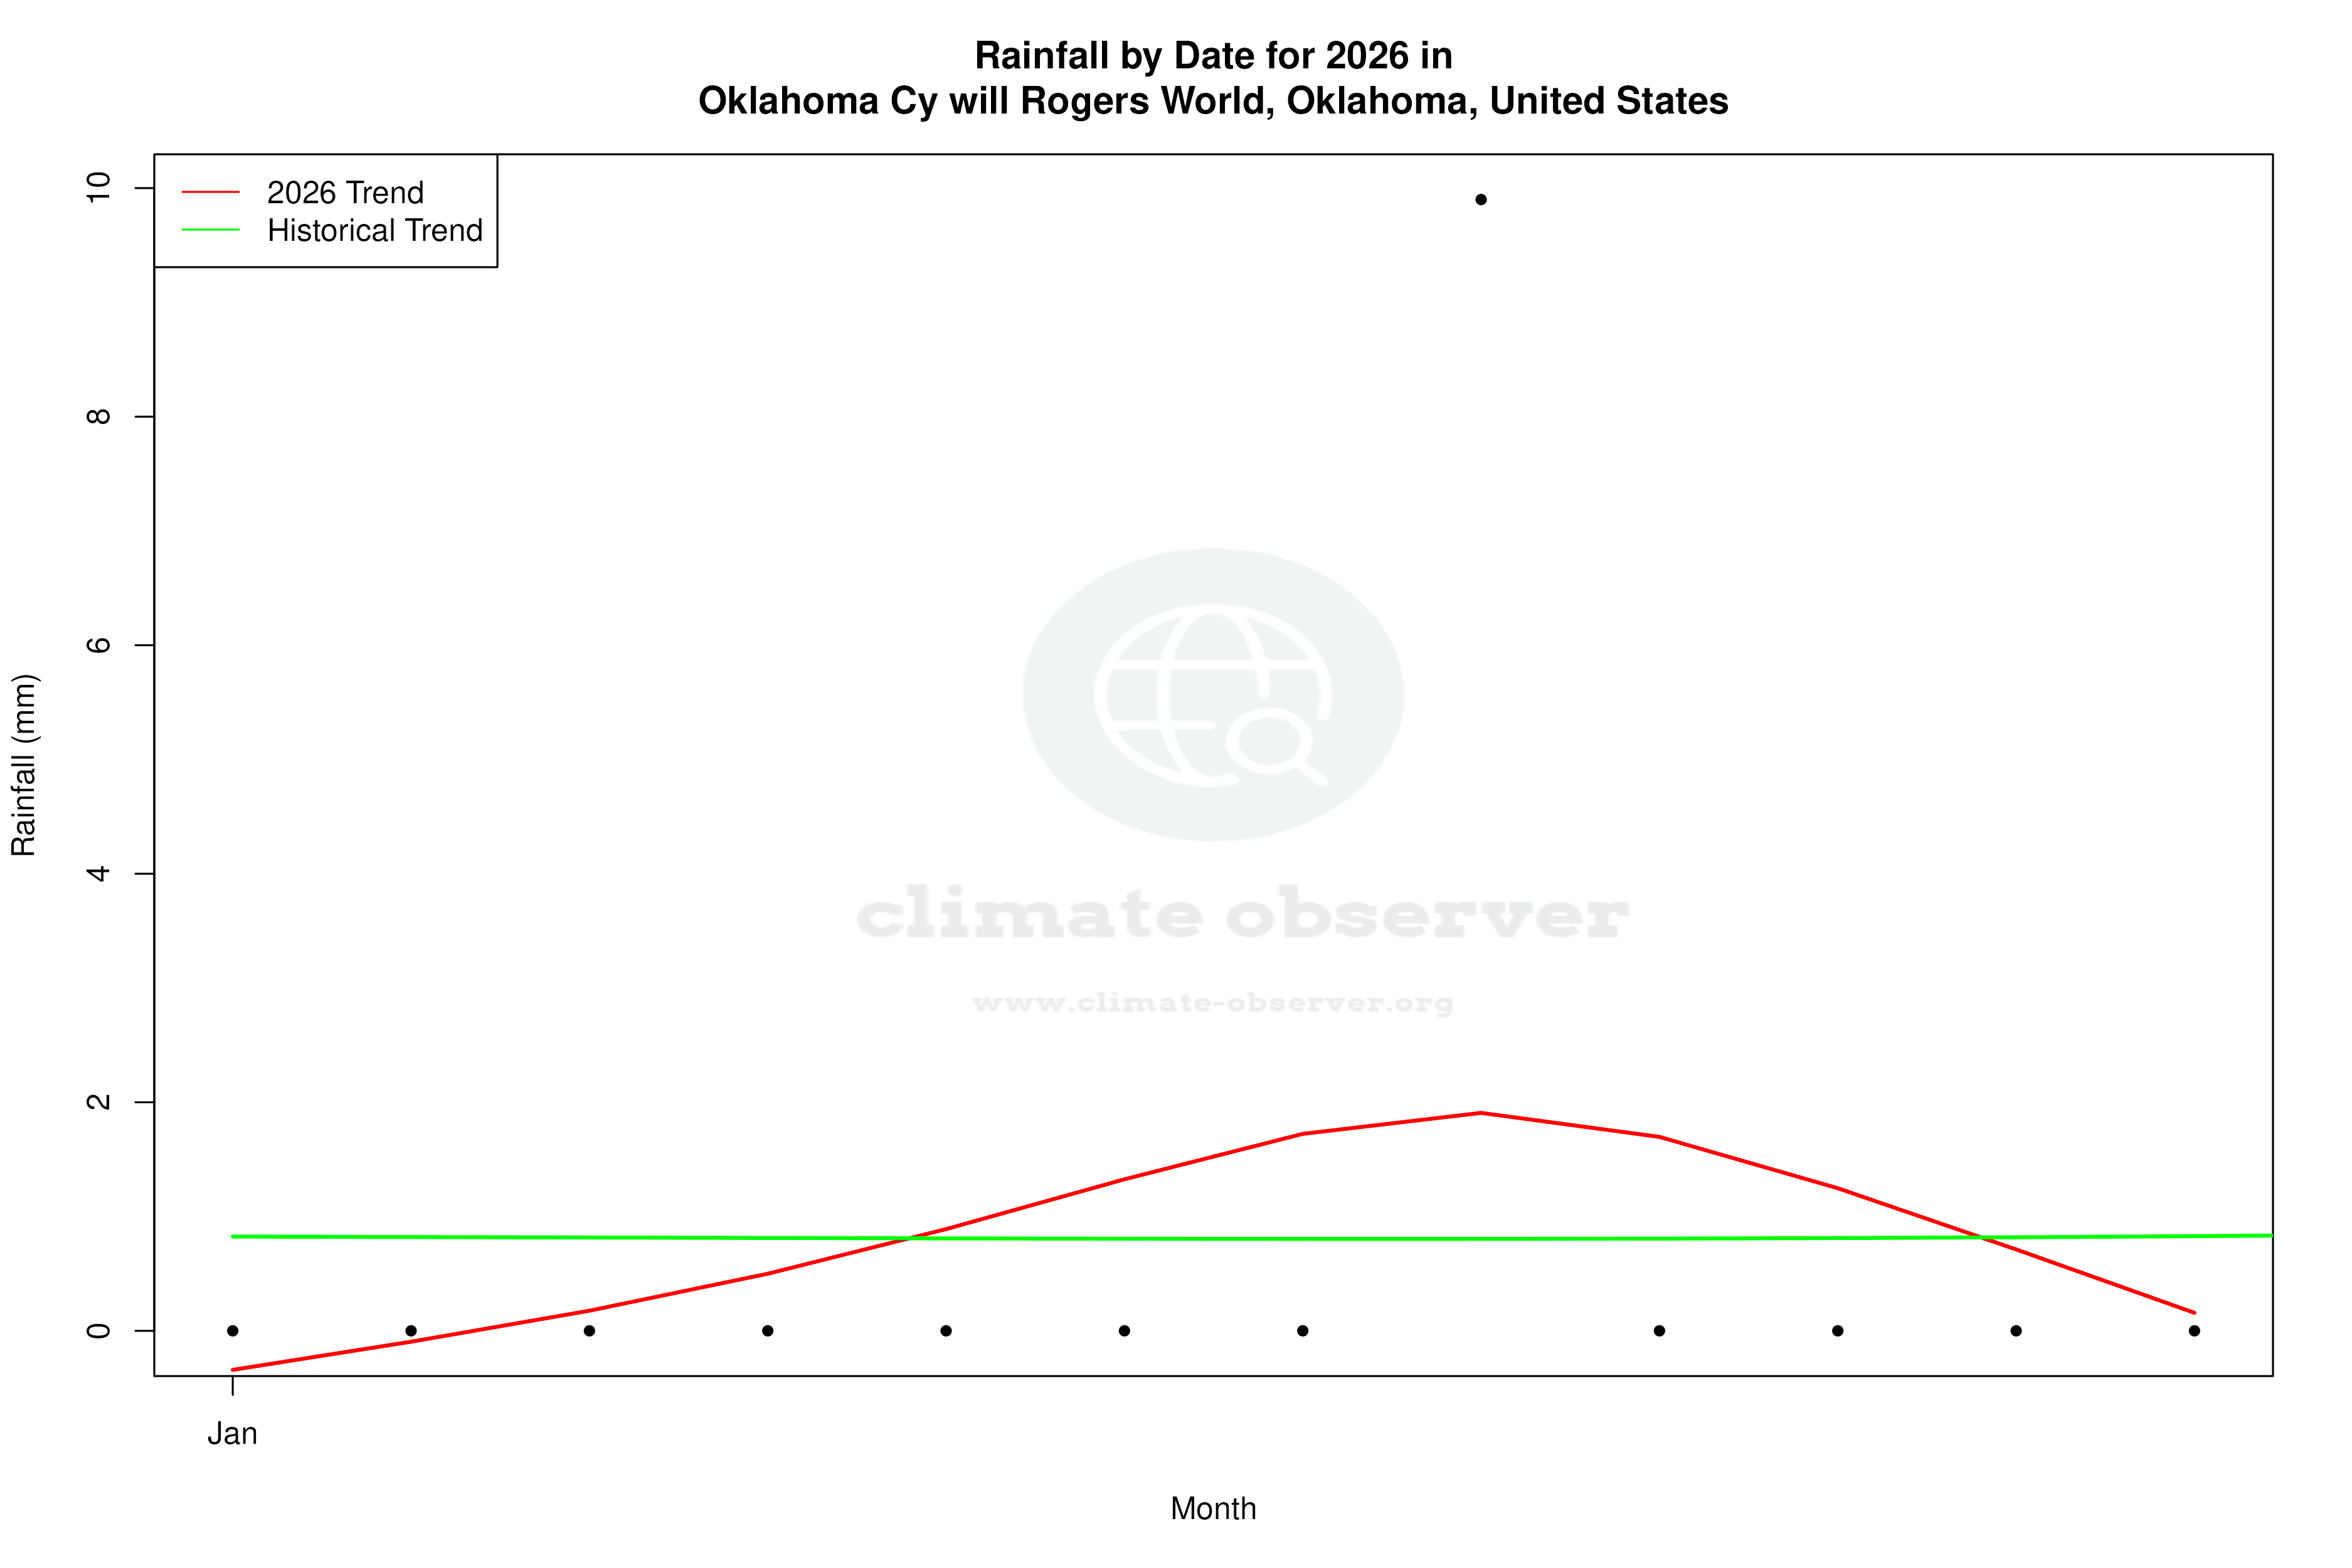


Max Temperature this Year | 1 of 6
Climate 12-Month Moving Averages
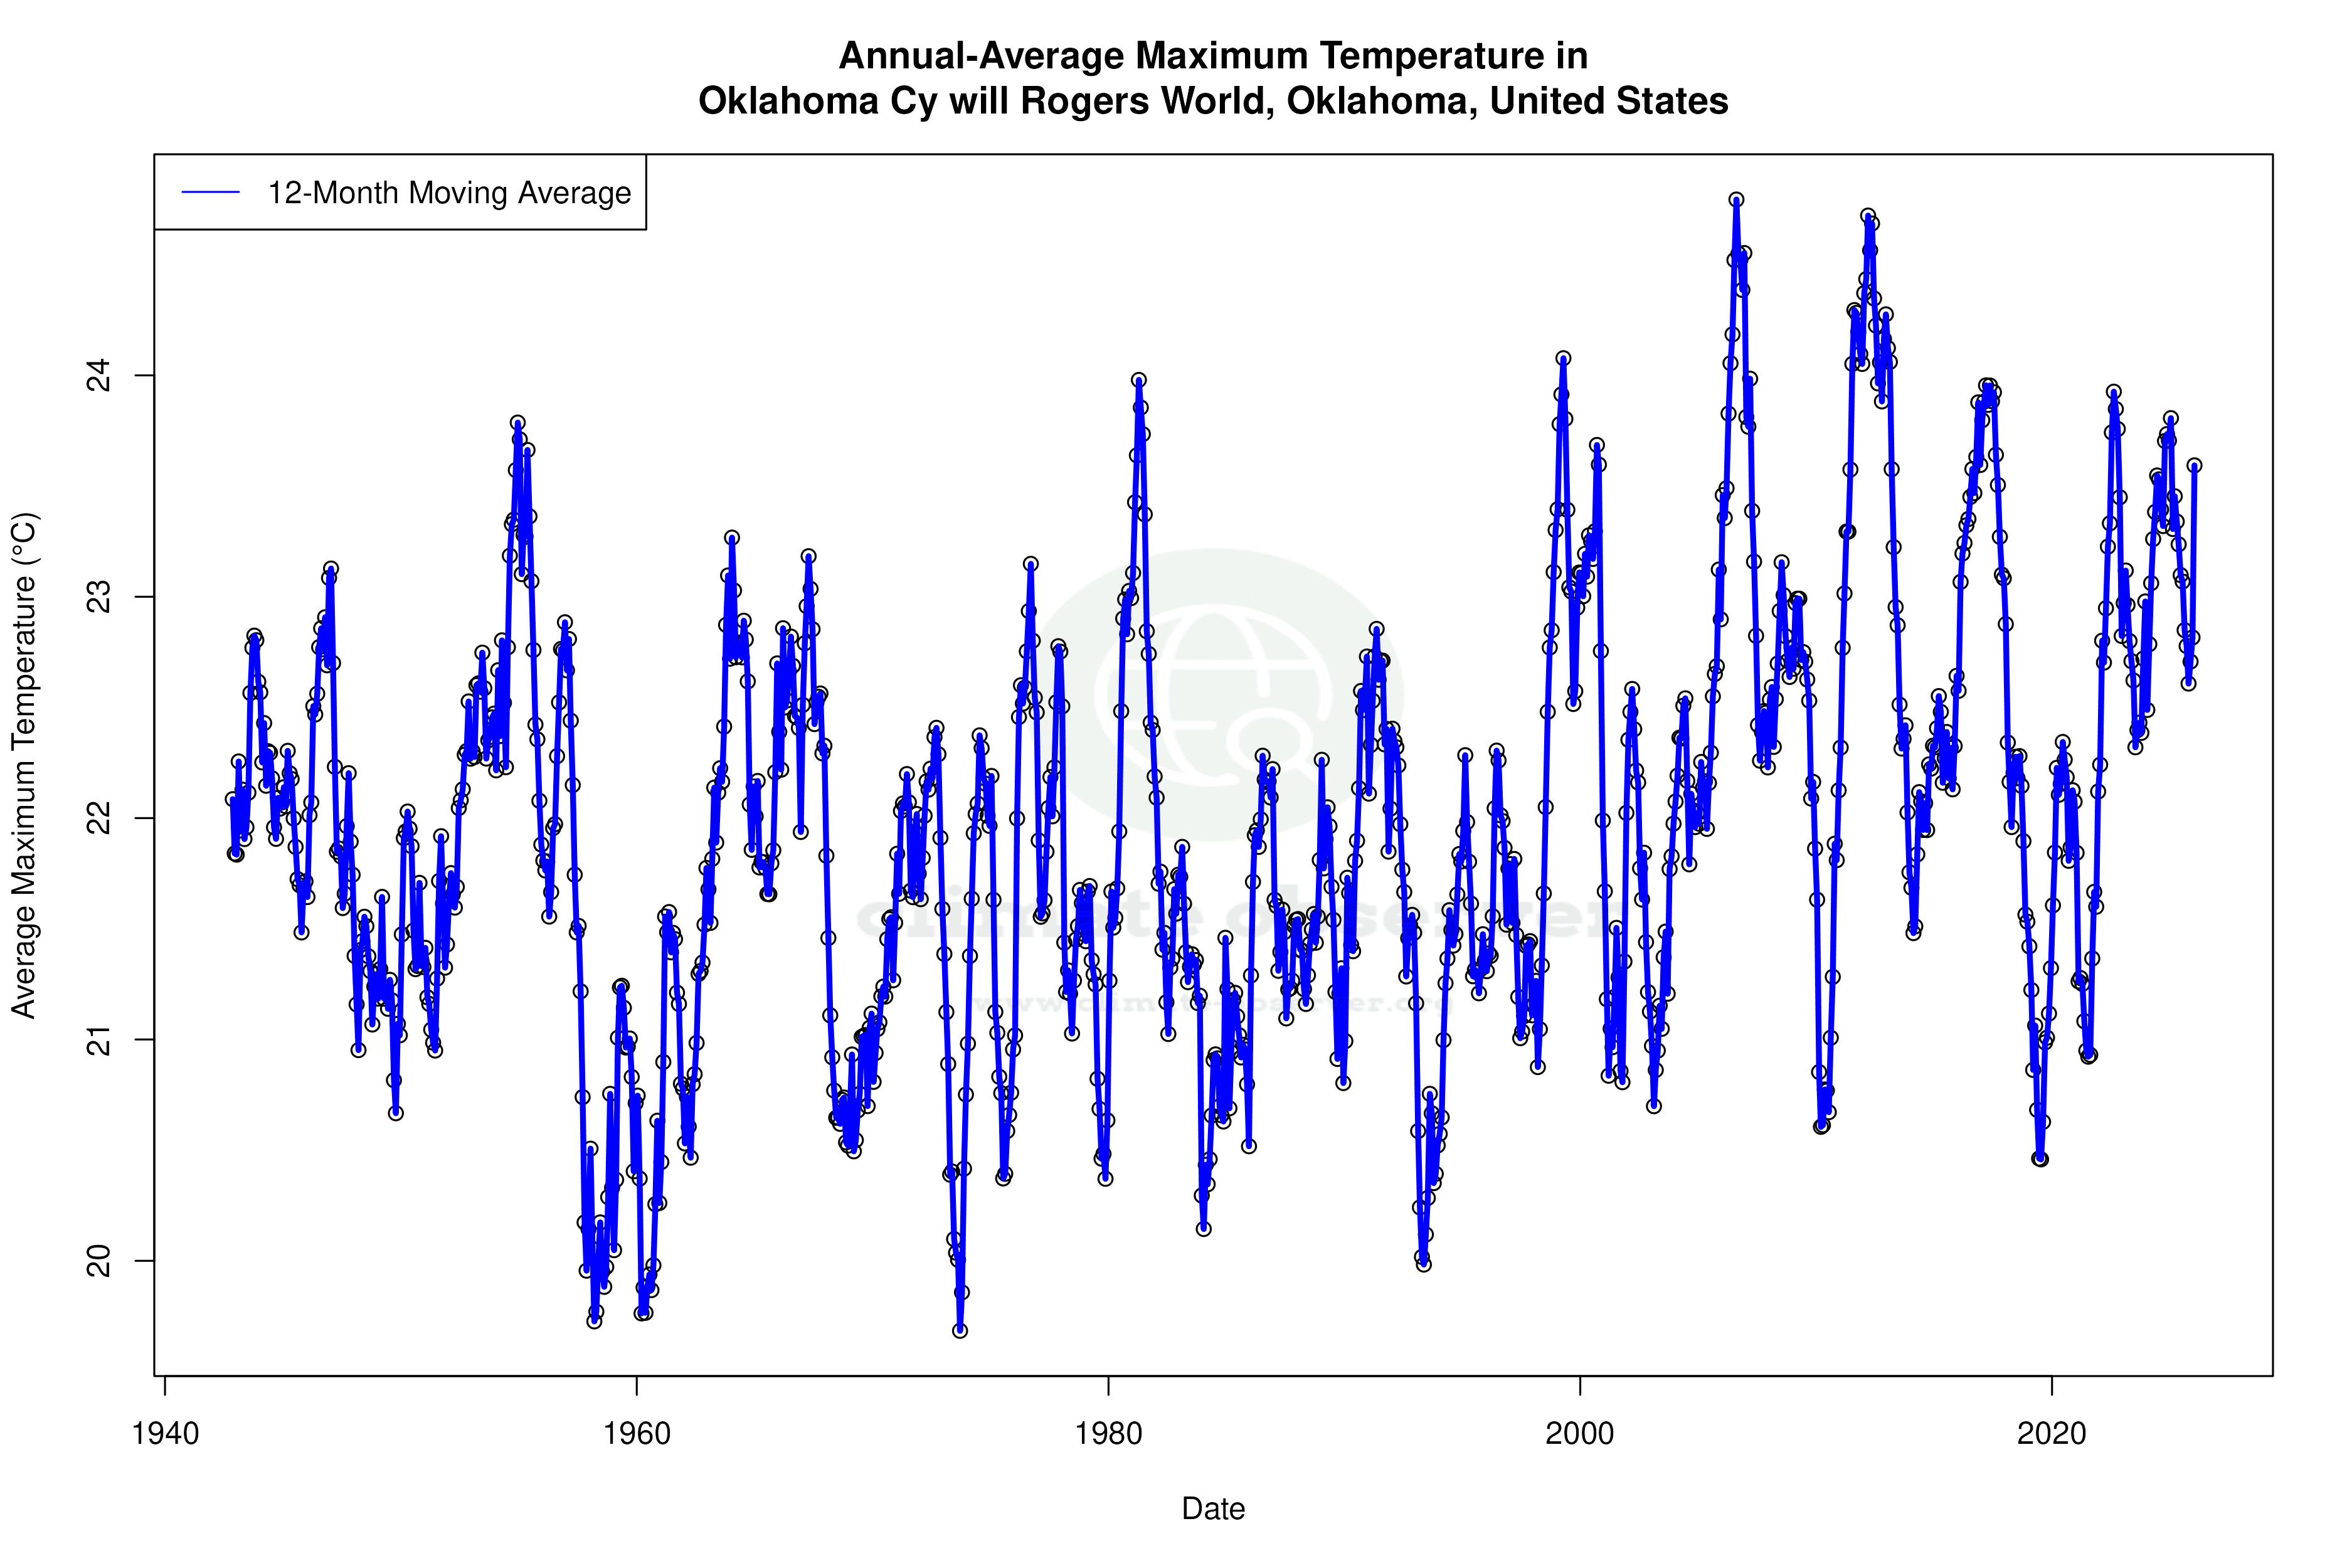
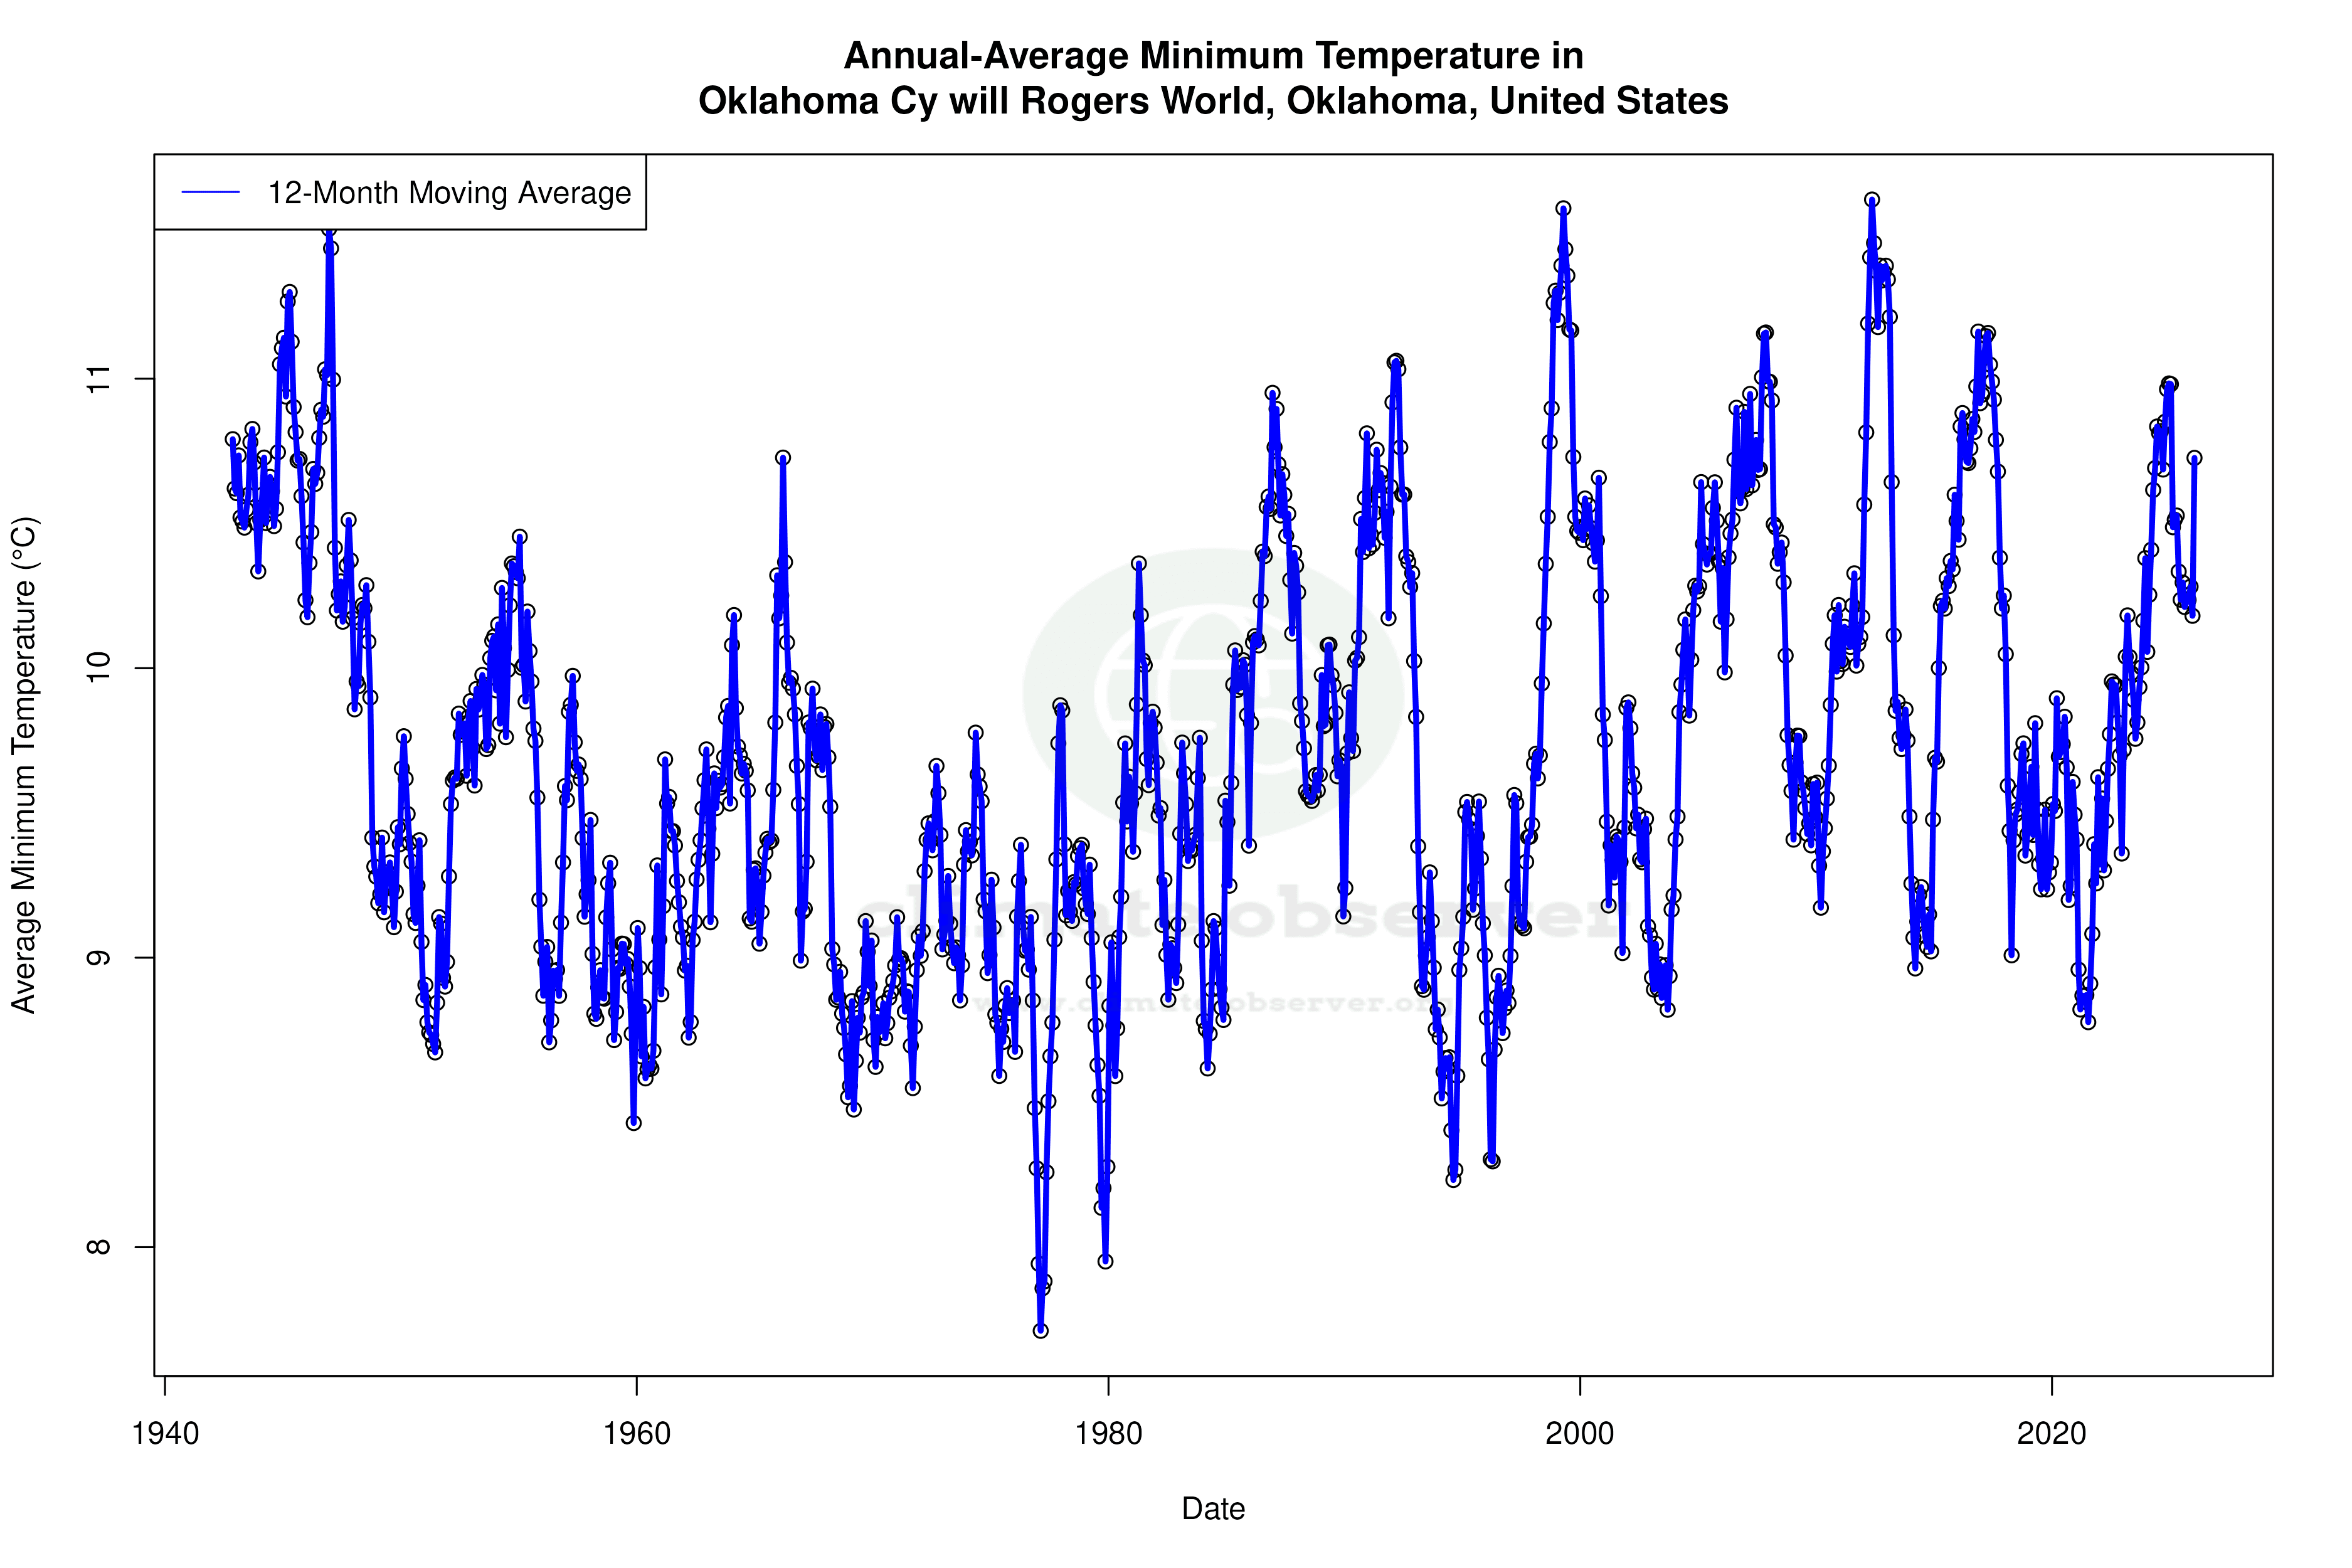


Max Temperature 12-Month MA | 1 of 6
Daily Data Points and Averages Throughout the Year


Average Max Temperature Throughout Year | 1 of 5
