Climate for Station: Newark Liberty Intl Ap, New Jersey, United States
Loading live weather...
Climate Analysis & Overview
Newark Liberty International Airport, located in the heart of New Jersey, is experiencing a warming trend, with more evenly distributed precipitation patterns. Recent data indicates a rise in both high and low temperatures over the past decade, reflecting broader regional climate shifts.
Köppen Climate Context
Newark Liberty International Airport is situated in a region classified under the Köppen climate system as humid subtropical (Cfa). This classification is characterised by hot, humid summers and mild to cool winters. The airport's proximity to the Atlantic Ocean and the urban heat island effect from nearby New York City contribute to its unique climate profile. The local geography, including the New Jersey Turnpike and surrounding urban infrastructure, influences temperature retention and precipitation patterns.
Temperature Trends: A Decade of Change
Over the past ten years, Newark has experienced a notable warming trend. High temperatures have increased by 0.83°C (1.49°F), while low temperatures have risen by 0.66°C (1.18°F). These changes are more pronounced than the all-time trends, which show a warming of 0.21°C (0.38°F) for highs and 0.17°C (0.31°F) for lows. This suggests that recent years have seen accelerated warming, possibly linked to increased urbanisation and global climate change.
Historical Extremes: Temperature Records
The station has recorded some extreme temperatures, with an all-time high of 42.2°C (108.0°F) and a record low of -25.6°C (-14.1°F). These extremes highlight the variability inherent in the region's climate, influenced by both seasonal shifts and occasional extreme weather events. Such records are crucial for understanding the potential impacts of future climate variability.
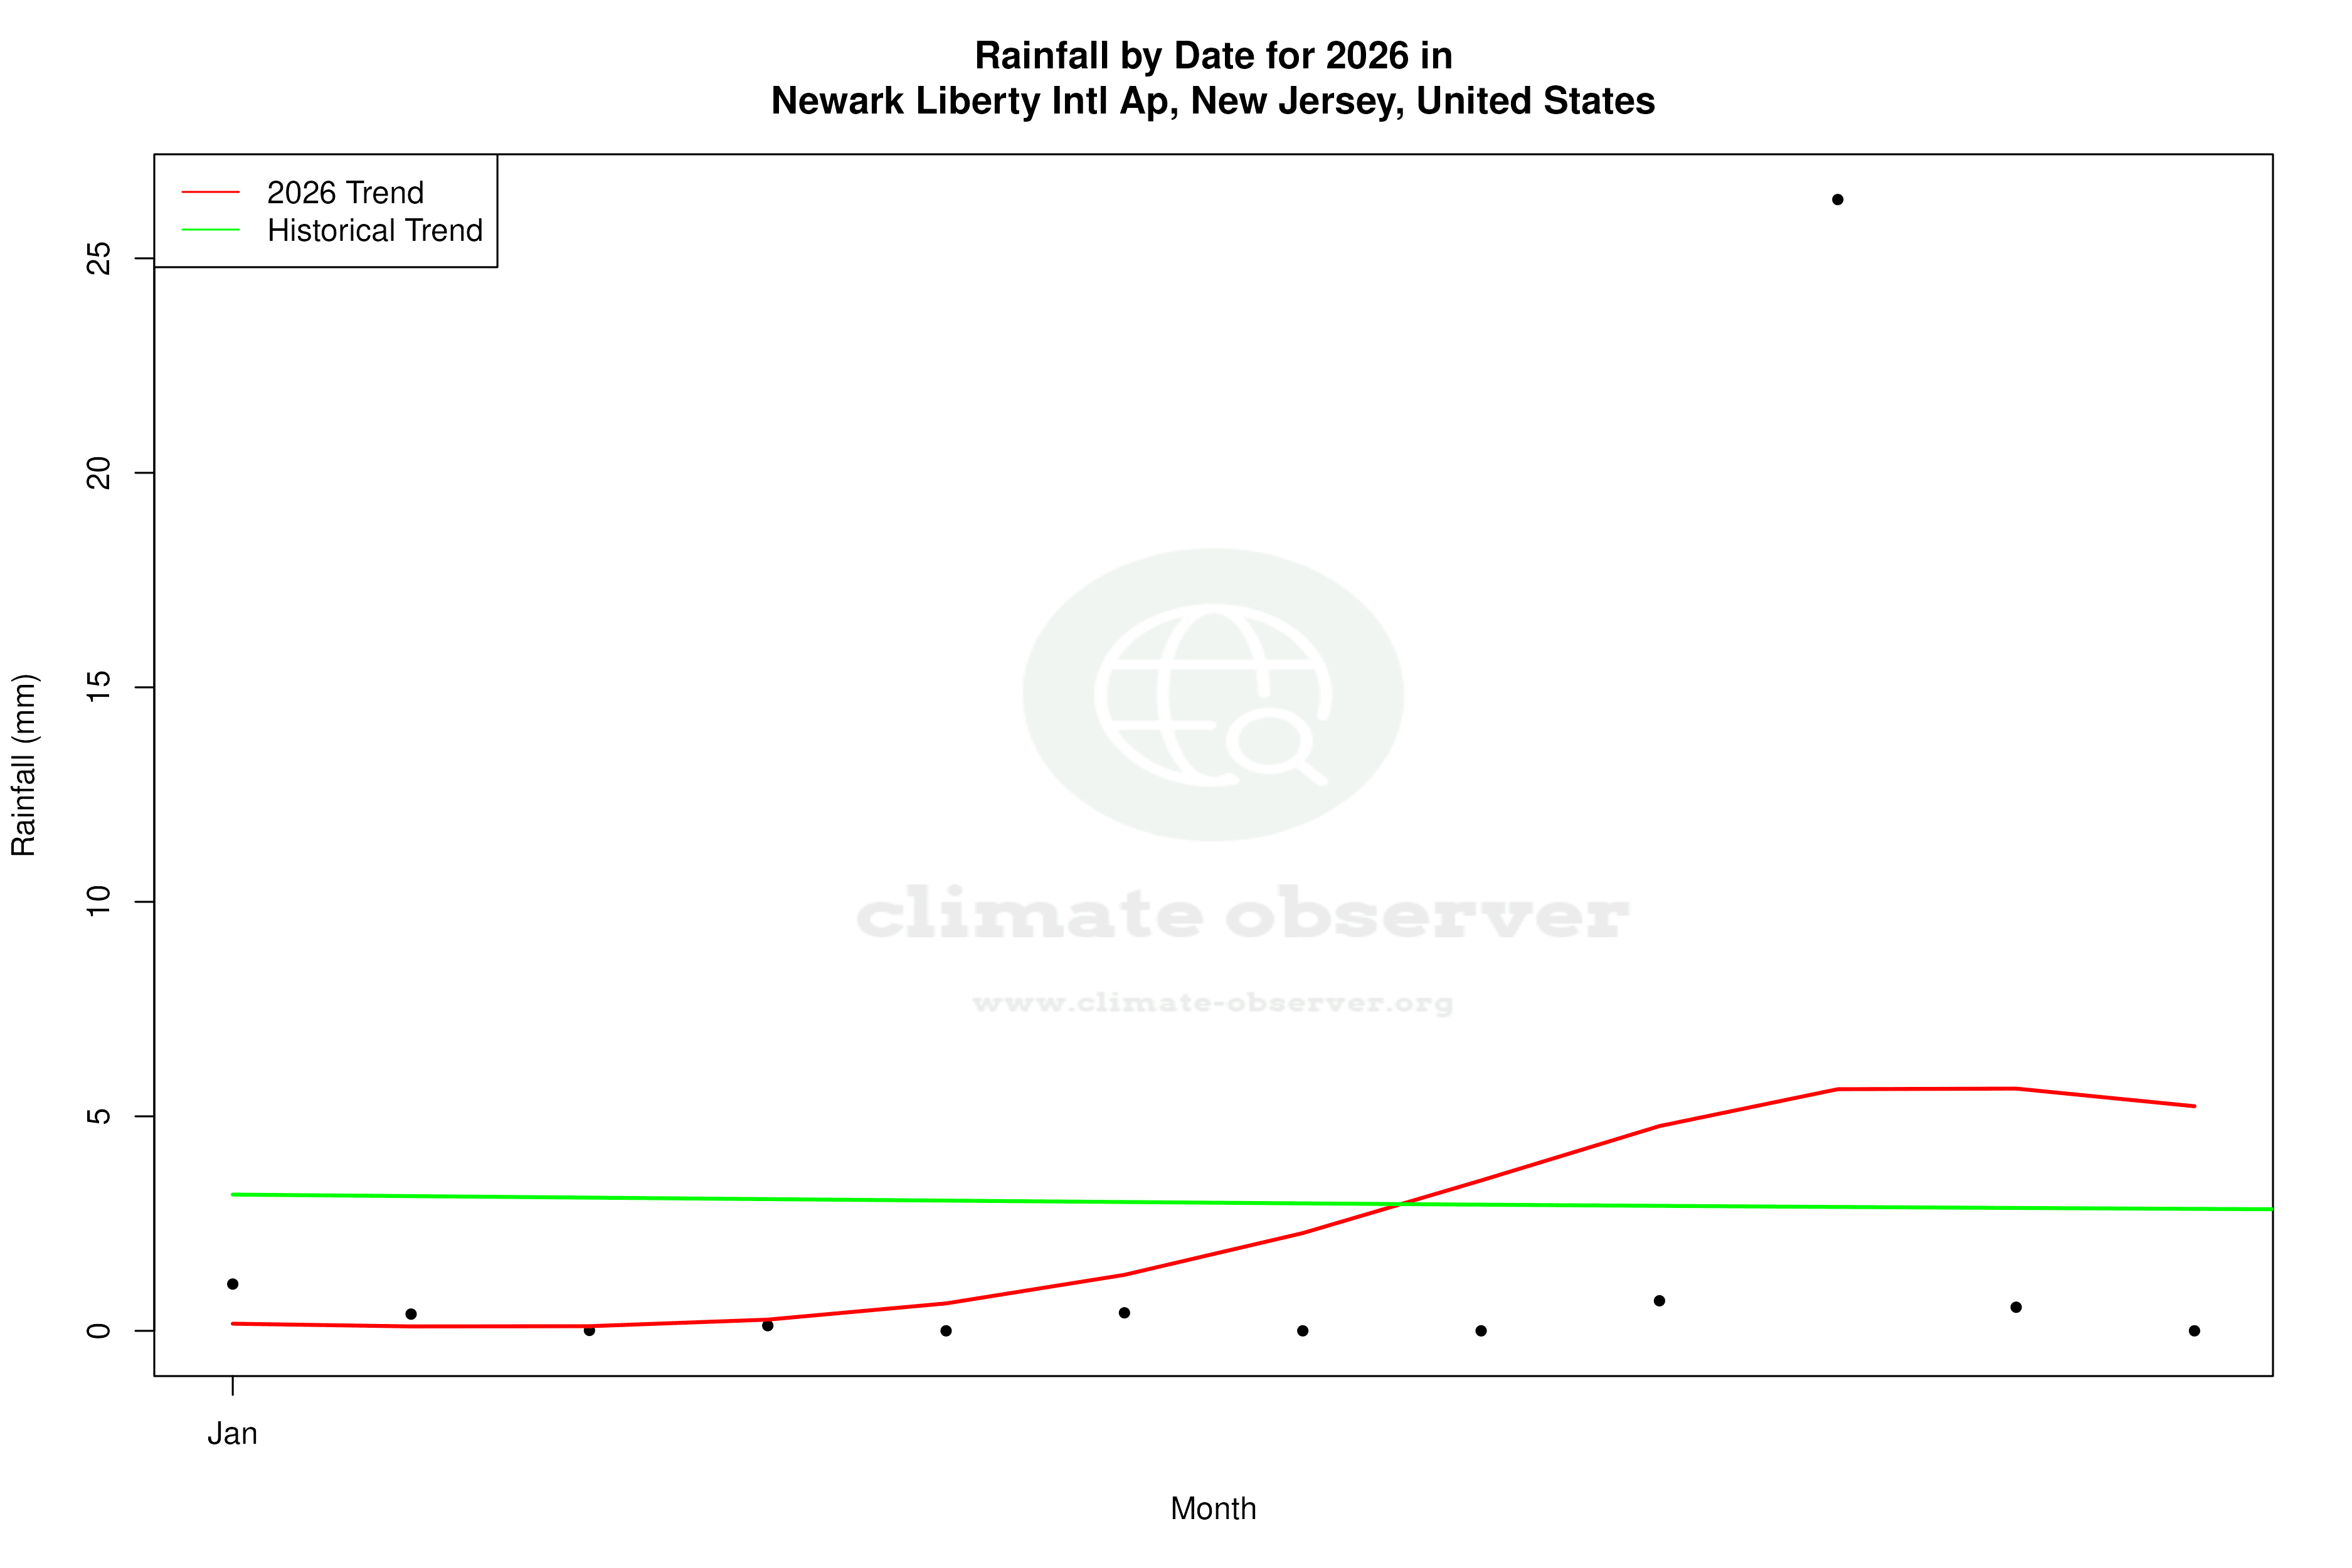
Precipitation Patterns: A More Even Distribution
The Precipitation Concentration Index (PCI), which measures the distribution of rainfall over time, has shown a decrease from a baseline of 11.8 to a current value of 10.8. This indicates a more even distribution of precipitation throughout the year, with less concentration in intense, isolated events. Such a shift can mitigate flooding risks and support water management strategies, aligning with regional climate adaptation goals.
Regional Implications and Goals
These climatic trends at Newark Liberty International Airport occur against the backdrop of the United States' broader climate objectives, which aim to reduce greenhouse gas emissions and enhance resilience to climate impacts. The observed warming and changes in precipitation patterns underscore the importance of these goals. Recent weather events, such as increased frequency of heatwaves and heavy rainfall, further emphasise the need for effective climate adaptation and mitigation strategies.
Station Statistics
10-Year Trend
High: +0.83 °F/decade
Low: +0.65 °F/decade
Rain: -0.012 in/decade
25-Year Trend
High: +1.01 °F/decade
Low: +0.89 °F/decade
Rain: +0.001 in/decade
50-Year Trend
High: +0.48 °F/decade
Low: +0.45 °F/decade
Rain: -0.000 in/decade
All-Time Trend
High: +0.36 °F/decade
Low: +0.29 °F/decade
Rain: +0.000 in/decade
Percentage Above-Average Days
Last 12 Months: 57.5%
This Year: 52.0%
Precipitation Concentration Index (PCI) ℹ️
Last 12 Months: 9.0
Historical Average: 10.8
Percentile Rank of Last 12 Months ℹ️
High: 83rd percentile
Low: 82nd percentile
Rain: 16th percentile
Change in Variance ℹ️
High: -5.6%
Low: -3.9%
Intraday: -10.5%
Data Coverage
77.8%
First Year of Data
1843
Station Location
Historical Weather Records
| Max High | Avg High | Min High | Max Avg | Avg Avg | Min Avg | Max Low | Avg Low | Min Low | Max Precipitation | Avg Precipitation | Max Snow | Avg Snow | |
|---|---|---|---|---|---|---|---|---|---|---|---|---|---|
| Record | 107.96 °F | — | -0.94 °F | 96.44 °F | — | -1.84 °F | 86.00 °F | — | -14.08 °F | 15.00 in | — | 25.91 in | — |
| January | 73.94 °F | 37.78 °F | -0.94 °F | 65.48 °F | 32.67 °F | -1.84 °F | 55.94 °F | 23.83 °F | -13.00 °F | 2.95 in | 0.11 in | 24.02 in | 0.27 in |
| February | 80.06 °F | 39.62 °F | 5.00 °F | 66.02 °F | 35.01 °F | 6.80 °F | 55.94 °F | 24.53 °F | -14.08 °F | 3.75 in | 0.11 in | 20.79 in | 0.34 in |
| March | 89.06 °F | 48.44 °F | 12.92 °F | 74.30 °F | 42.93 °F | 11.48 °F | 62.96 °F | 32.12 °F | 0.32 °F | 3.92 in | 0.12 in | 12.72 in | 0.17 in |
| April | 96.98 °F | 60.38 °F | 30.02 °F | 84.02 °F | 53.33 °F | 23.36 °F | 73.94 °F | 41.90 °F | 12.92 °F | 4.18 in | 0.12 in | 15.79 in | 0.03 in |
| May | 98.96 °F | 71.12 °F | 41.00 °F | 86.72 °F | 63.45 °F | 41.54 °F | 75.02 °F | 52.32 °F | 30.92 °F | 3.92 in | 0.13 in | 0.00 in | 0.00 in |
| June | 102.92 °F | 80.10 °F | 53.06 °F | 93.38 °F | 72.83 °F | 52.70 °F | 84.92 °F | 61.63 °F | 37.94 °F | 4.55 in | 0.12 in | 0.00 in | 0.00 in |
| July | 107.96 °F | 84.97 °F | 57.02 °F | 96.44 °F | 78.25 °F | 61.70 °F | 86.00 °F | 67.25 °F | 46.04 °F | 7.69 in | 0.14 in | 0.00 in | 0.00 in |
| August | 105.08 °F | 82.69 °F | 59.00 °F | 91.94 °F | 76.40 °F | 58.82 °F | 82.04 °F | 65.57 °F | 44.96 °F | 15.00 in | 0.14 in | 0.00 in | 0.00 in |
| September | 105.08 °F | 75.82 °F | 46.94 °F | 87.80 °F | 69.16 °F | 48.56 °F | 78.98 °F | 58.51 °F | 33.98 °F | 8.67 in | 0.12 in | 0.00 in | 0.00 in |
| October | 96.08 °F | 64.75 °F | 39.92 °F | 79.88 °F | 57.80 °F | 35.60 °F | 73.04 °F | 47.37 °F | 21.92 °F | 5.94 in | 0.11 in | 5.20 in | 0.00 in |
| November | 84.92 °F | 52.63 °F | 15.08 °F | 73.76 °F | 47.54 °F | 21.56 °F | 69.08 °F | 37.51 °F | 8.06 °F | 6.73 in | 0.11 in | 6.42 in | 0.03 in |
| December | 75.92 °F | 41.45 °F | 3.92 °F | 67.46 °F | 37.73 °F | 4.46 °F | 59.00 °F | 28.02 °F | -13.00 °F | 2.77 in | 0.12 in | 25.91 in | 0.20 in |
Data Visualisations
Remove WatermarksCurrent Year Climate Trends vs Historical

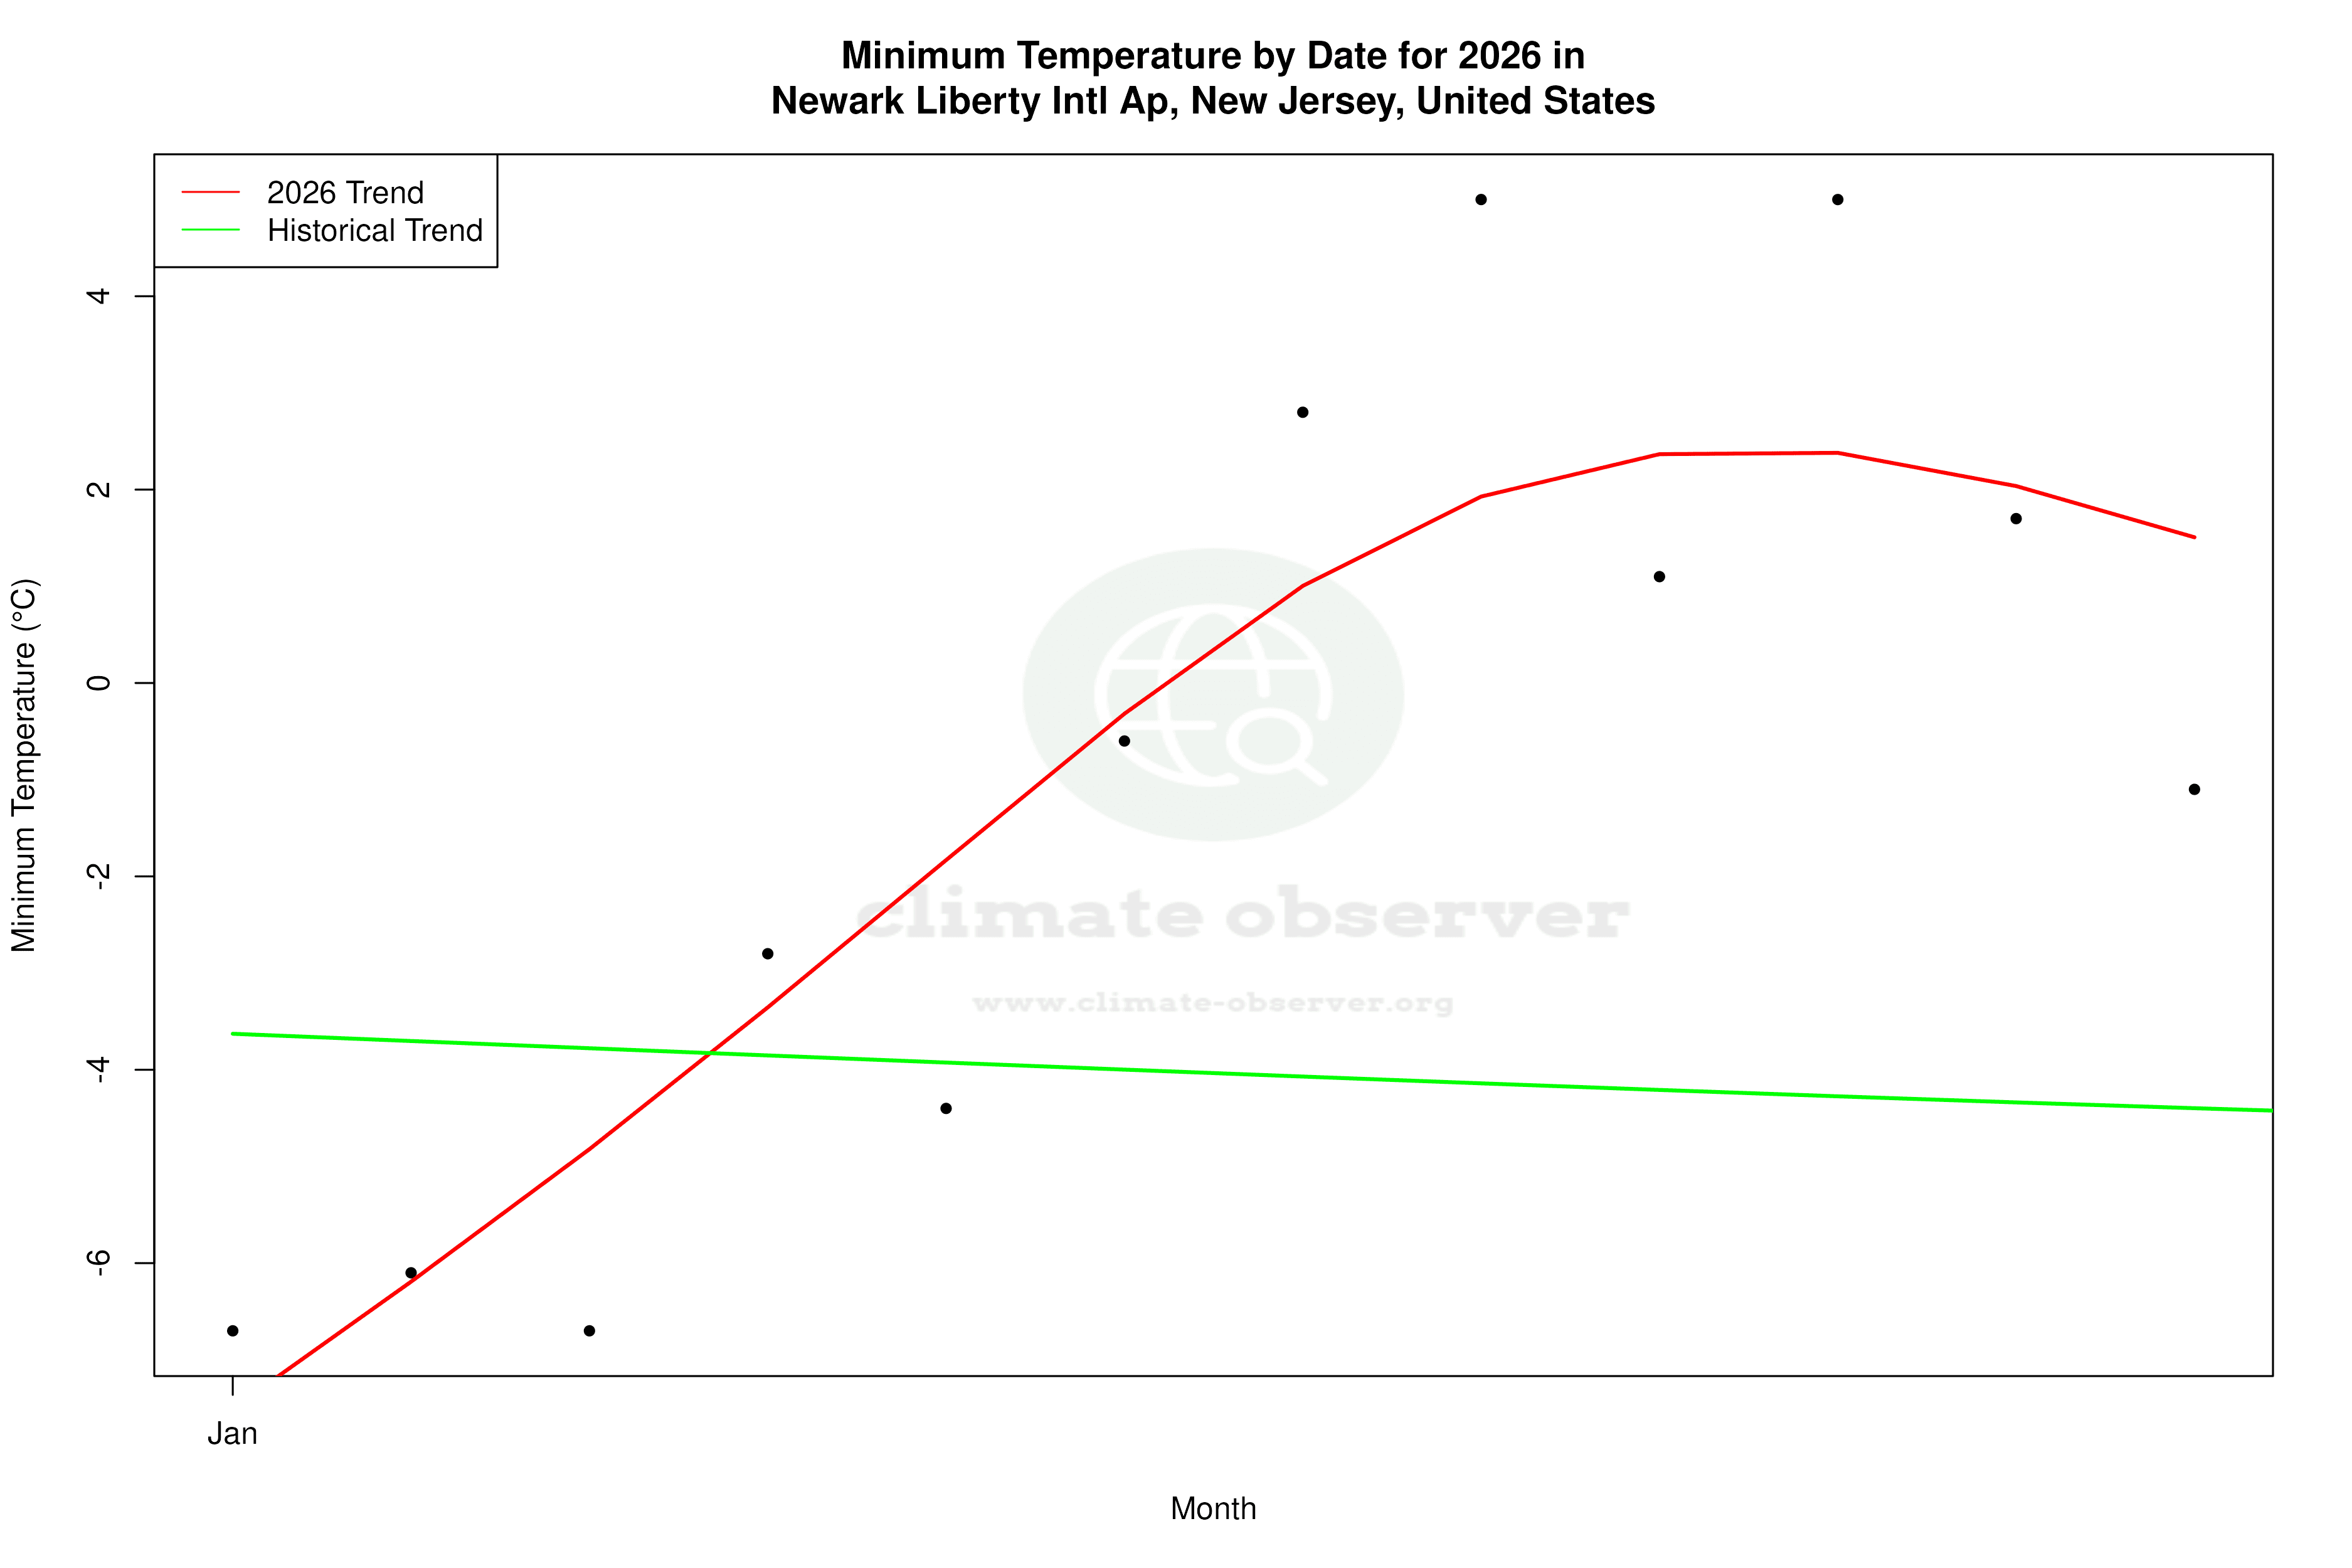


Max Temperature this Year | 1 of 6
Climate 12-Month Moving Averages
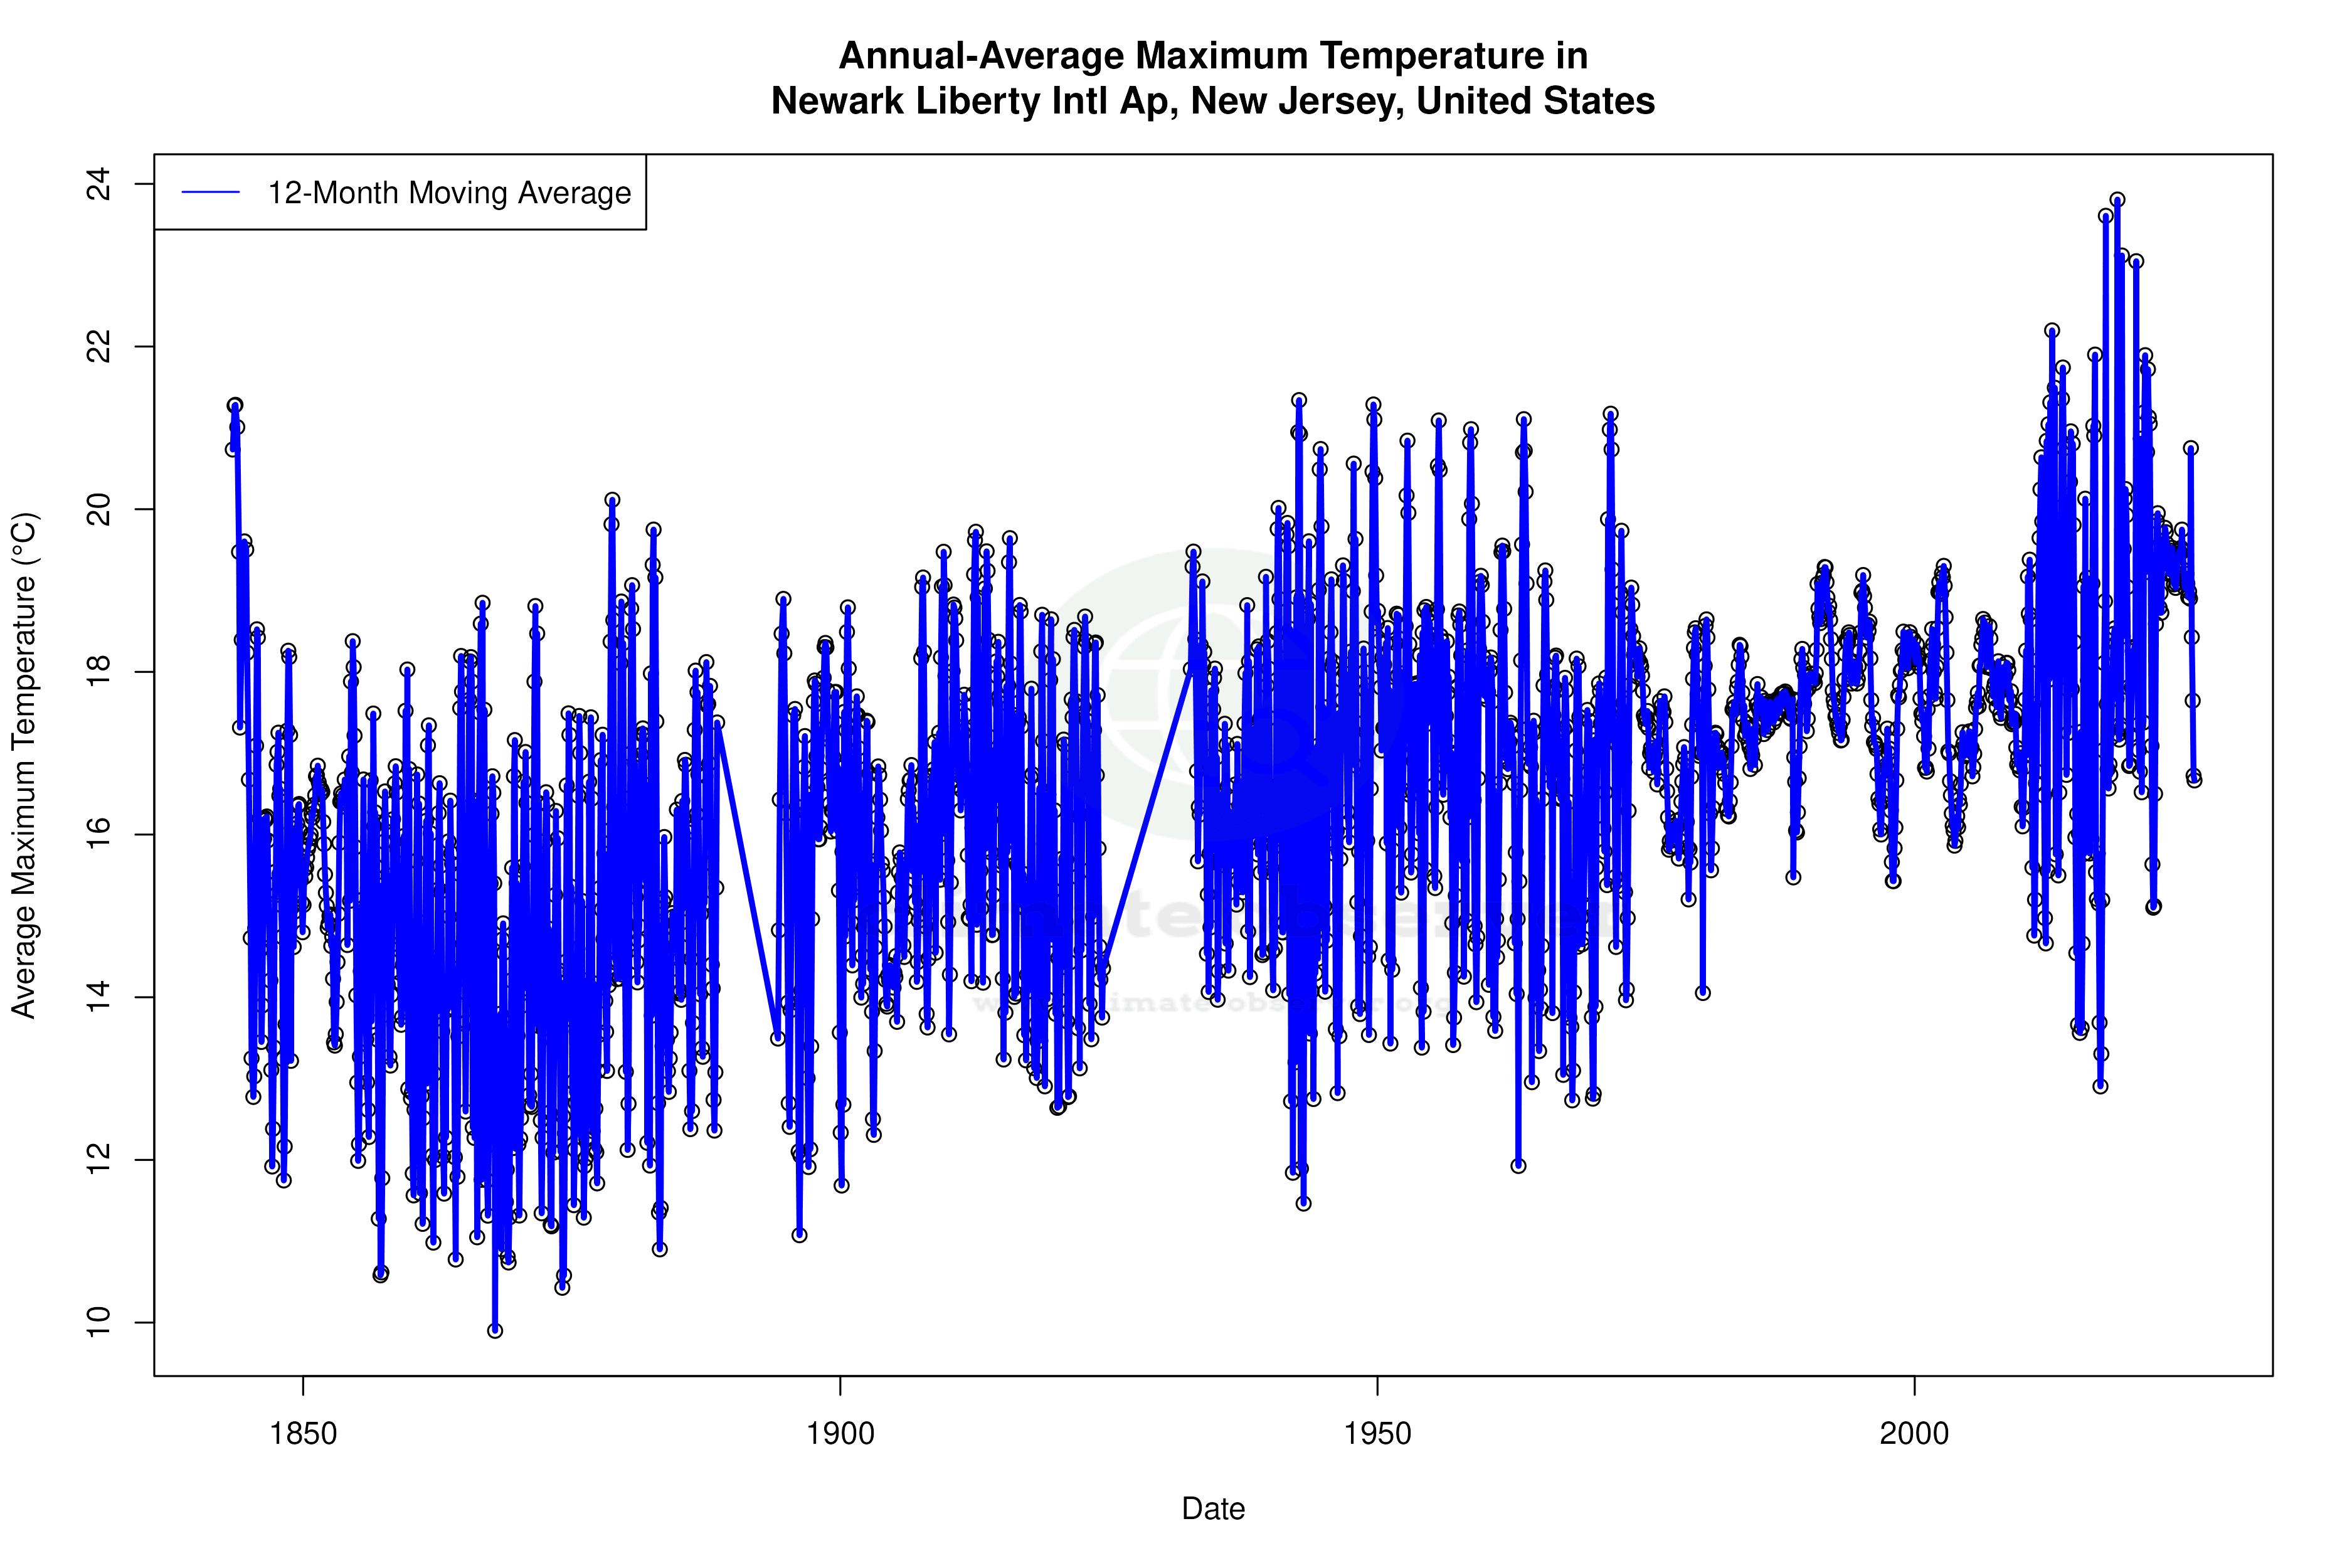


Max Temperature 12-Month MA | 1 of 6
Daily Data Points and Averages Throughout the Year


Average Max Temperature Throughout Year | 1 of 5
