Climate for Station: Marquette, Michigan, United States
Loading live weather...
Climate Analysis & Overview
Marquette, located along the shores of Lake Superior, is experiencing a warming trend, with notable increases in both high and low temperatures. The precipitation pattern has become more evenly distributed over the years, reflecting broader regional climate shifts.
Lake-Influenced Climate Dynamics
Marquette, Michigan, situated at 46.55°N, 87.38°W, is classified under the Köppen climate classification as a humid continental climate. This classification is characterised by large seasonal temperature differences, with warm to hot summers and cold winters. The proximity to Lake Superior plays a significant role in moderating temperatures and influencing precipitation patterns. The lake effect can lead to increased snowfall in winter, while also tempering summer heat.
Warming Trends and Temperature Shifts
Over the past decade, Marquette has seen a warming trend in both high and low temperatures. Highs have increased by 0.25°C (0.45°F), while lows have risen more significantly by 0.59°C (1.06°F). This recent trend aligns with the broader regional warming observed across the Great Lakes area. When considering all-time trends, the warming is more modest, with highs increasing by 0.06°C (0.11°F) and lows by 0.16°C (0.29°F). This long-term warming is consistent with global climate change patterns, although the rate of increase in lows is notably higher, suggesting milder winter nights.
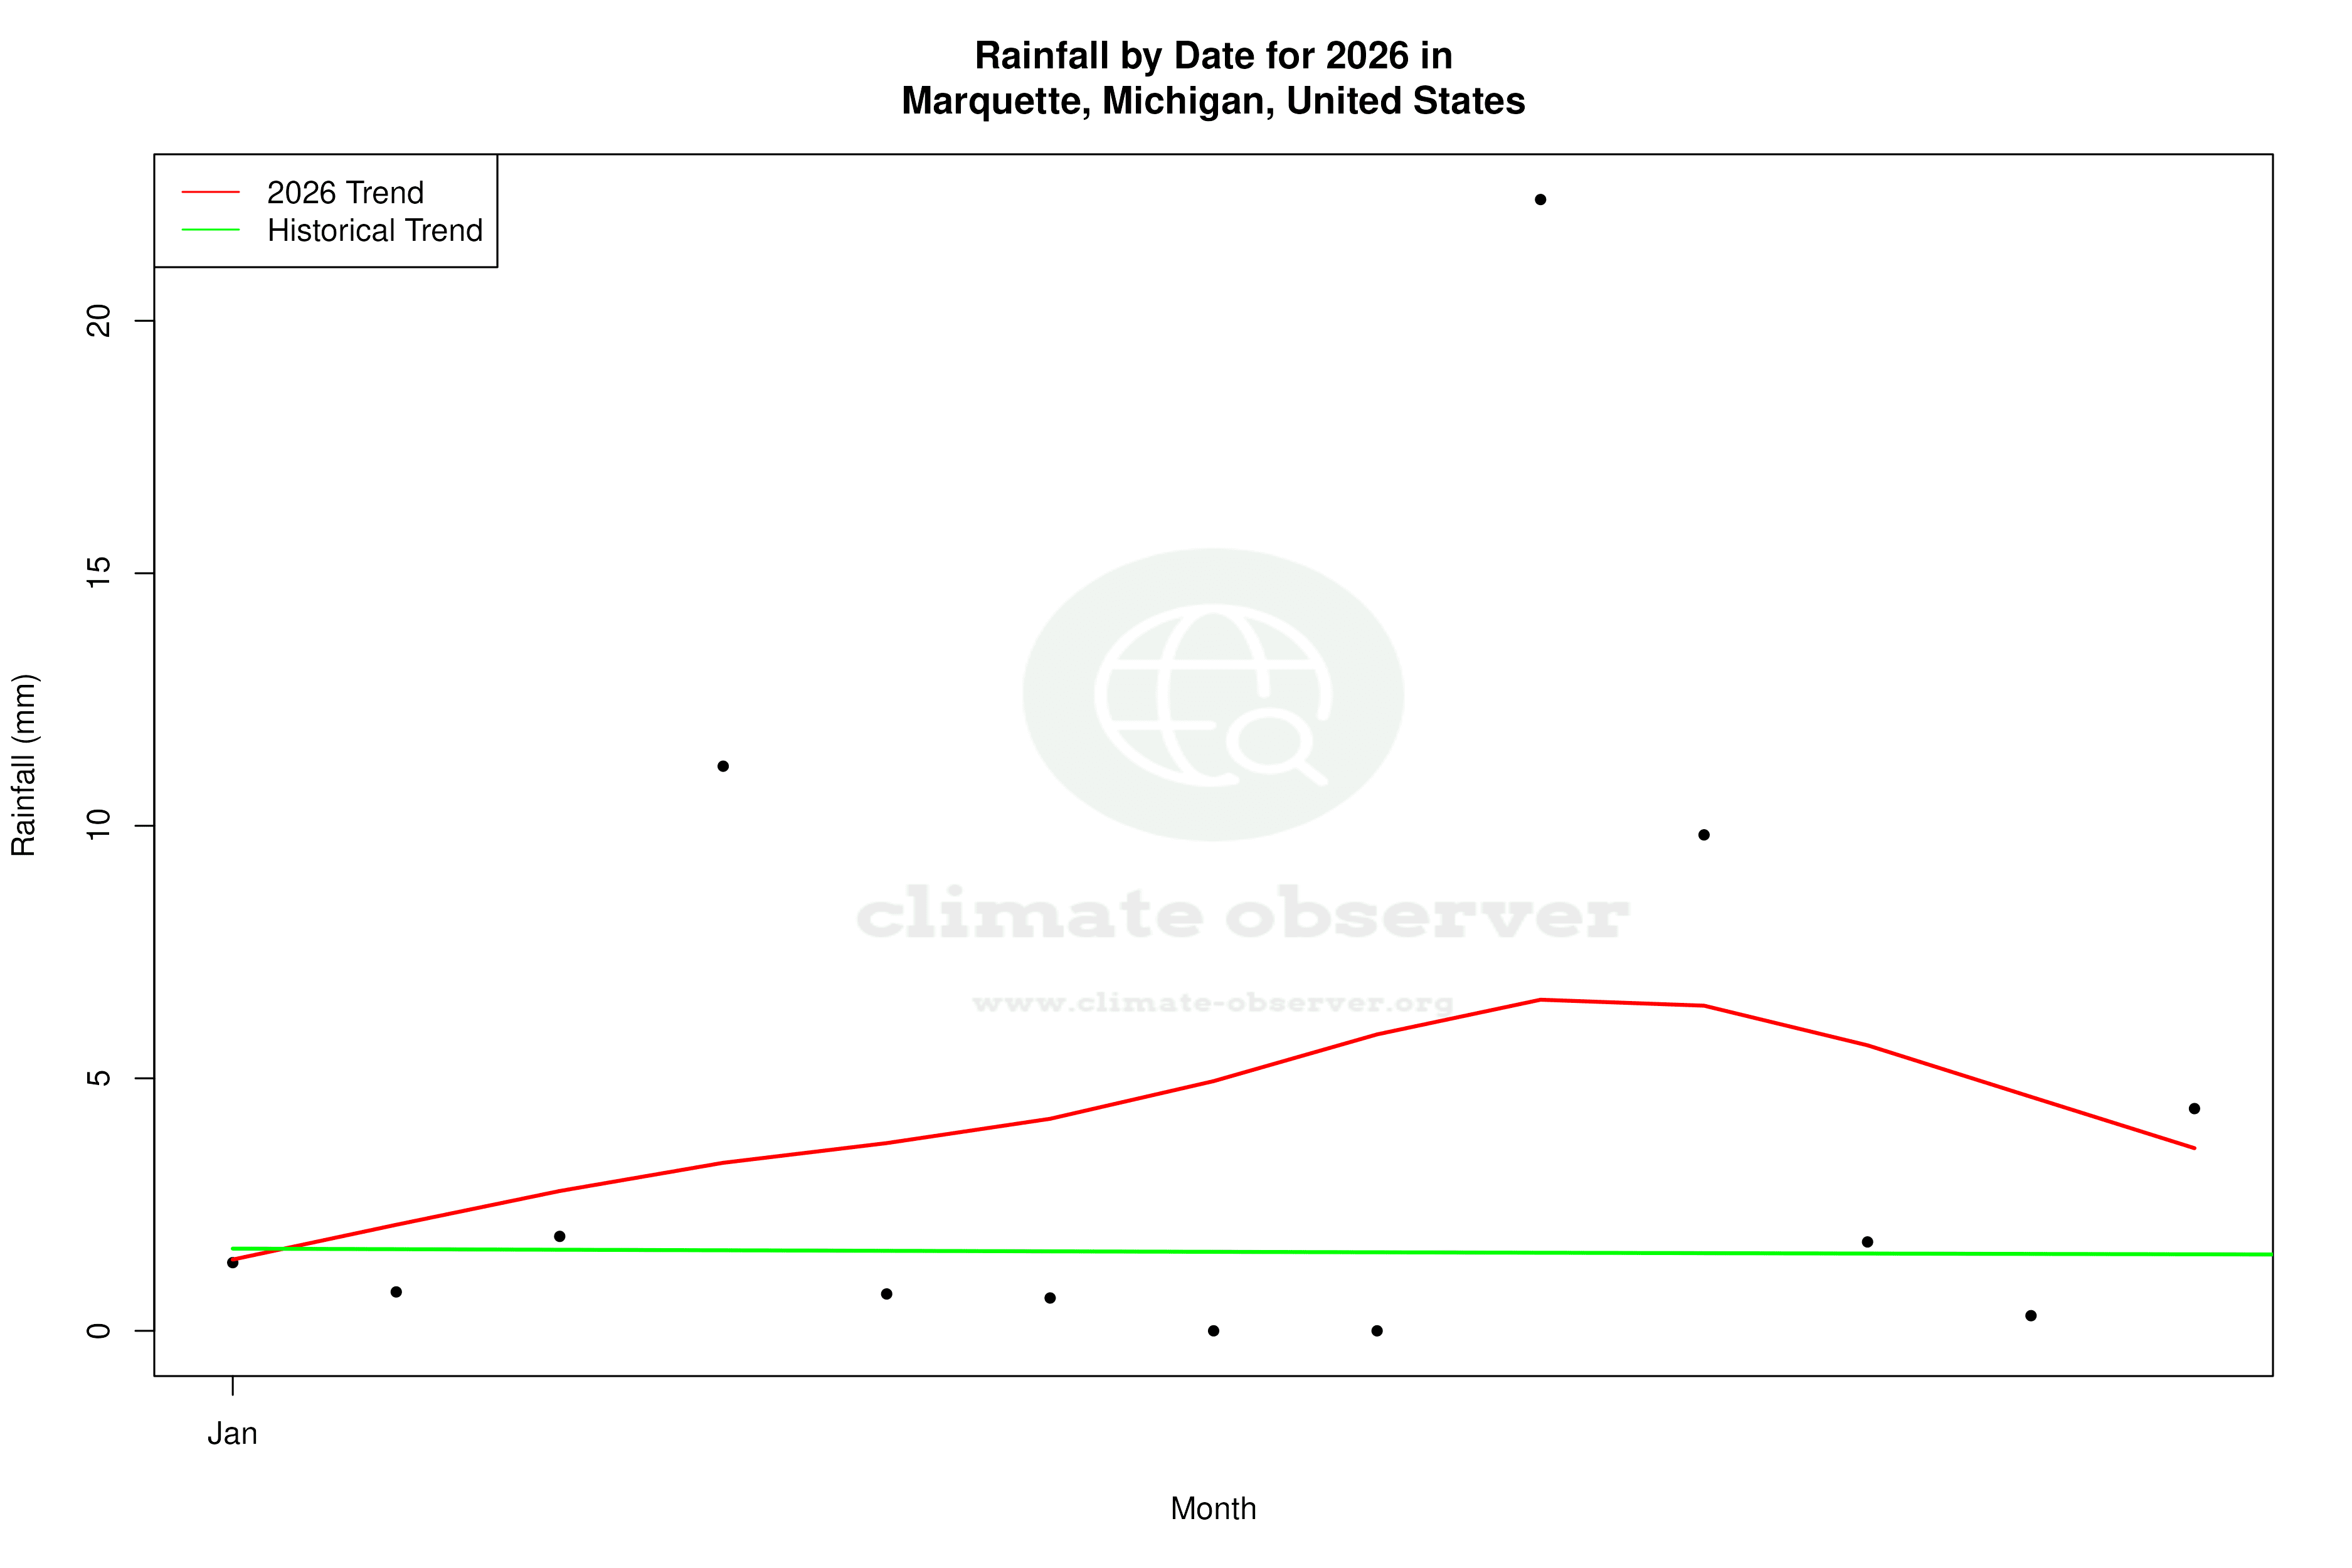
Precipitation Patterns and Distribution
The Precipitation Concentration Index (PCI) for Marquette has decreased from a baseline of 11.41 to a current value of 9.23. This indicates a more even distribution of precipitation events over time. In practical terms, this means that rainfall and snowfall are less likely to occur in intense, isolated events, and instead, precipitation is spread more evenly throughout the year. This trend towards even distribution is beneficial for water management and agriculture, reducing the risk of flooding and drought.
Temperature Extremes and Records
Marquette's climate records show an absolute maximum temperature of 40.0°C (104.0°F) and a minimum of -36.1°C (-33.0°F). These extremes highlight the significant variability inherent in the region's climate, influenced by both continental and maritime factors. Such variability underscores the importance of adaptive strategies in local infrastructure and community planning to mitigate the impacts of extreme weather events.
Regional Climate Context and Goals
In the context of the United States' regional climate goals, Marquette's warming trends and precipitation changes reflect broader efforts to understand and adapt to climate change. The regional focus includes enhancing resilience to climate impacts, promoting sustainable water management practices, and reducing greenhouse gas emissions. Recent weather events, such as increased frequency of heatwaves and altered precipitation patterns, underscore the urgency of these initiatives.
Station Statistics
10-Year Trend
High: +3.50 °F/decade
Low: +3.73 °F/decade
Rain: -0.007 in/decade
25-Year Trend
High: -0.45 °F/decade
Low: -0.04 °F/decade
Rain: +0.003 in/decade
50-Year Trend
High: -0.10 °F/decade
Low: +0.77 °F/decade
Rain: +0.000 in/decade
All-Time Trend
High: +0.09 °F/decade
Low: +0.27 °F/decade
Rain: -0.000 in/decade
Percentage Above-Average Days
Last 12 Months: 49.6%
This Year: 41.4%
Precipitation Concentration Index (PCI) ℹ️
Last 12 Months: 9.3
Historical Average: 10.8
Percentile Rank of Last 12 Months ℹ️
High: 79th percentile
Low: 90th percentile
Rain: 71st percentile
Change in Variance ℹ️
High: -5.0%
Low: -5.9%
Intraday: -15.9%
Data Coverage
49.9%
First Year of Data
1857
Station Location
Historical Weather Records
| Max High | Avg High | Min High | Max Avg | Avg Avg | Min Avg | Max Low | Avg Low | Min Low | Max Precipitation | Avg Precipitation | Max Snow | Avg Snow | |
|---|---|---|---|---|---|---|---|---|---|---|---|---|---|
| Record | 104.00 °F | — | -14.98 °F | 83.66 °F | — | -20.92 °F | 78.98 °F | — | -32.98 °F | 4.44 in | — | 17.99 in | — |
| January | 55.94 °F | 24.97 °F | -9.04 °F | 36.14 °F | 16.91 °F | -18.04 °F | 37.94 °F | 11.81 °F | -25.96 °F | 1.53 in | 0.06 in | 13.58 in | 0.83 in |
| February | 62.06 °F | 27.13 °F | -14.98 °F | 45.68 °F | 17.94 °F | -20.92 °F | 41.00 °F | 12.31 °F | -32.98 °F | 1.38 in | 0.05 in | 17.99 in | 0.79 in |
| March | 82.04 °F | 34.88 °F | -4.00 °F | 60.80 °F | 26.40 °F | -9.40 °F | 48.92 °F | 19.89 °F | -18.94 °F | 1.45 in | 0.06 in | 17.28 in | 0.58 in |
| April | 91.04 °F | 47.00 °F | 17.96 °F | 74.30 °F | 37.50 °F | 13.46 °F | 60.08 °F | 31.44 °F | -0.04 °F | 1.88 in | 0.09 in | 17.99 in | 0.29 in |
| May | 100.04 °F | 59.22 °F | 30.02 °F | 73.76 °F | 49.17 °F | 27.14 °F | 73.94 °F | 40.79 °F | 16.16 °F | 2.62 in | 0.09 in | 10.59 in | 0.03 in |
| June | 100.94 °F | 68.96 °F | 41.00 °F | 82.22 °F | 58.55 °F | 39.11 °F | 73.94 °F | 50.01 °F | 28.94 °F | 2.23 in | 0.11 in | 2.01 in | 0.00 in |
| July | 104.00 °F | 75.11 °F | 48.92 °F | 83.66 °F | 64.28 °F | 46.26 °F | 77.00 °F | 57.31 °F | 35.96 °F | 4.13 in | 0.10 in | 0.00 in | 0.00 in |
| August | 100.94 °F | 73.78 °F | 51.08 °F | 80.96 °F | 63.74 °F | 46.04 °F | 78.98 °F | 57.27 °F | 33.08 °F | 2.85 in | 0.09 in | 0.00 in | 0.00 in |
| September | 96.98 °F | 66.58 °F | 42.08 °F | 78.44 °F | 56.82 °F | 33.98 °F | 75.02 °F | 50.36 °F | 28.04 °F | 4.44 in | 0.12 in | 4.41 in | 0.00 in |
| October | 87.08 °F | 54.86 °F | 24.98 °F | 71.60 °F | 44.98 °F | 24.44 °F | 69.08 °F | 40.32 °F | 12.56 °F | 4.06 in | 0.10 in | 14.02 in | 0.07 in |
| November | 77.00 °F | 40.35 °F | 6.08 °F | 58.82 °F | 32.86 °F | 5.90 °F | 57.92 °F | 28.62 °F | -5.98 °F | 1.95 in | 0.09 in | 12.99 in | 0.47 in |
| December | 60.08 °F | 29.87 °F | -11.02 °F | 43.81 °F | 22.26 °F | -11.02 °F | 44.96 °F | 18.17 °F | -20.02 °F | 1.65 in | 0.06 in | 14.29 in | 0.77 in |
Data Visualisations
Remove WatermarksCurrent Year Climate Trends vs Historical


Max Temperature this Year | 1 of 6
Climate 12-Month Moving Averages


Max Temperature 12-Month MA | 1 of 6
Daily Data Points and Averages Throughout the Year


Average Max Temperature Throughout Year | 1 of 5
