Climate for Station: Long Beach Daugherty Ap, California, United States
Loading live weather...
Climate Analysis & Overview
Long Beach Daugherty Ap is experiencing a nuanced climate narrative, with a slight all-time warming trend juxtaposed against a recent cooling over the past decade. Precipitation patterns have shifted towards more even distribution, reflecting a complex interplay of regional climate dynamics.
Coastal Climate Dynamics
Situated at 33.8117°N, 118.1472°W, Long Beach Daugherty Ap is enveloped by a Mediterranean climate, characterised by mild, wet winters and hot, dry summers. The proximity to the Pacific Ocean plays a pivotal role, moderating temperatures and influencing precipitation patterns. This coastal influence is evident in the station's climate data, where long-term trends reveal a slight warming, with all-time highs increasing by 0.21°C (0.38°F) and lows by 0.34°C (0.61°F). These subtle shifts suggest a gradual rise in baseline temperatures, aligning with broader regional climate goals to monitor and adapt to climate change.
Decadal Cooling Anomaly
Despite the long-term warming, the past decade tells a different story. High temperatures have decreased by 1.27°C (2.28°F), while lows have fallen by 0.64°C (1.16°F). This recent cooling trend could be attributed to various factors, including changes in oceanic currents or atmospheric conditions that have temporarily offset the overarching warming pattern. Such anomalies are crucial for understanding the variability inherent in climate systems and underscore the importance of continuous monitoring.
Temperature Extremes
The station has recorded a maximum temperature of 43.9°C (111.0°F) and a minimum of -3.9°C (25.0°F), reflecting the potential for significant thermal extremes despite the generally moderate climate. These records highlight the station's capacity for variability, which can have implications for local ecosystems and human activities.
Shifts in Precipitation Patterns
The Precipitation Concentration Index (PCI) at Long Beach Daugherty Ap has decreased from a baseline of 26.4 to a current value of 21.9. This indicates a more even distribution of rainfall events compared to the past, where precipitation was more concentrated in fewer, intense events. A PCI over 20 still suggests a high concentration, but the shift towards a more even pattern could influence water management strategies and agricultural practices in the region.
Regional Climate Implications
The climate data from Long Beach Daugherty Ap offers insights into the broader climatic shifts occurring along the Californian coast. The slight all-time warming trend aligns with global patterns of climate change, while the recent cooling anomaly provides a counterpoint that highlights the complexity of regional climate systems. As California continues to grapple with climate-related challenges, such as drought and wildfire risks, understanding these localised trends is essential for developing adaptive strategies and meeting regional climate goals.
Station Statistics
10-Year Trend
High: -1.81 °F/decade
Low: -0.48 °F/decade
Rain: +0.011 in/decade
25-Year Trend
High: +1.08 °F/decade
Low: +1.15 °F/decade
Rain: +0.003 in/decade
50-Year Trend
High: +0.01 °F/decade
Low: +0.40 °F/decade
Rain: -0.002 in/decade
All-Time Trend
High: +0.37 °F/decade
Low: +0.59 °F/decade
Rain: +0.001 in/decade
Percentage Above-Average Days
Last 12 Months: 59.2%
This Year: 65.8%
Precipitation Concentration Index (PCI) ℹ️
Last 12 Months: 19.1
Historical Average: 28.3
Percentile Rank of Last 12 Months ℹ️
High: 61st percentile
Low: 88th percentile
Rain: 50th percentile
Change in Variance ℹ️
High: -1.1%
Low: -8.7%
Intraday: -6.5%
Data Coverage
95.2%
First Year of Data
1943
Station Location
Historical Weather Records
| Max High | Avg High | Min High | Max Avg | Avg Avg | Min Avg | Max Low | Avg Low | Min Low | Max Precipitation | Avg Precipitation | Max Snow | Avg Snow | |
|---|---|---|---|---|---|---|---|---|---|---|---|---|---|
| Record | 111.02 °F | — | 46.04 °F | 91.04 °F | — | 34.72 °F | 78.08 °F | — | 24.98 °F | 5.02 in | — | 0.00 in | — |
| January | 93.02 °F | 66.62 °F | 46.04 °F | 73.94 °F | 54.82 °F | 36.72 °F | 62.06 °F | 45.53 °F | 24.98 °F | 5.02 in | 0.09 in | 0.00 in | 0.00 in |
| February | 91.94 °F | 67.03 °F | 48.92 °F | 73.04 °F | 56.02 °F | 36.01 °F | 62.06 °F | 47.23 °F | 32.36 °F | 2.78 in | 0.09 in | 0.00 in | 0.00 in |
| March | 98.96 °F | 68.18 °F | 51.98 °F | 77.54 °F | 57.88 °F | 41.85 °F | 64.94 °F | 49.74 °F | 33.08 °F | 2.56 in | 0.05 in | 0.00 in | 0.00 in |
| April | 105.08 °F | 71.18 °F | 53.06 °F | 82.04 °F | 60.82 °F | 47.71 °F | 66.92 °F | 52.59 °F | 37.94 °F | 1.23 in | 0.02 in | 0.00 in | 0.00 in |
| May | 98.96 °F | 72.80 °F | 59.36 °F | 80.69 °F | 63.60 °F | 50.90 °F | 66.92 °F | 56.70 °F | 39.92 °F | 2.03 in | 0.01 in | 0.00 in | 0.00 in |
| June | 107.96 °F | 76.46 °F | 62.96 °F | 87.89 °F | 67.25 °F | 54.27 °F | 71.06 °F | 60.10 °F | 46.94 °F | 0.77 in | 0.00 in | 0.00 in | 0.00 in |
| July | 109.04 °F | 81.82 °F | 66.92 °F | 85.69 °F | 71.23 °F | 61.88 °F | 73.94 °F | 63.61 °F | 51.08 °F | 0.45 in | 0.00 in | 0.00 in | 0.00 in |
| August | 105.08 °F | 83.24 °F | 66.02 °F | 89.96 °F | 72.17 °F | 62.60 °F | 77.00 °F | 64.43 °F | 51.08 °F | 2.44 in | 0.00 in | 0.00 in | 0.00 in |
| September | 111.02 °F | 82.04 °F | 62.06 °F | 91.04 °F | 70.97 °F | 58.37 °F | 78.08 °F | 62.80 °F | 46.40 °F | 1.21 in | 0.01 in | 0.00 in | 0.00 in |
| October | 111.02 °F | 77.60 °F | 60.98 °F | 90.14 °F | 66.45 °F | 51.62 °F | 75.92 °F | 57.87 °F | 39.02 °F | 1.57 in | 0.01 in | 0.00 in | 0.00 in |
| November | 100.94 °F | 72.33 °F | 46.94 °F | 78.80 °F | 60.14 °F | 44.02 °F | 64.40 °F | 50.68 °F | 33.98 °F | 2.03 in | 0.04 in | 0.00 in | 0.00 in |
| December | 91.94 °F | 66.99 °F | 50.00 °F | 69.62 °F | 55.16 °F | 34.72 °F | 62.06 °F | 45.84 °F | 28.04 °F | 3.17 in | 0.06 in | 0.00 in | 0.00 in |
Data Visualisations
Remove WatermarksCurrent Year Climate Trends vs Historical


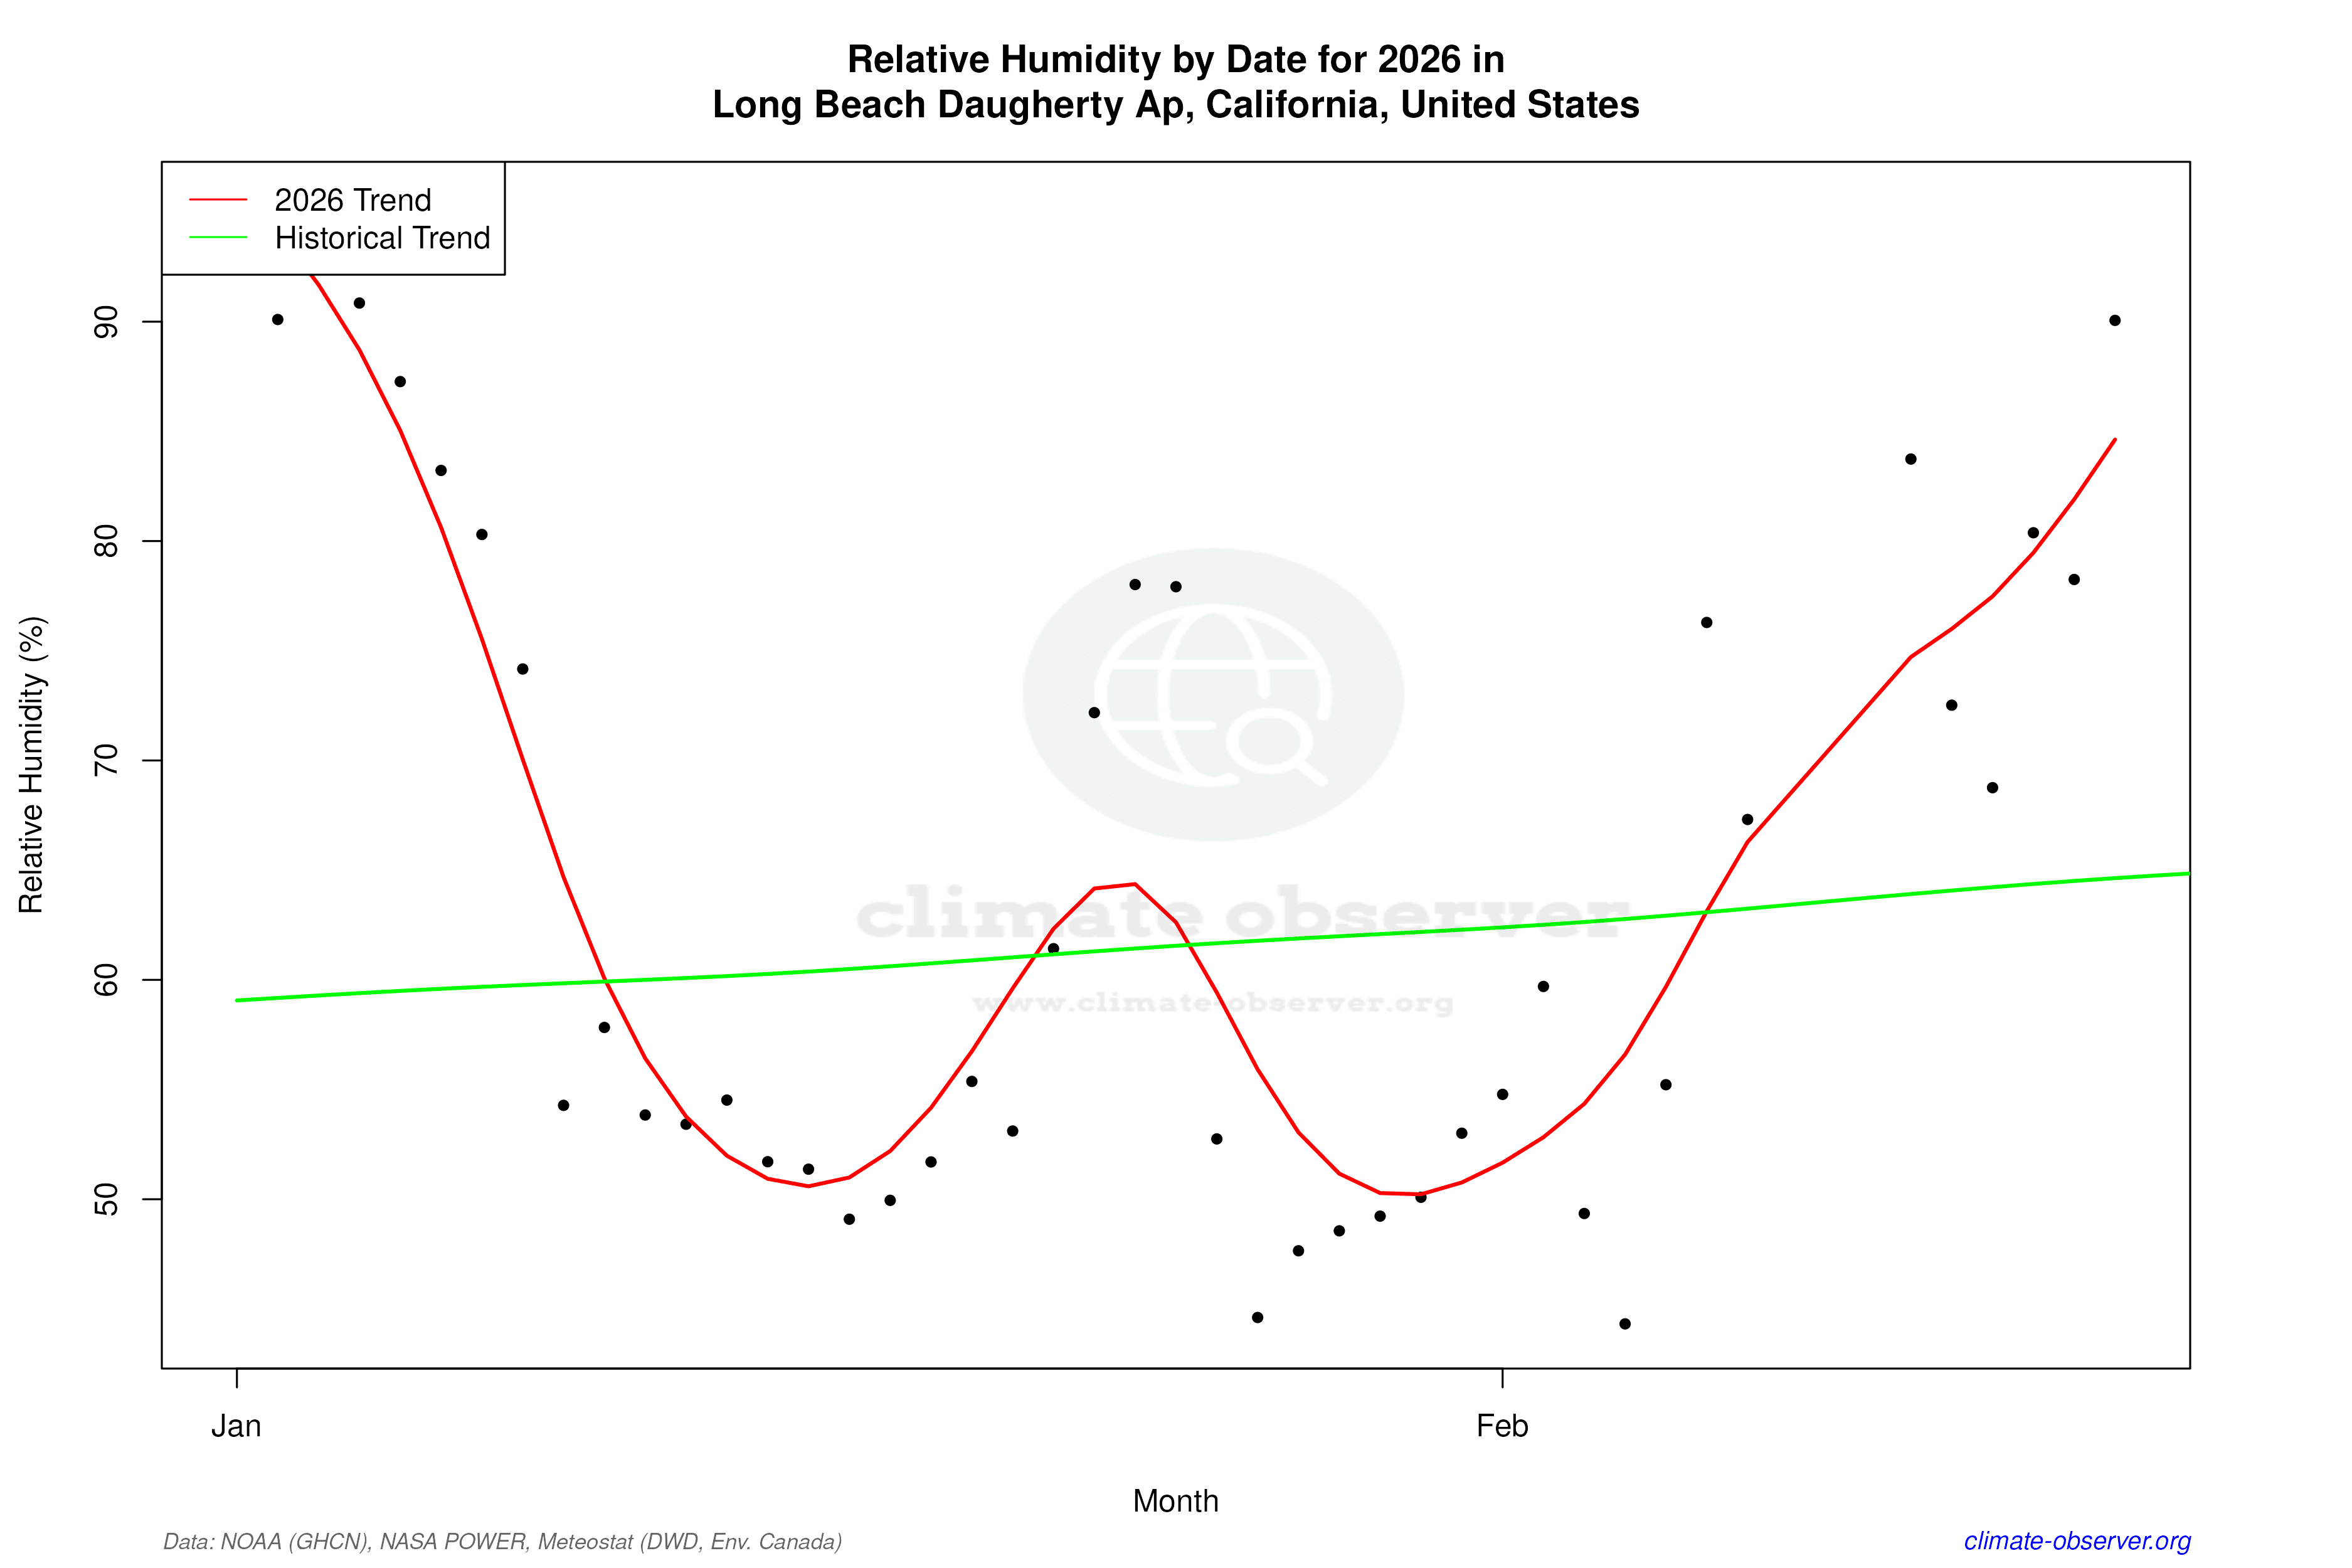

Max Temperature this Year | 1 of 6
Climate 12-Month Moving Averages


Max Temperature 12-Month MA | 1 of 6
Daily Data Points and Averages Throughout the Year


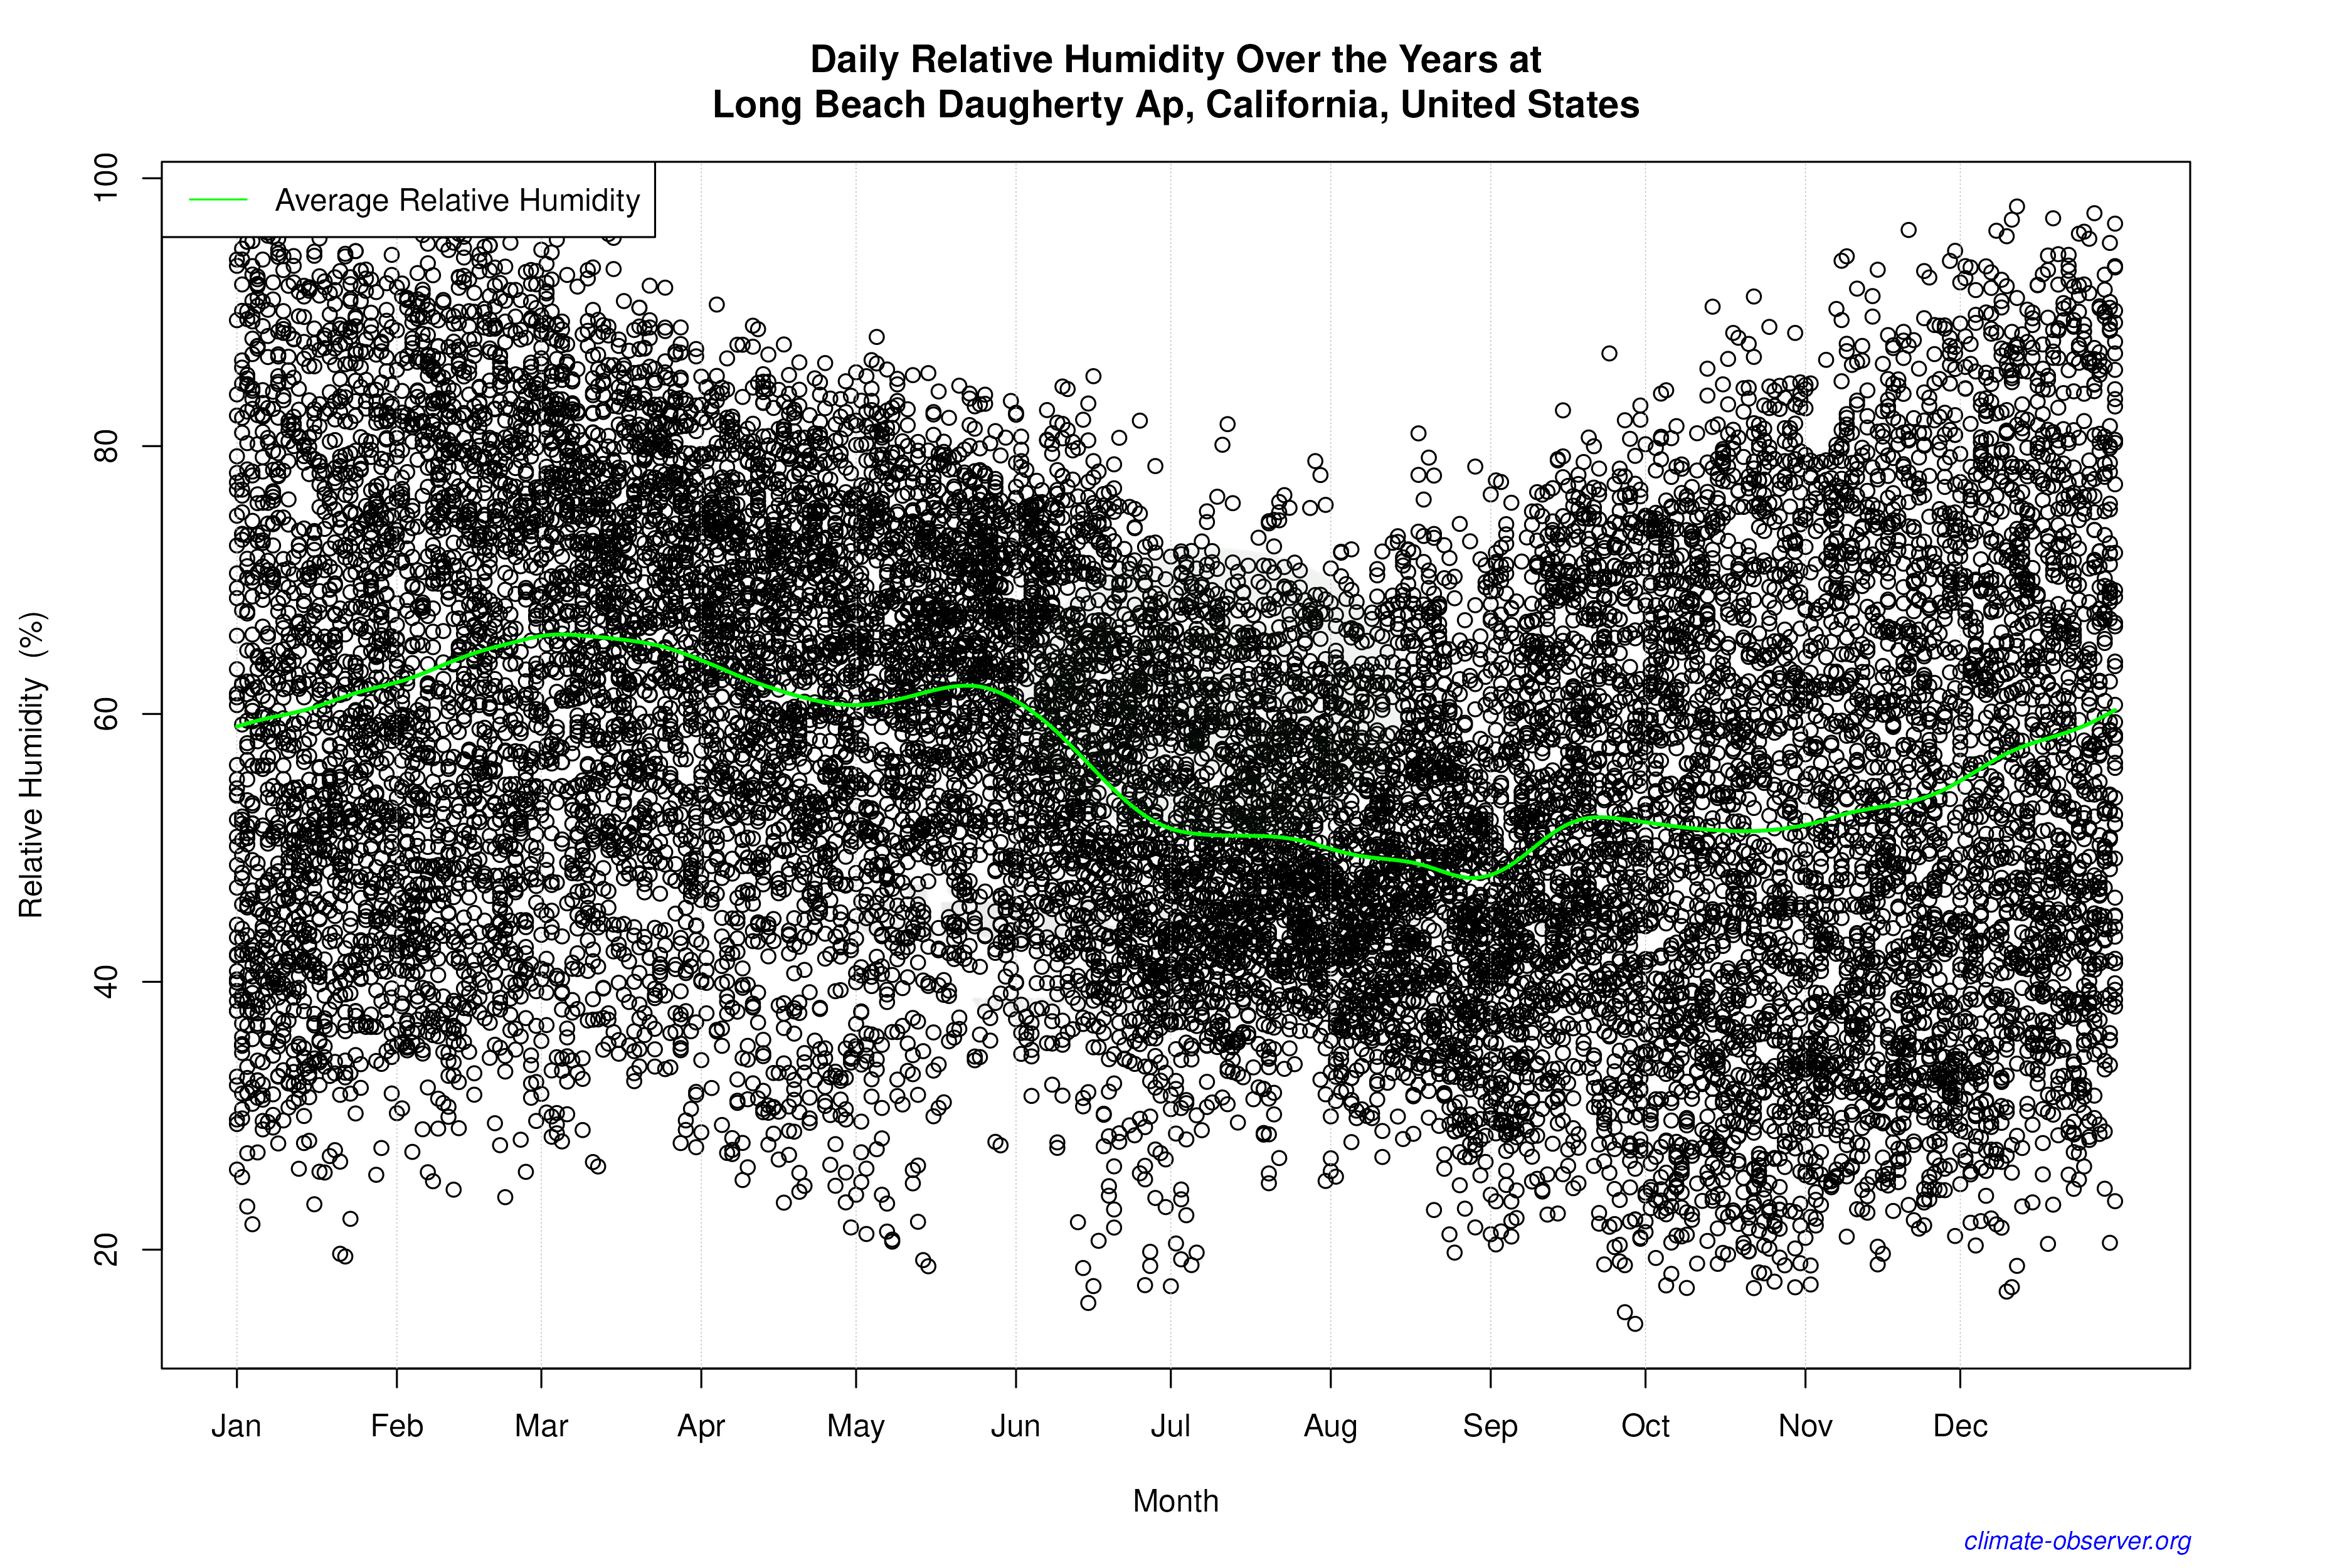

Average Max Temperature Throughout Year | 1 of 5
