Climate for Station: Phoenix Ap, Arizona, United States
Loading live weather...
Climate Analysis & Overview
Phoenix Sky Harbor International Airport has experienced a notable warming trend over the past decade, with high temperatures rising by 1.08°C (1.94°F) and lows by 0.87°C (1.57°F). The all-time data shows a more moderate warming, with highs increasing by 0.26°C (0.47°F). Precipitation patterns have become more evenly distributed, as indicated by a decrease in the Precipitation Concentration Index from 18.04 to 13.96.
Desert Climate Dynamics
Phoenix Sky Harbor International Airport is situated in a region classified under the Köppen climate system as a hot desert climate (BWh). This classification reflects the arid conditions typical of the area, with minimal rainfall and high temperatures. The surrounding Sonoran Desert and the absence of significant bodies of water or mountain ranges nearby contribute to the extreme thermal conditions observed. The airport's location in the heart of the desert amplifies temperature extremes, leading to a record high of 50.0°C (122.0°F) and a record low of -8.3°C (17.1°F).
Temperature Trends: A Decadal Perspective
Over the last decade, Phoenix has seen a substantial warming trend, with high temperatures increasing by 1.08°C (1.94°F) and low temperatures by 0.87°C (1.57°F). This suggests a significant rise in both daytime and nighttime temperatures, likely influenced by urban heat island effects and broader climatic shifts. The 10-year trend highlights the urgency for regional climate initiatives, aligning with the United States' goals to mitigate the impact of rising temperatures through sustainable urban planning and energy efficiency measures.
All-Time Temperature Changes
While the decadal trends indicate a rapid warming, the all-time data presents a more gradual increase in temperatures. Highs have risen by 0.26°C (0.47°F), while lows have shown a more pronounced increase of 0.84°C (1.51°F). This long-term warming trend underscores the persistent impact of climate change on the region, necessitating continued monitoring and adaptation strategies to address the challenges posed by increasing temperatures.
Precipitation Patterns: A Shift Towards Even Distribution
The Precipitation Concentration Index (PCI) is a metric that measures how rainfall is distributed over time. A decrease in PCI from 18.04 to 13.96 indicates a shift towards more evenly distributed precipitation events. This change suggests that while the overall amount of rainfall may not have increased significantly, the distribution has become less concentrated, potentially reducing the risk of flash floods and promoting more sustainable water management practices in this arid region.
Implications for Urban Planning
The warming trends and changes in precipitation distribution have significant implications for urban planning in Phoenix. The increase in nighttime temperatures, as indicated by both decadal and all-time trends, may exacerbate the urban heat island effect, impacting energy consumption and public health. As such, city planners and policymakers must prioritise strategies to mitigate heat, such as increasing green spaces and improving building insulation, to enhance the resilience of the city's infrastructure and its inhabitants.
Station Statistics
10-Year Trend
High: +2.30 °F/decade
Low: +2.06 °F/decade
Rain: -0.005 in/decade
25-Year Trend
High: +0.95 °F/decade
Low: +0.71 °F/decade
Rain: -0.001 in/decade
50-Year Trend
High: +0.54 °F/decade
Low: +0.83 °F/decade
Rain: -0.002 in/decade
All-Time Trend
High: +0.45 °F/decade
Low: +1.51 °F/decade
Rain: -0.001 in/decade
Percentage Above-Average Days
Last 12 Months: 63.3%
This Year: 81.6%
Precipitation Concentration Index (PCI) ℹ️
Last 12 Months: 23.6
Historical Average: 20.1
Percentile Rank of Last 12 Months ℹ️
High: 99th percentile
Low: 99th percentile
Rain: 24th percentile
Change in Variance ℹ️
High: +1.0%
Low: -3.7%
Intraday: -46.8%
Data Coverage
85.1%
First Year of Data
1933
Station Location
Historical Weather Records
| Max High | Avg High | Min High | Max Avg | Avg Avg | Min Avg | Max Low | Avg Low | Min Low | Max Precipitation | Avg Precipitation | Max Snow | Avg Snow | |
|---|---|---|---|---|---|---|---|---|---|---|---|---|---|
| Record | 122.00 °F | — | 42.98 °F | 107.96 °F | — | 36.68 °F | 96.98 °F | — | 17.06 °F | 2.99 in | — | 0.39 in | — |
| January | 87.98 °F | 66.54 °F | 42.98 °F | 70.34 °F | 55.78 °F | 37.22 °F | 60.98 °F | 42.22 °F | 17.06 °F | 2.69 in | 0.02 in | 0.00 in | 0.00 in |
| February | 91.94 °F | 70.49 °F | 44.06 °F | 76.42 °F | 59.63 °F | 37.58 °F | 64.94 °F | 45.24 °F | 21.92 °F | 1.63 in | 0.03 in | 0.39 in | 0.00 in |
| March | 105.08 °F | 76.59 °F | 48.92 °F | 88.52 °F | 65.49 °F | 44.78 °F | 75.92 °F | 50.19 °F | 24.98 °F | 1.69 in | 0.03 in | 0.00 in | 0.00 in |
| April | 105.08 °F | 85.08 °F | 51.98 °F | 89.42 °F | 73.36 °F | 47.84 °F | 77.00 °F | 56.91 °F | 33.98 °F | 0.92 in | 0.01 in | 0.00 in | 0.00 in |
| May | 113.00 °F | 93.95 °F | 64.04 °F | 99.68 °F | 82.26 °F | 59.54 °F | 86.00 °F | 65.09 °F | 39.92 °F | 0.91 in | 0.00 in | 0.00 in | 0.00 in |
| June | 122.00 °F | 103.54 °F | 75.02 °F | 106.70 °F | 92.12 °F | 68.00 °F | 95.00 °F | 73.99 °F | 50.00 °F | 1.37 in | 0.00 in | 0.00 in | 0.00 in |
| July | 120.92 °F | 106.01 °F | 80.06 °F | 107.96 °F | 95.38 °F | 76.28 °F | 96.98 °F | 81.45 °F | 60.98 °F | 1.15 in | 0.02 in | 0.00 in | 0.00 in |
| August | 118.04 °F | 104.01 °F | 78.08 °F | 105.80 °F | 93.95 °F | 73.22 °F | 95.00 °F | 80.15 °F | 60.08 °F | 2.99 in | 0.03 in | 0.00 in | 0.00 in |
| September | 118.04 °F | 99.46 °F | 71.06 °F | 102.74 °F | 88.62 °F | 66.92 °F | 93.02 °F | 73.97 °F | 46.94 °F | 2.43 in | 0.02 in | 0.00 in | 0.00 in |
| October | 113.00 °F | 88.66 °F | 55.94 °F | 94.62 °F | 76.97 °F | 54.86 °F | 86.00 °F | 61.90 °F | 33.98 °F | 1.69 in | 0.02 in | 0.00 in | 0.00 in |
| November | 98.96 °F | 75.79 °F | 44.96 °F | 84.02 °F | 64.11 °F | 44.96 °F | 73.04 °F | 49.50 °F | 24.98 °F | 1.69 in | 0.02 in | 0.00 in | 0.00 in |
| December | 87.98 °F | 66.88 °F | 42.98 °F | 69.62 °F | 55.55 °F | 36.68 °F | 62.96 °F | 42.61 °F | 21.92 °F | 1.50 in | 0.03 in | 0.20 in | 0.00 in |
Data Visualisations
Remove WatermarksCurrent Year Climate Trends vs Historical


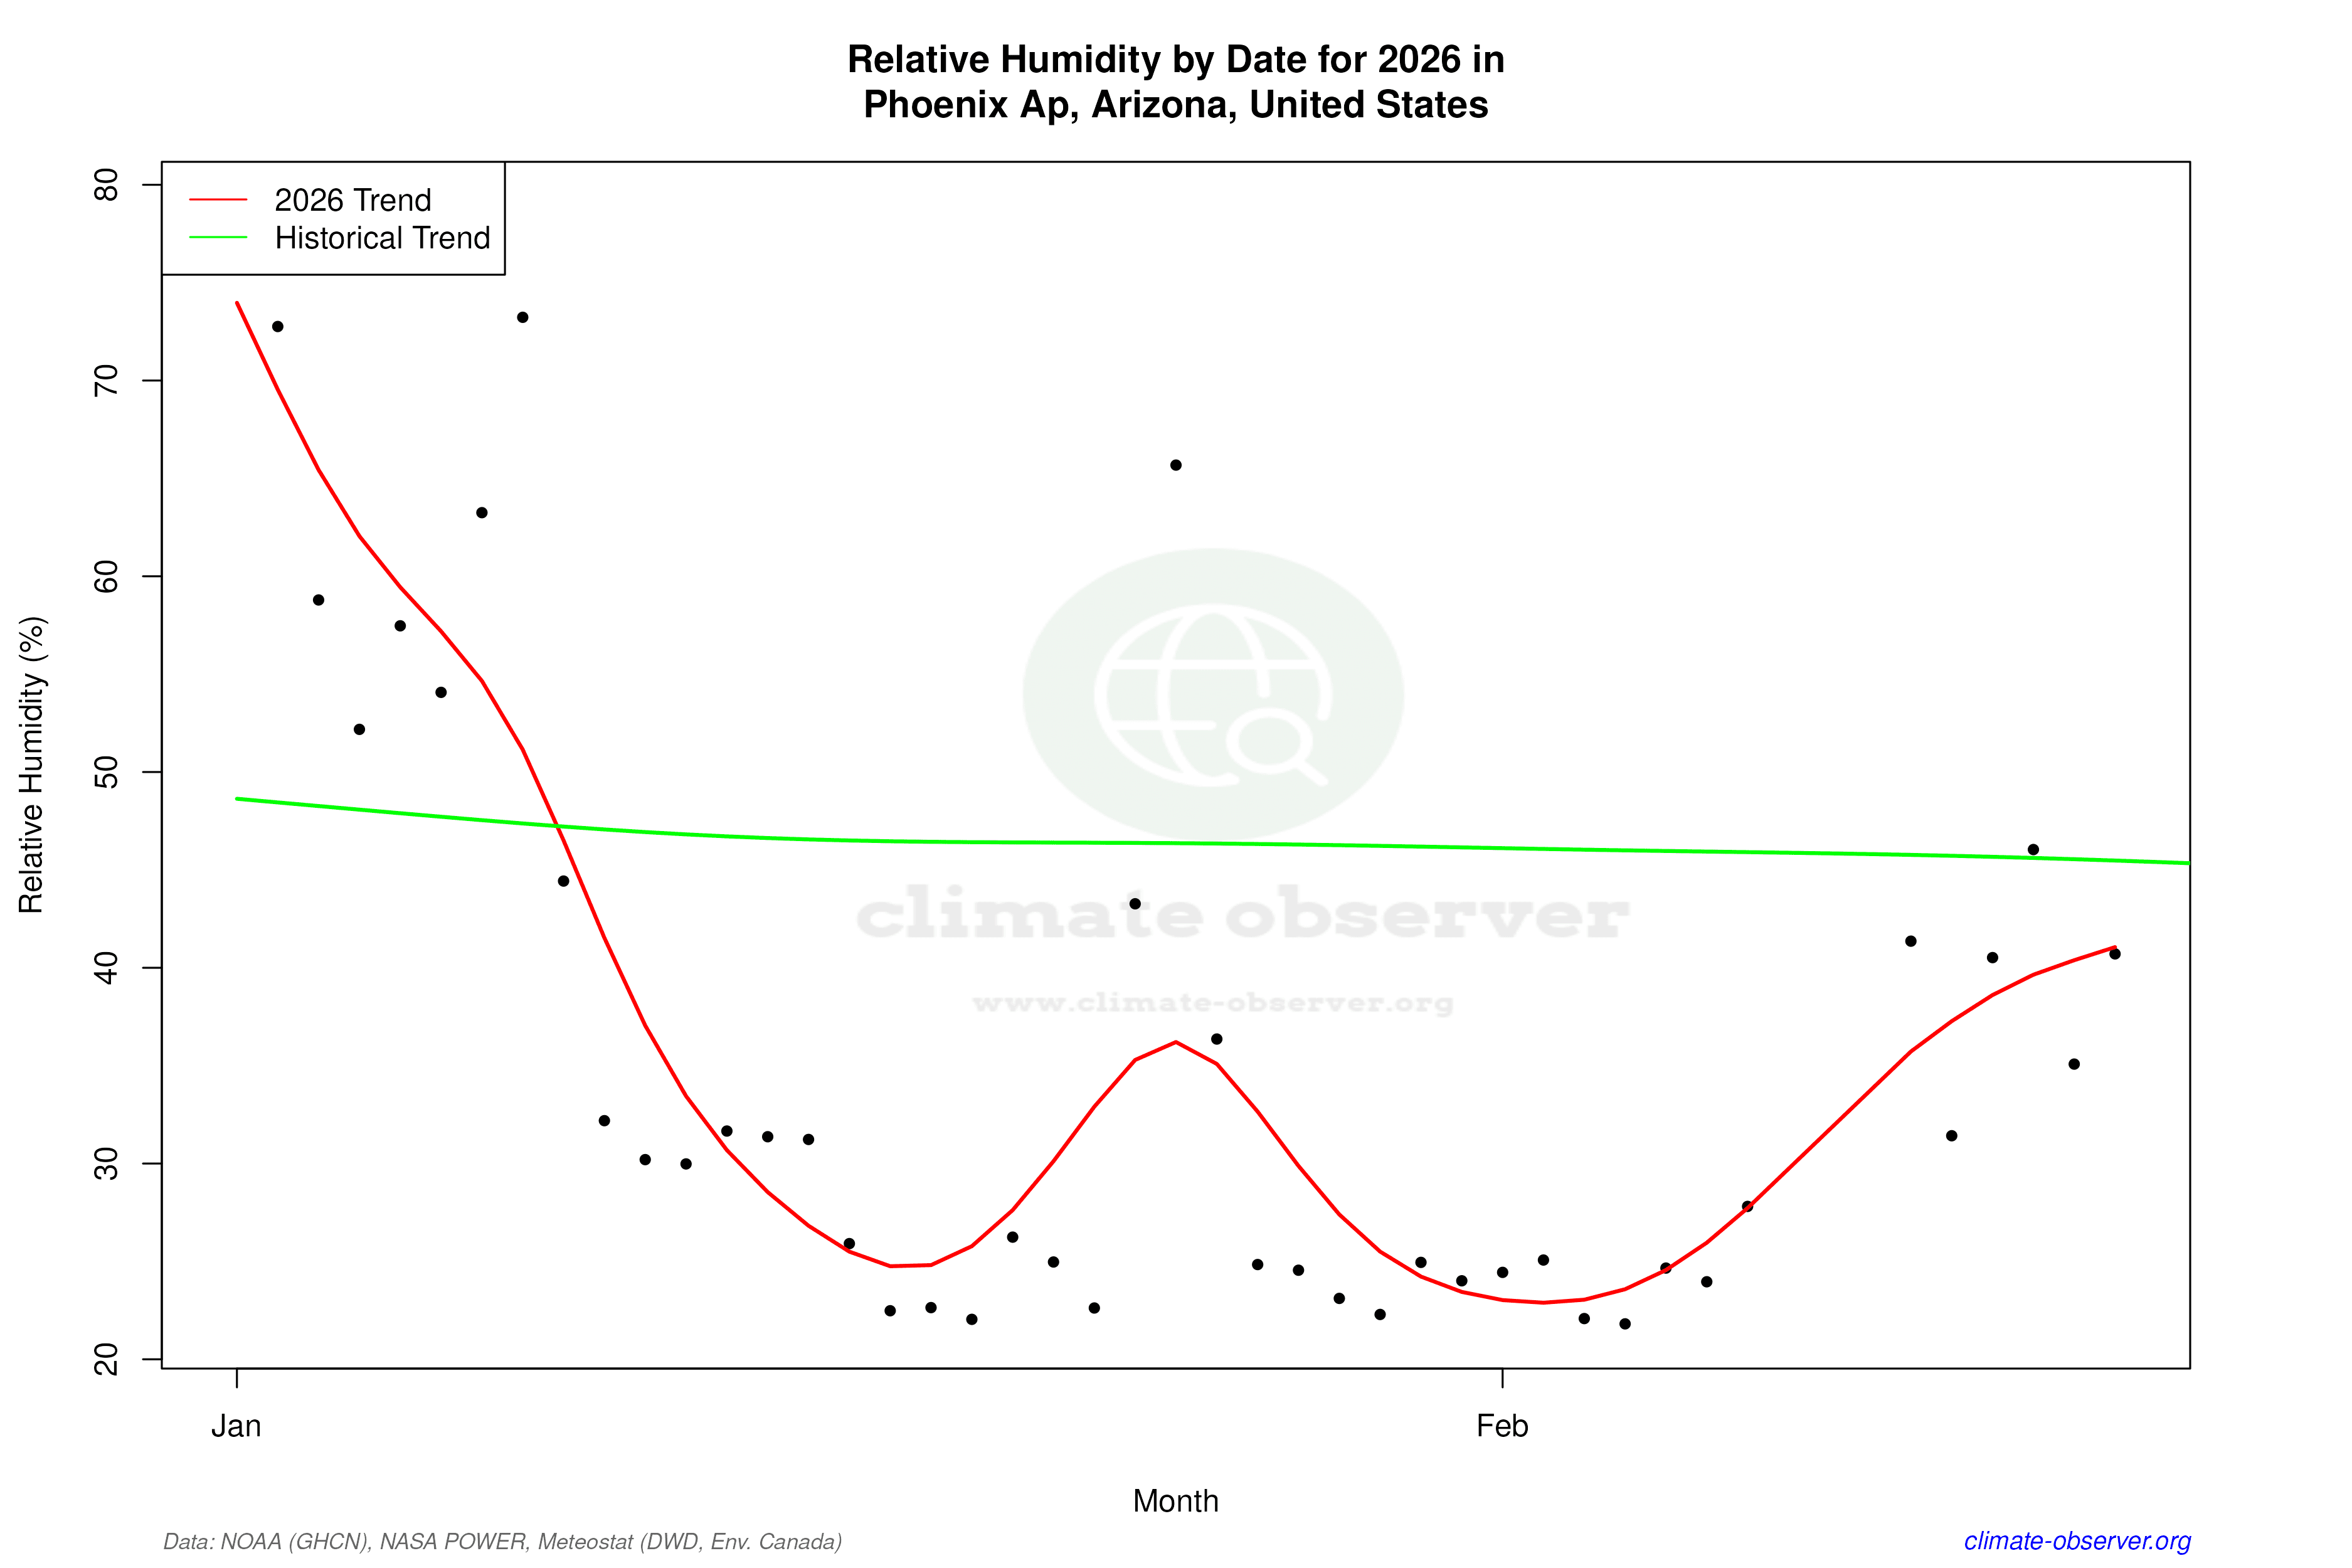

Max Temperature this Year | 1 of 6
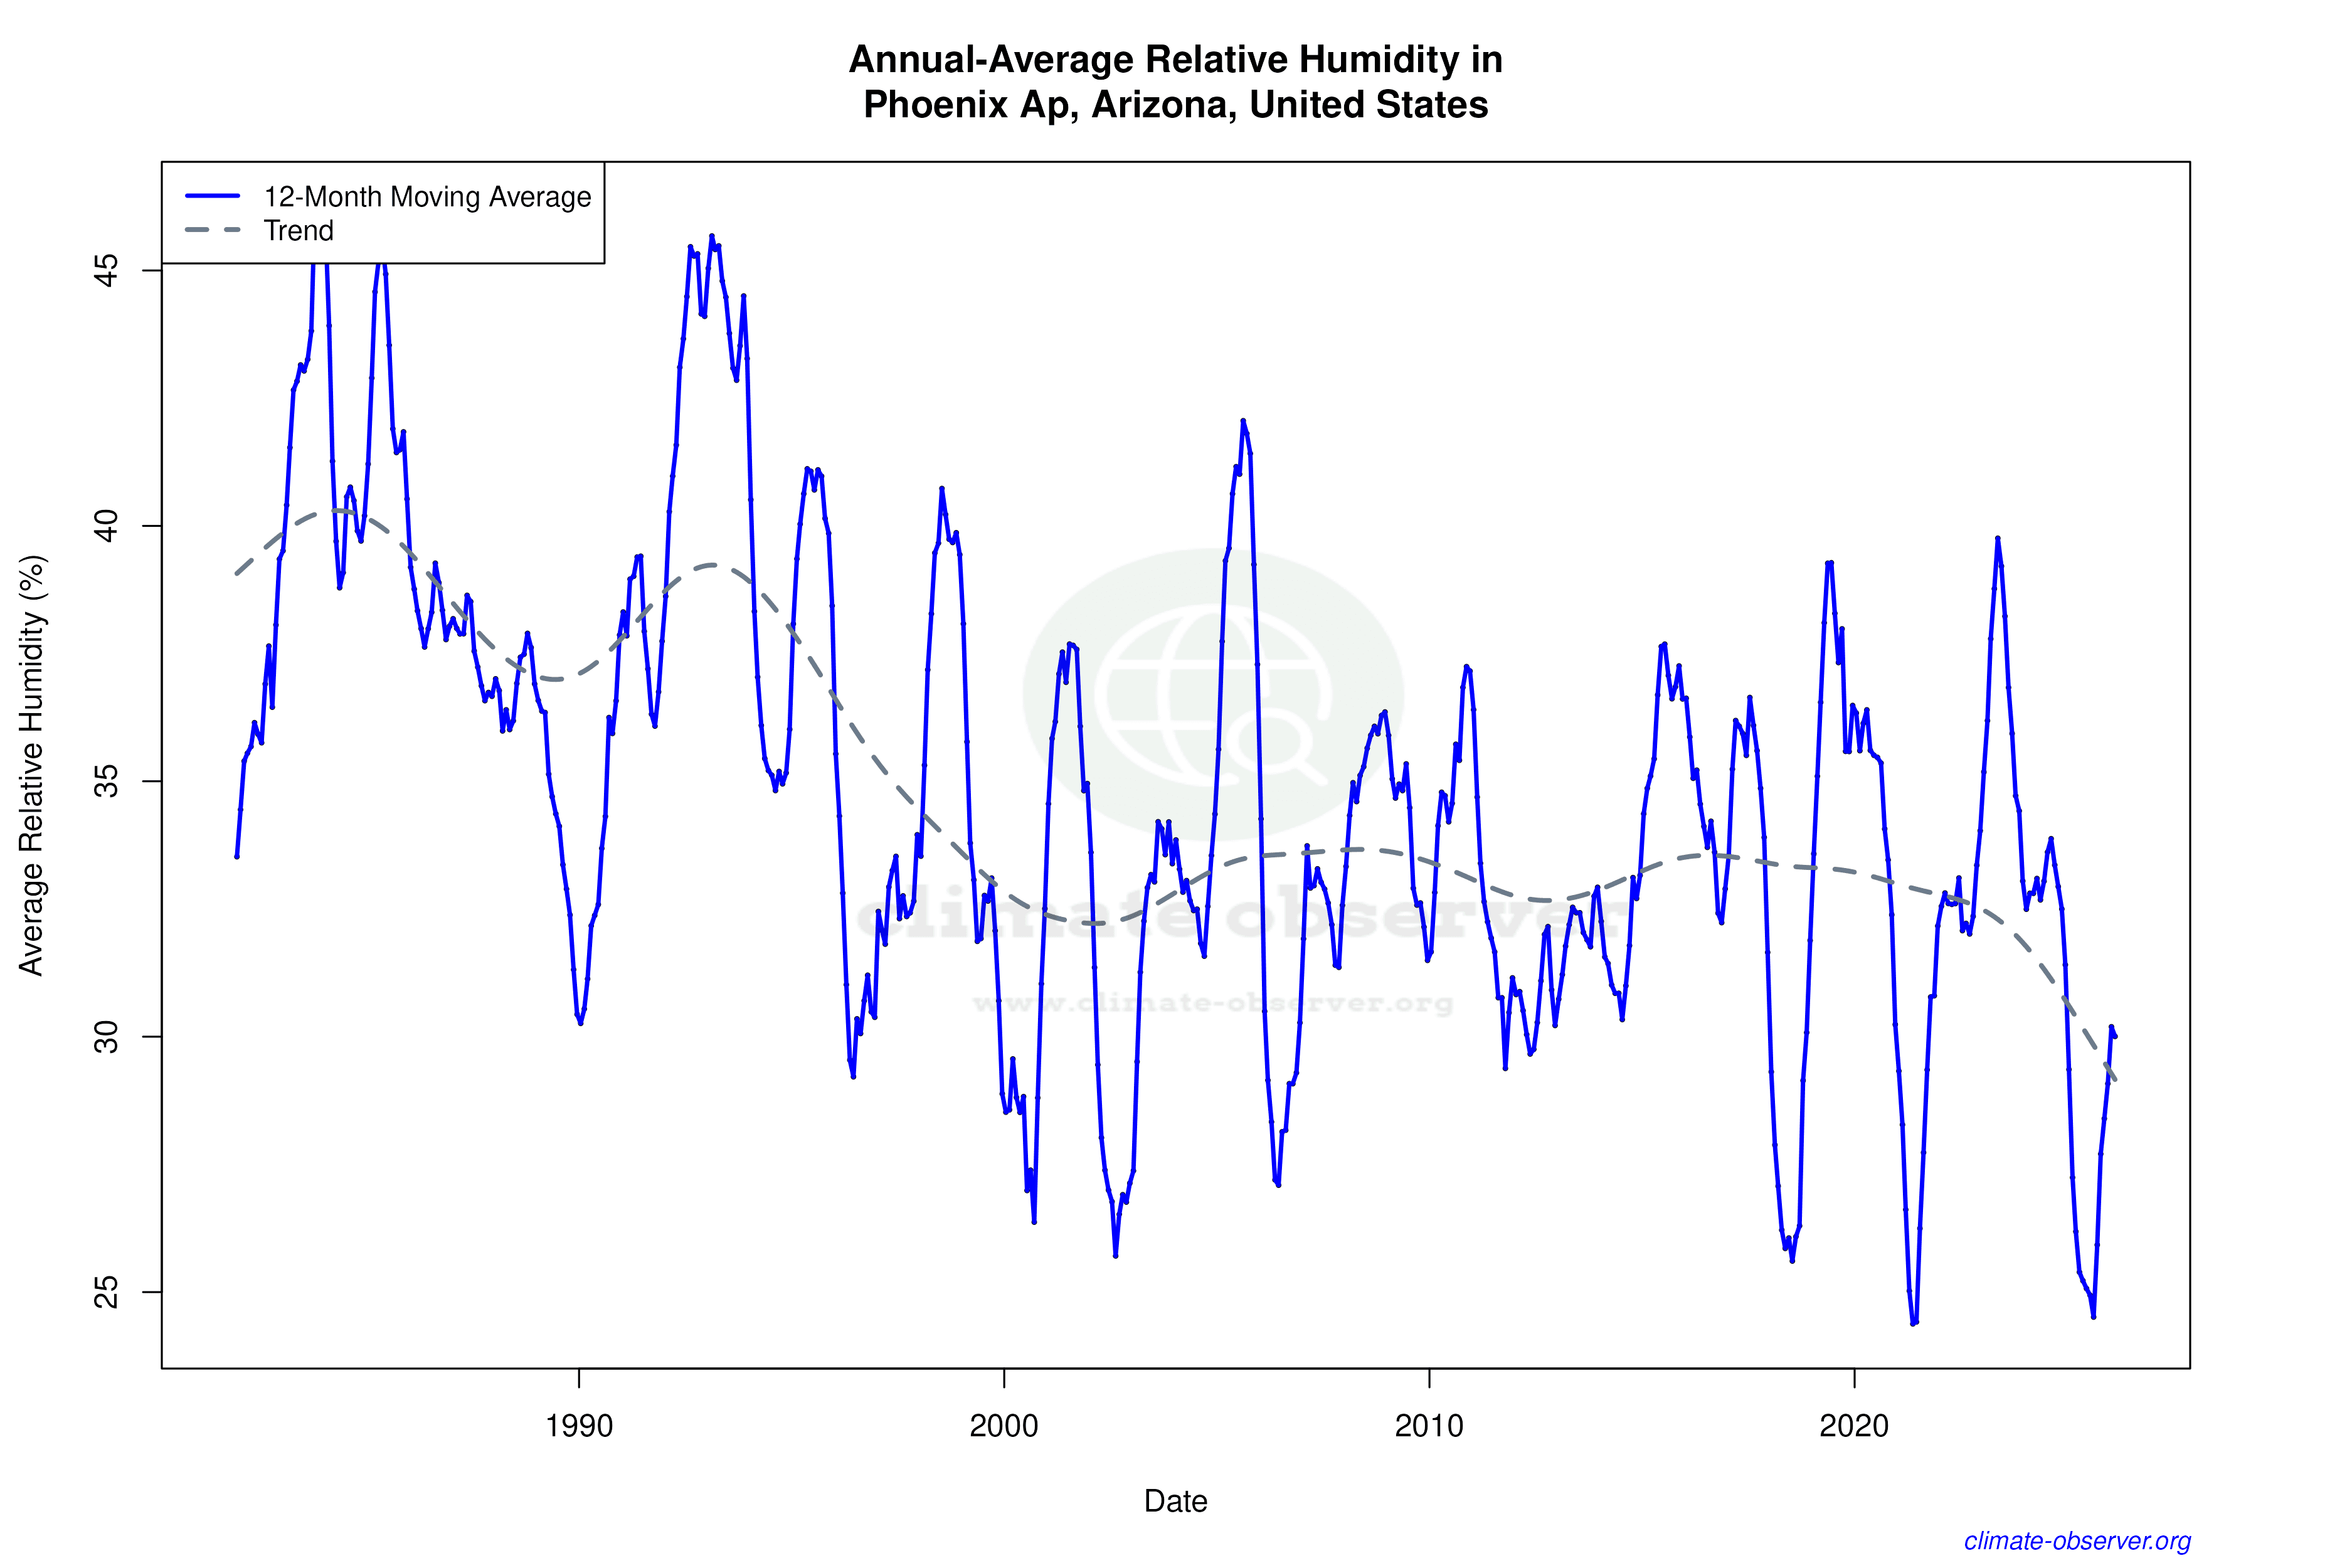
Climate 12-Month Moving Averages
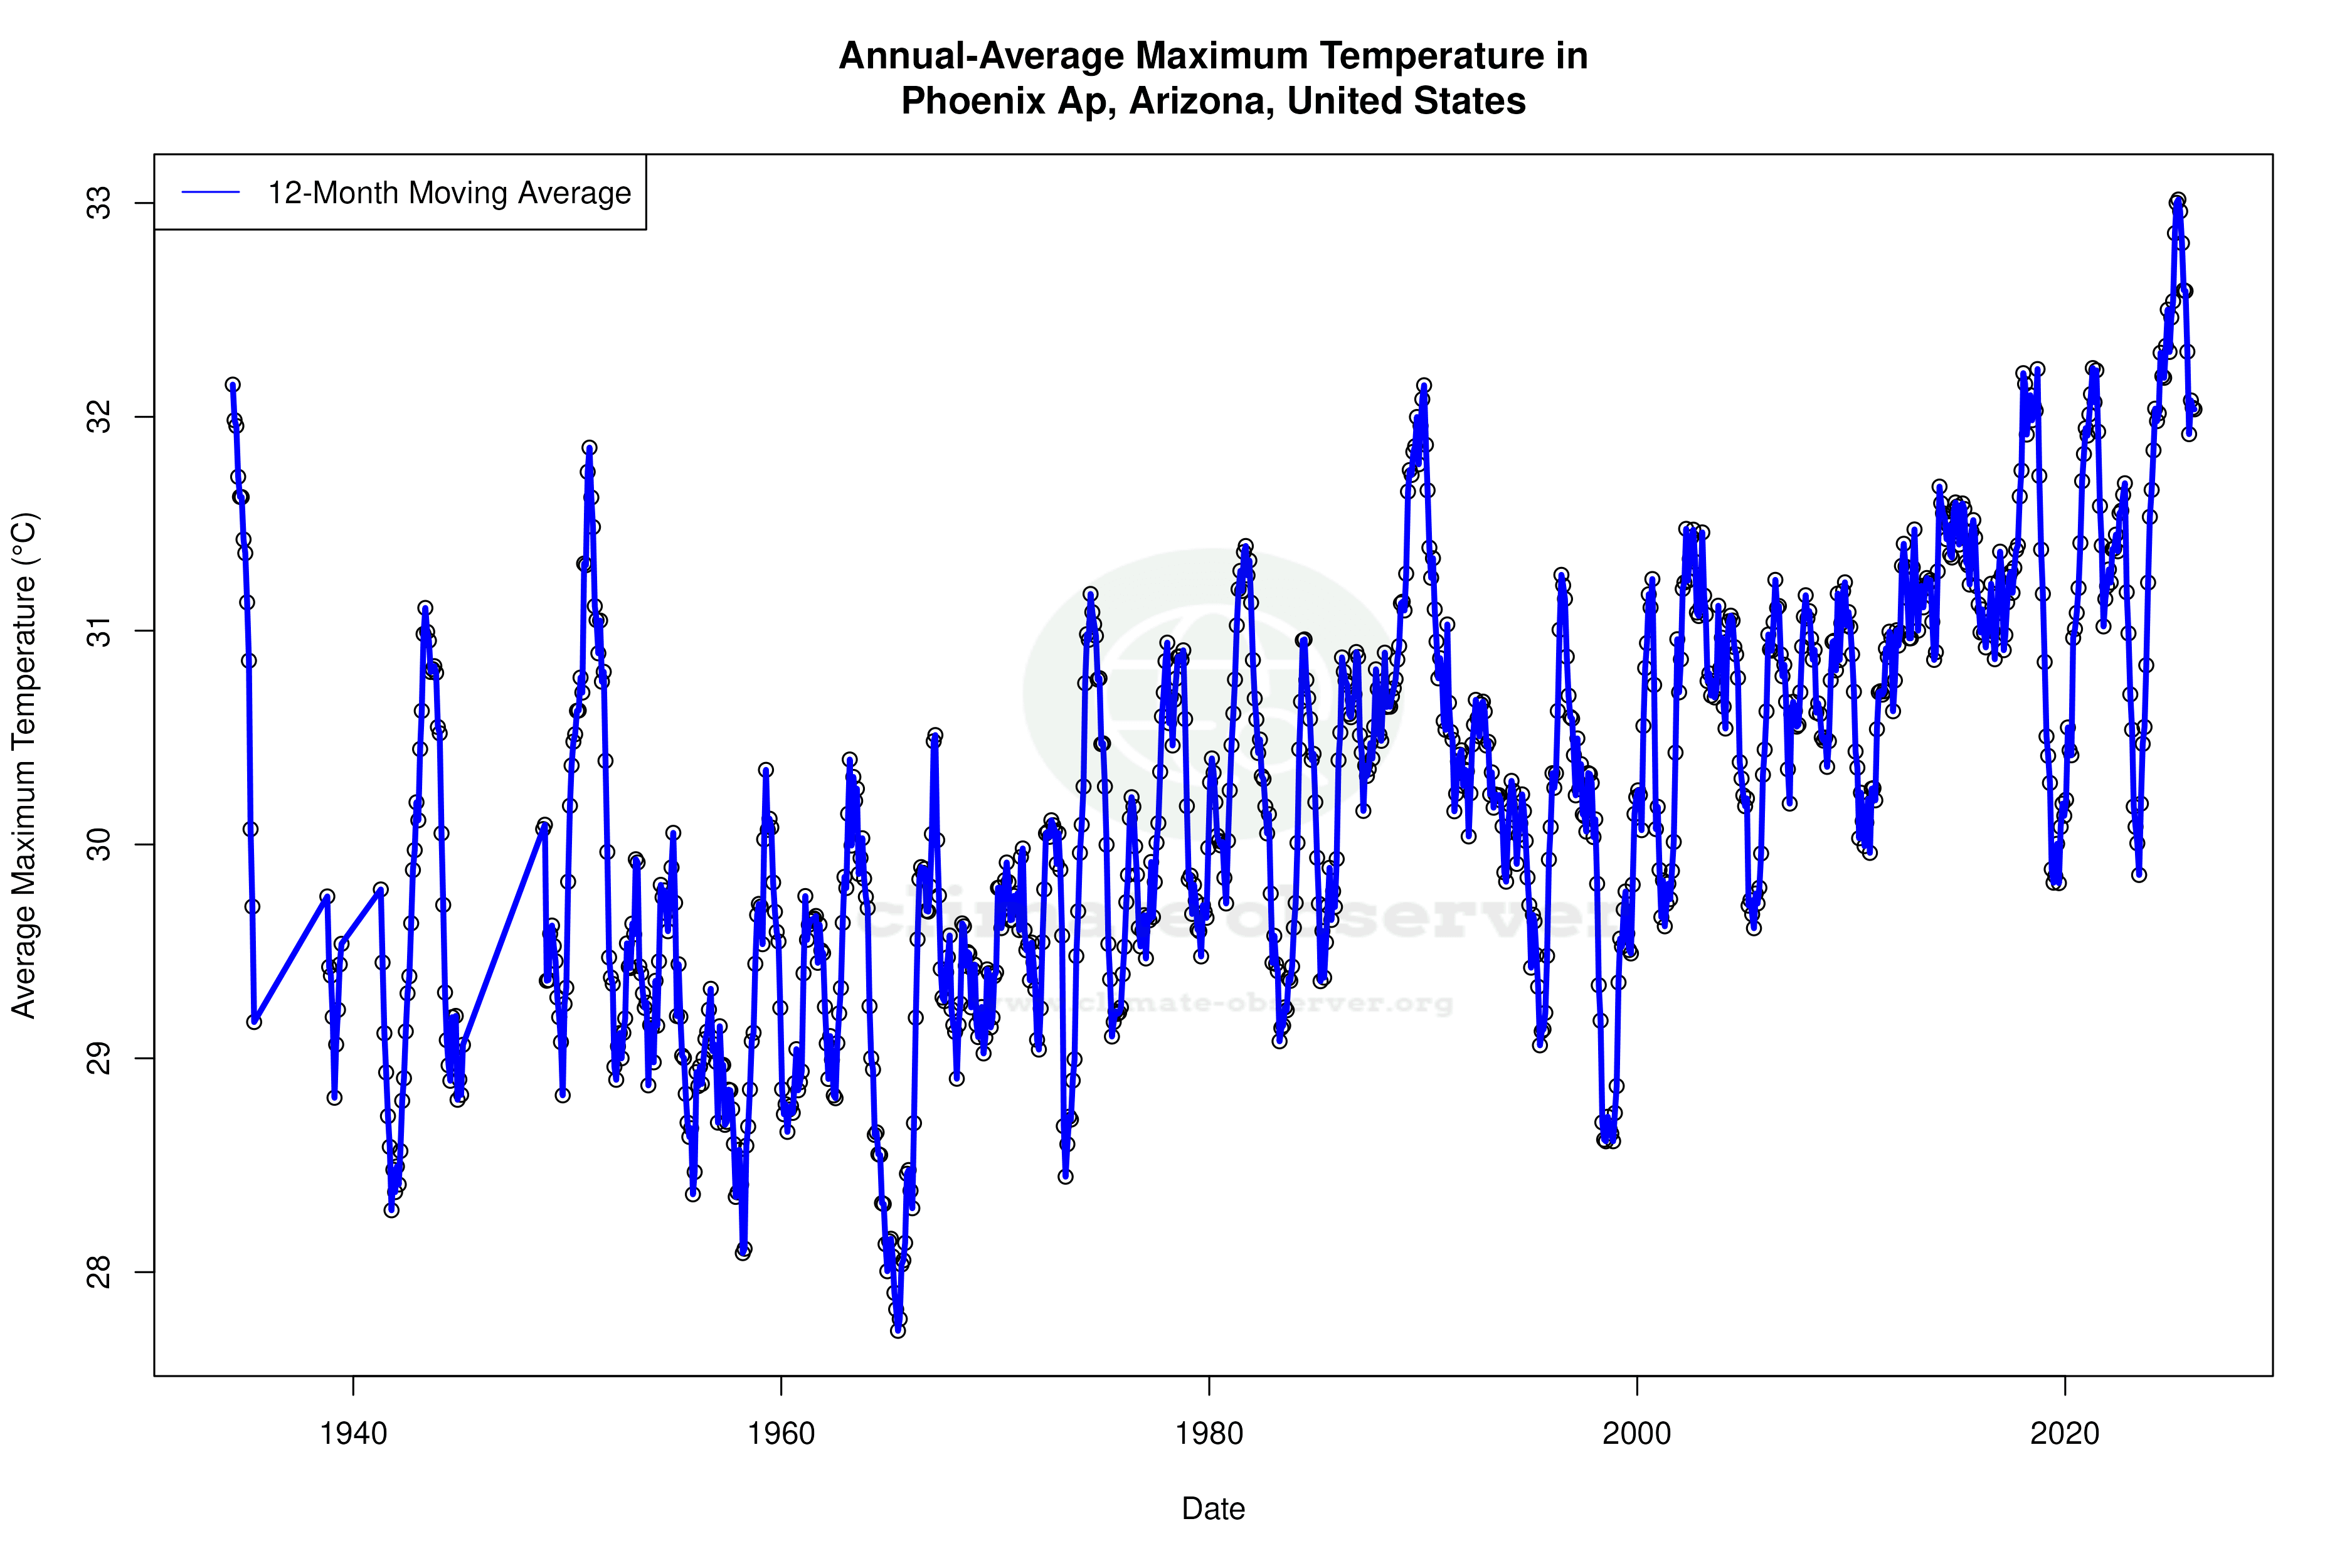


Max Temperature 12-Month MA | 1 of 6
Daily Data Points and Averages Throughout the Year


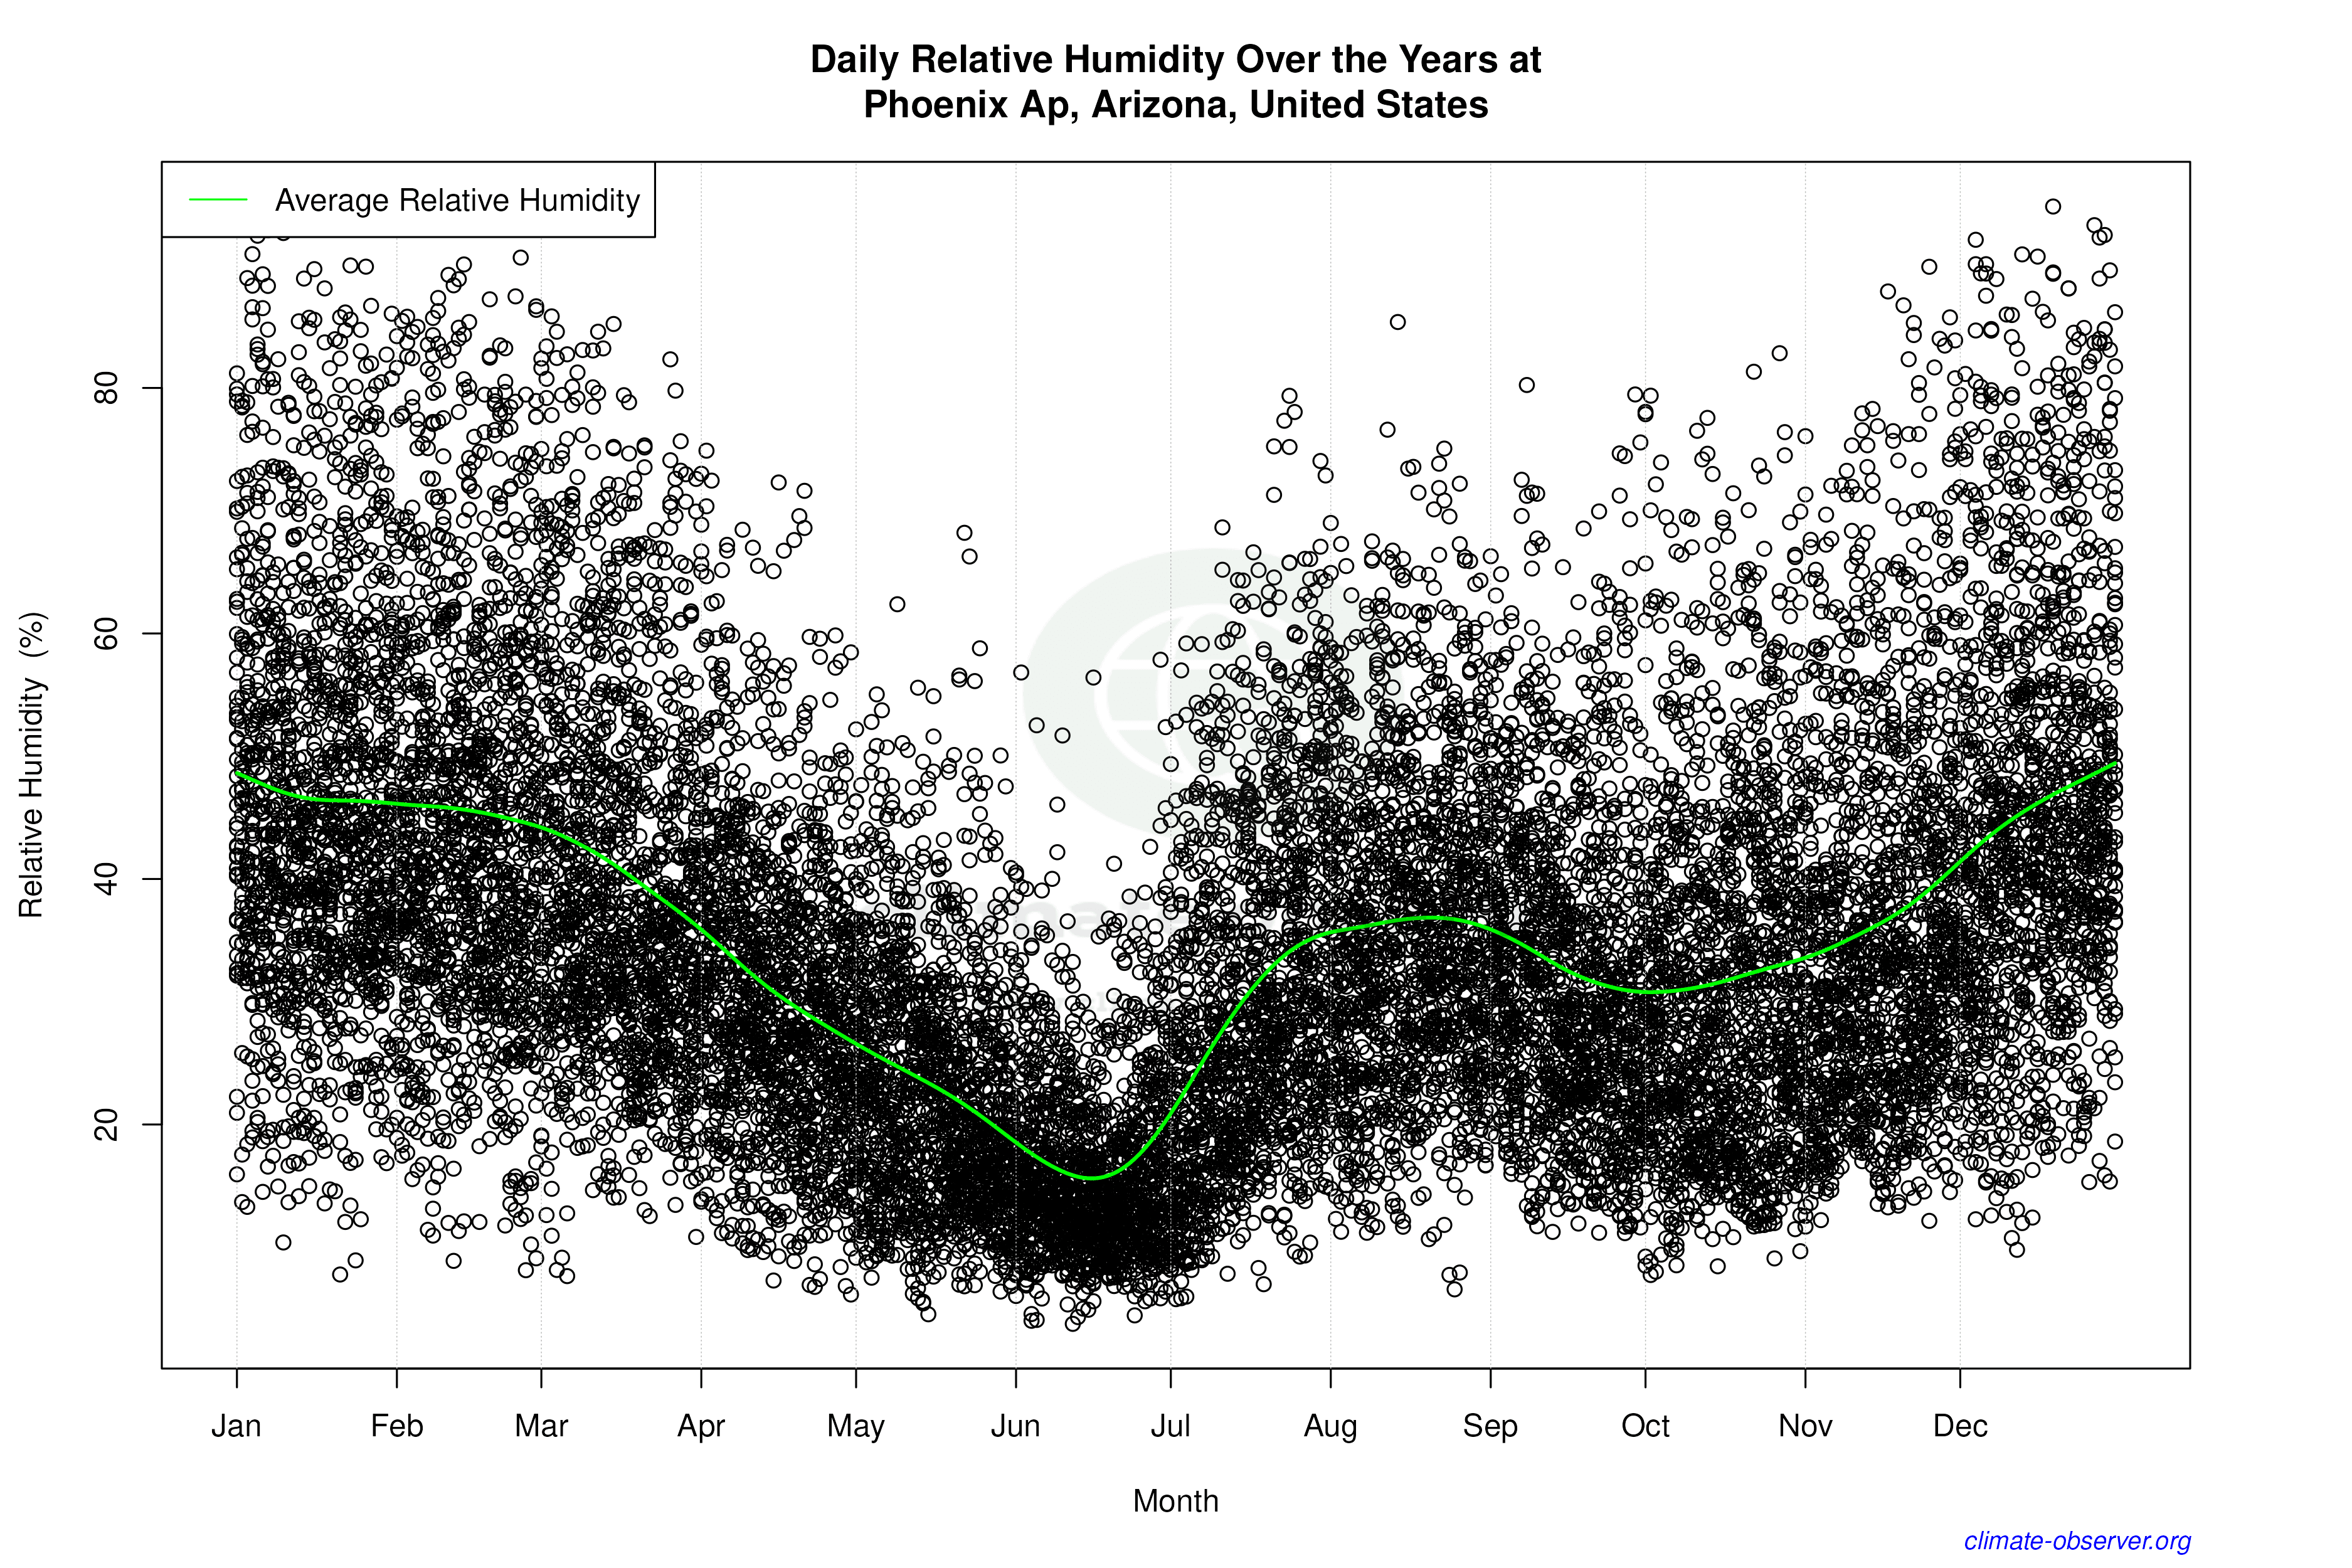

Average Max Temperature Throughout Year | 1 of 5
