Climate for Station: Sacramento 5 Ese, California, United States
Loading live weather...
Climate Analysis & Overview
Sacramento 5 Ese is experiencing a nuanced climate narrative, with a long-term warming trend juxtaposed against a recent cooling spell. The region's precipitation patterns have become more evenly distributed, reflecting a shift in hydrological dynamics.
A Subtle Thermal Shift
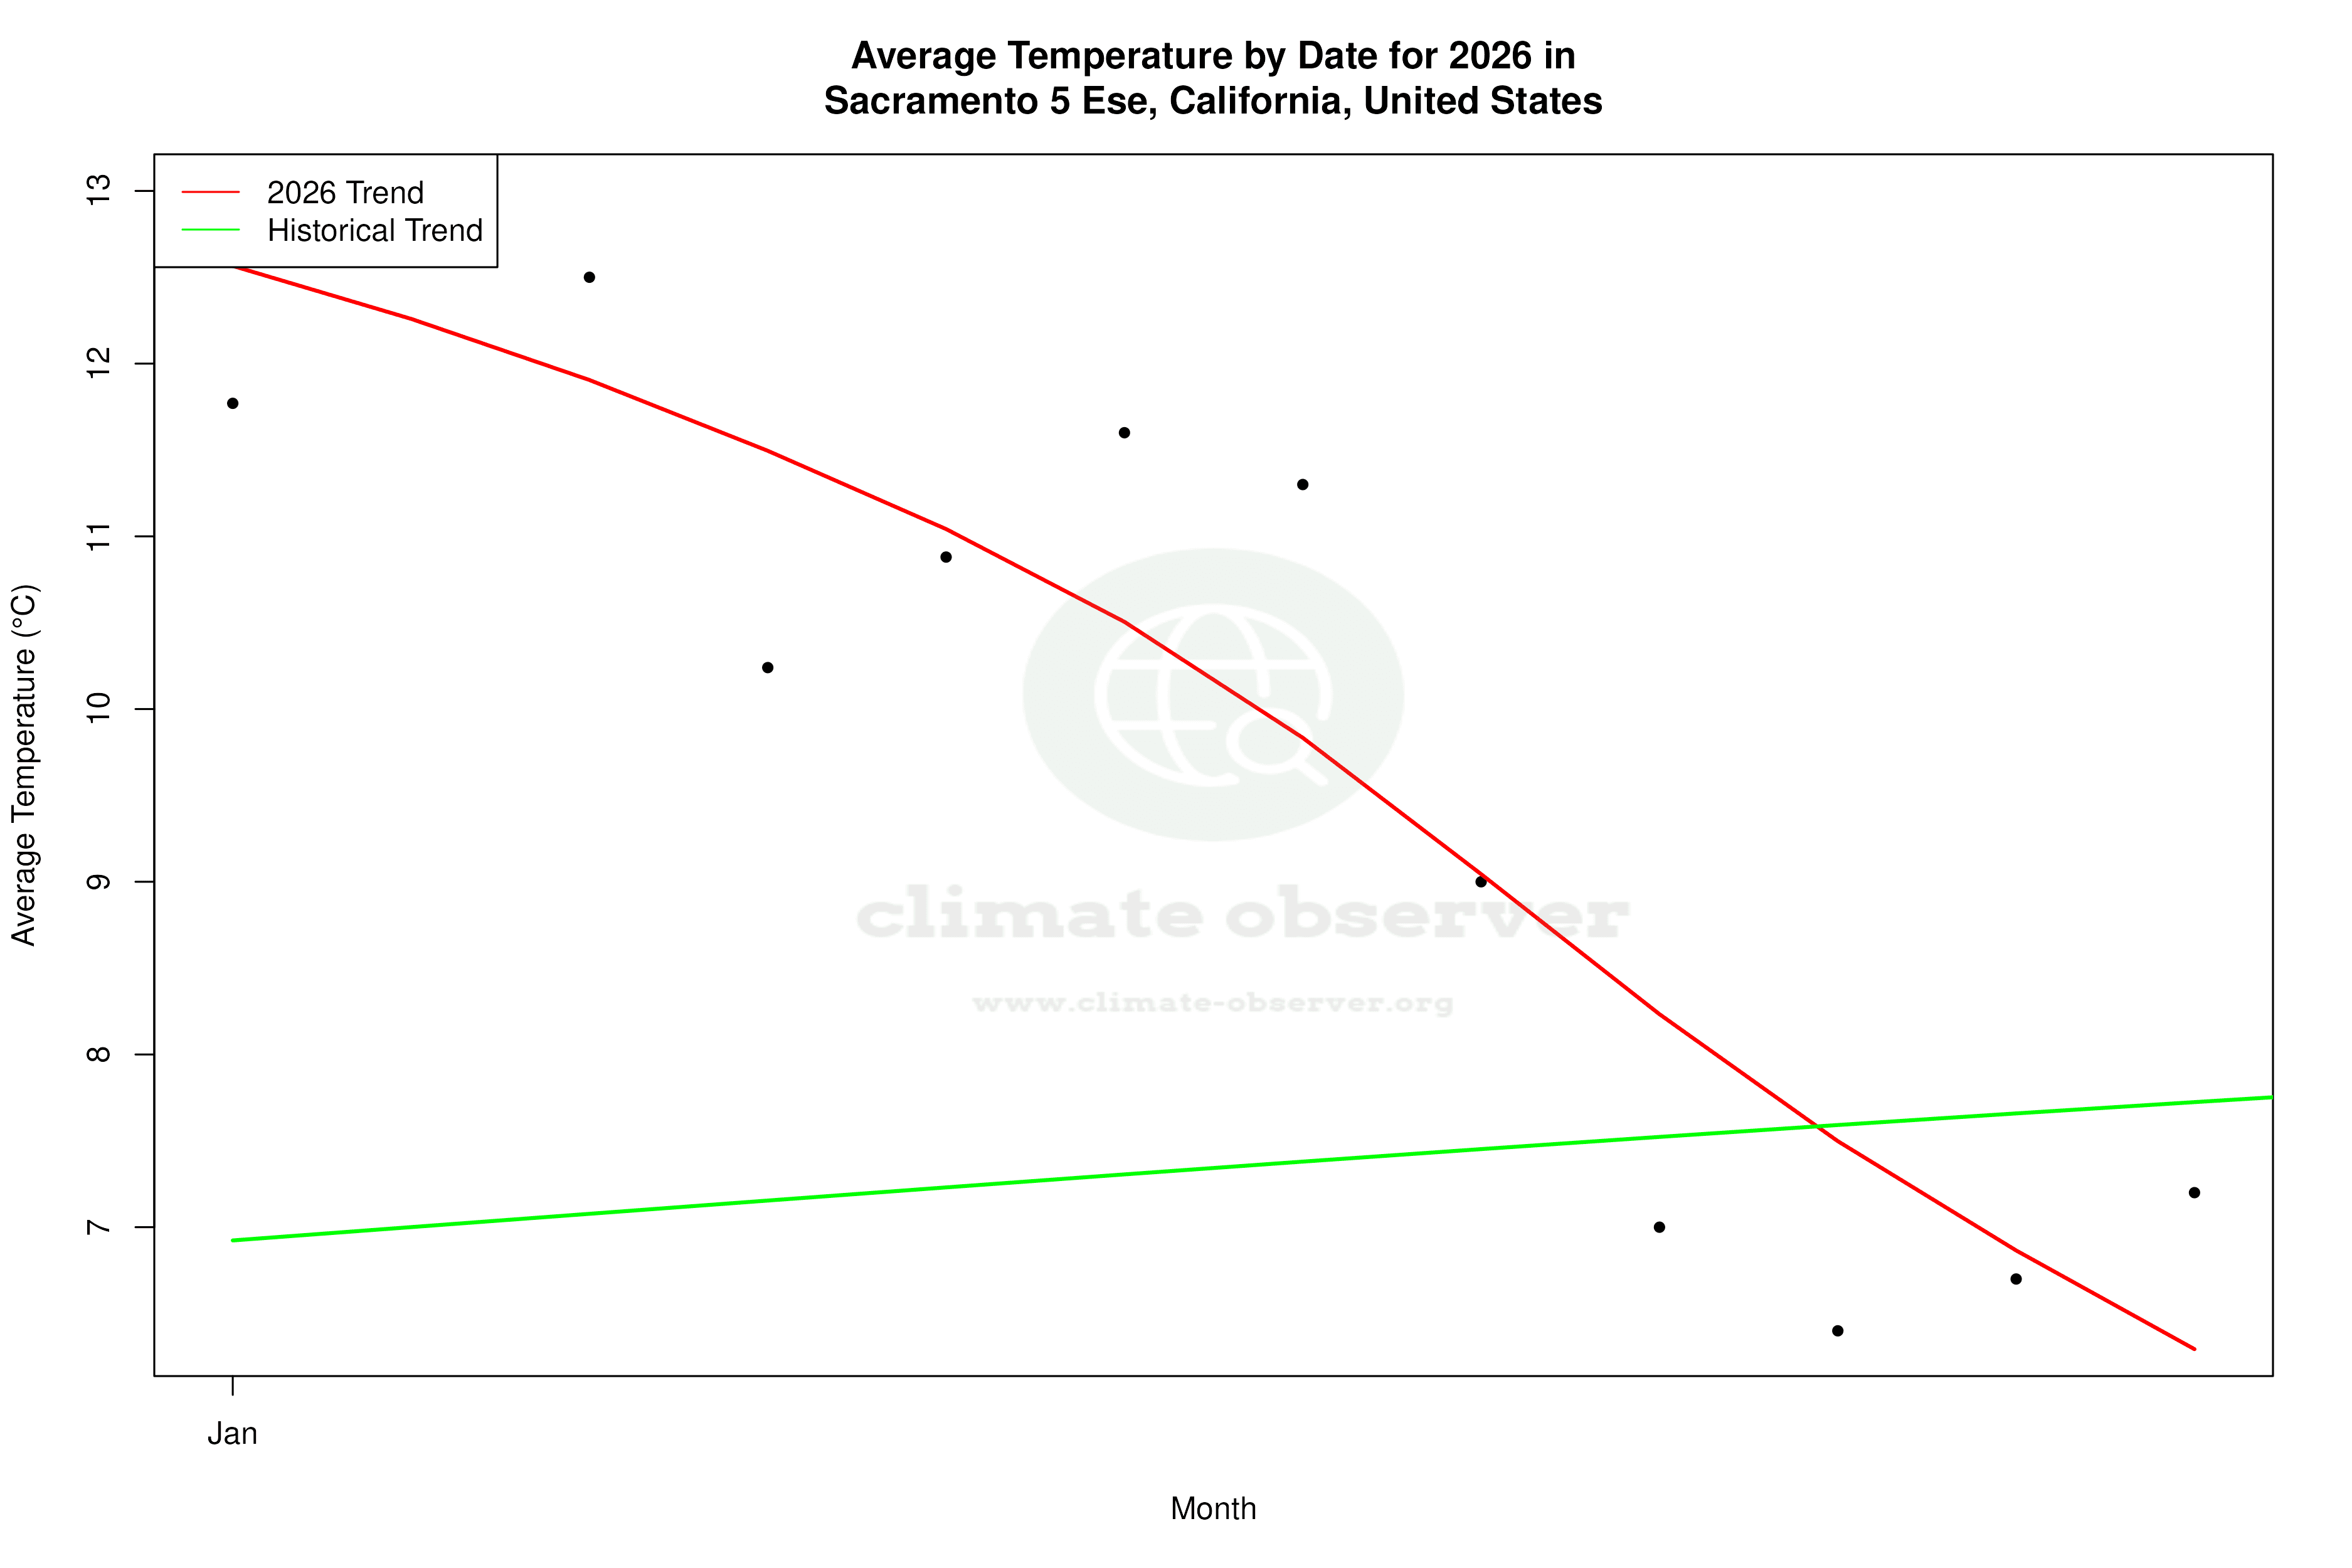
Sacramento 5 Ese, located at the coordinates 38.5553°N, -121.4183°W, sits within a Mediterranean climate zone, characterised by hot, dry summers and mild, wet winters. This climate type is influenced by the nearby Sierra Nevada mountains and the Sacramento River, which modulate temperature and precipitation patterns. Over the long term, the area has experienced a warming trend, with all-time highs increasing by 0.25°C (0.45°F) and lows rising by 0.13°C (0.23°F). However, the last decade presents a contrasting picture, with a cooling trend in both highs and lows, declining by 0.57°C (1.03°F) and 0.54°C (0.97°F) respectively. This divergence between long-term and recent trends suggests a complex interplay of regional climatic factors.
Precipitation Patterns: A New Equilibrium
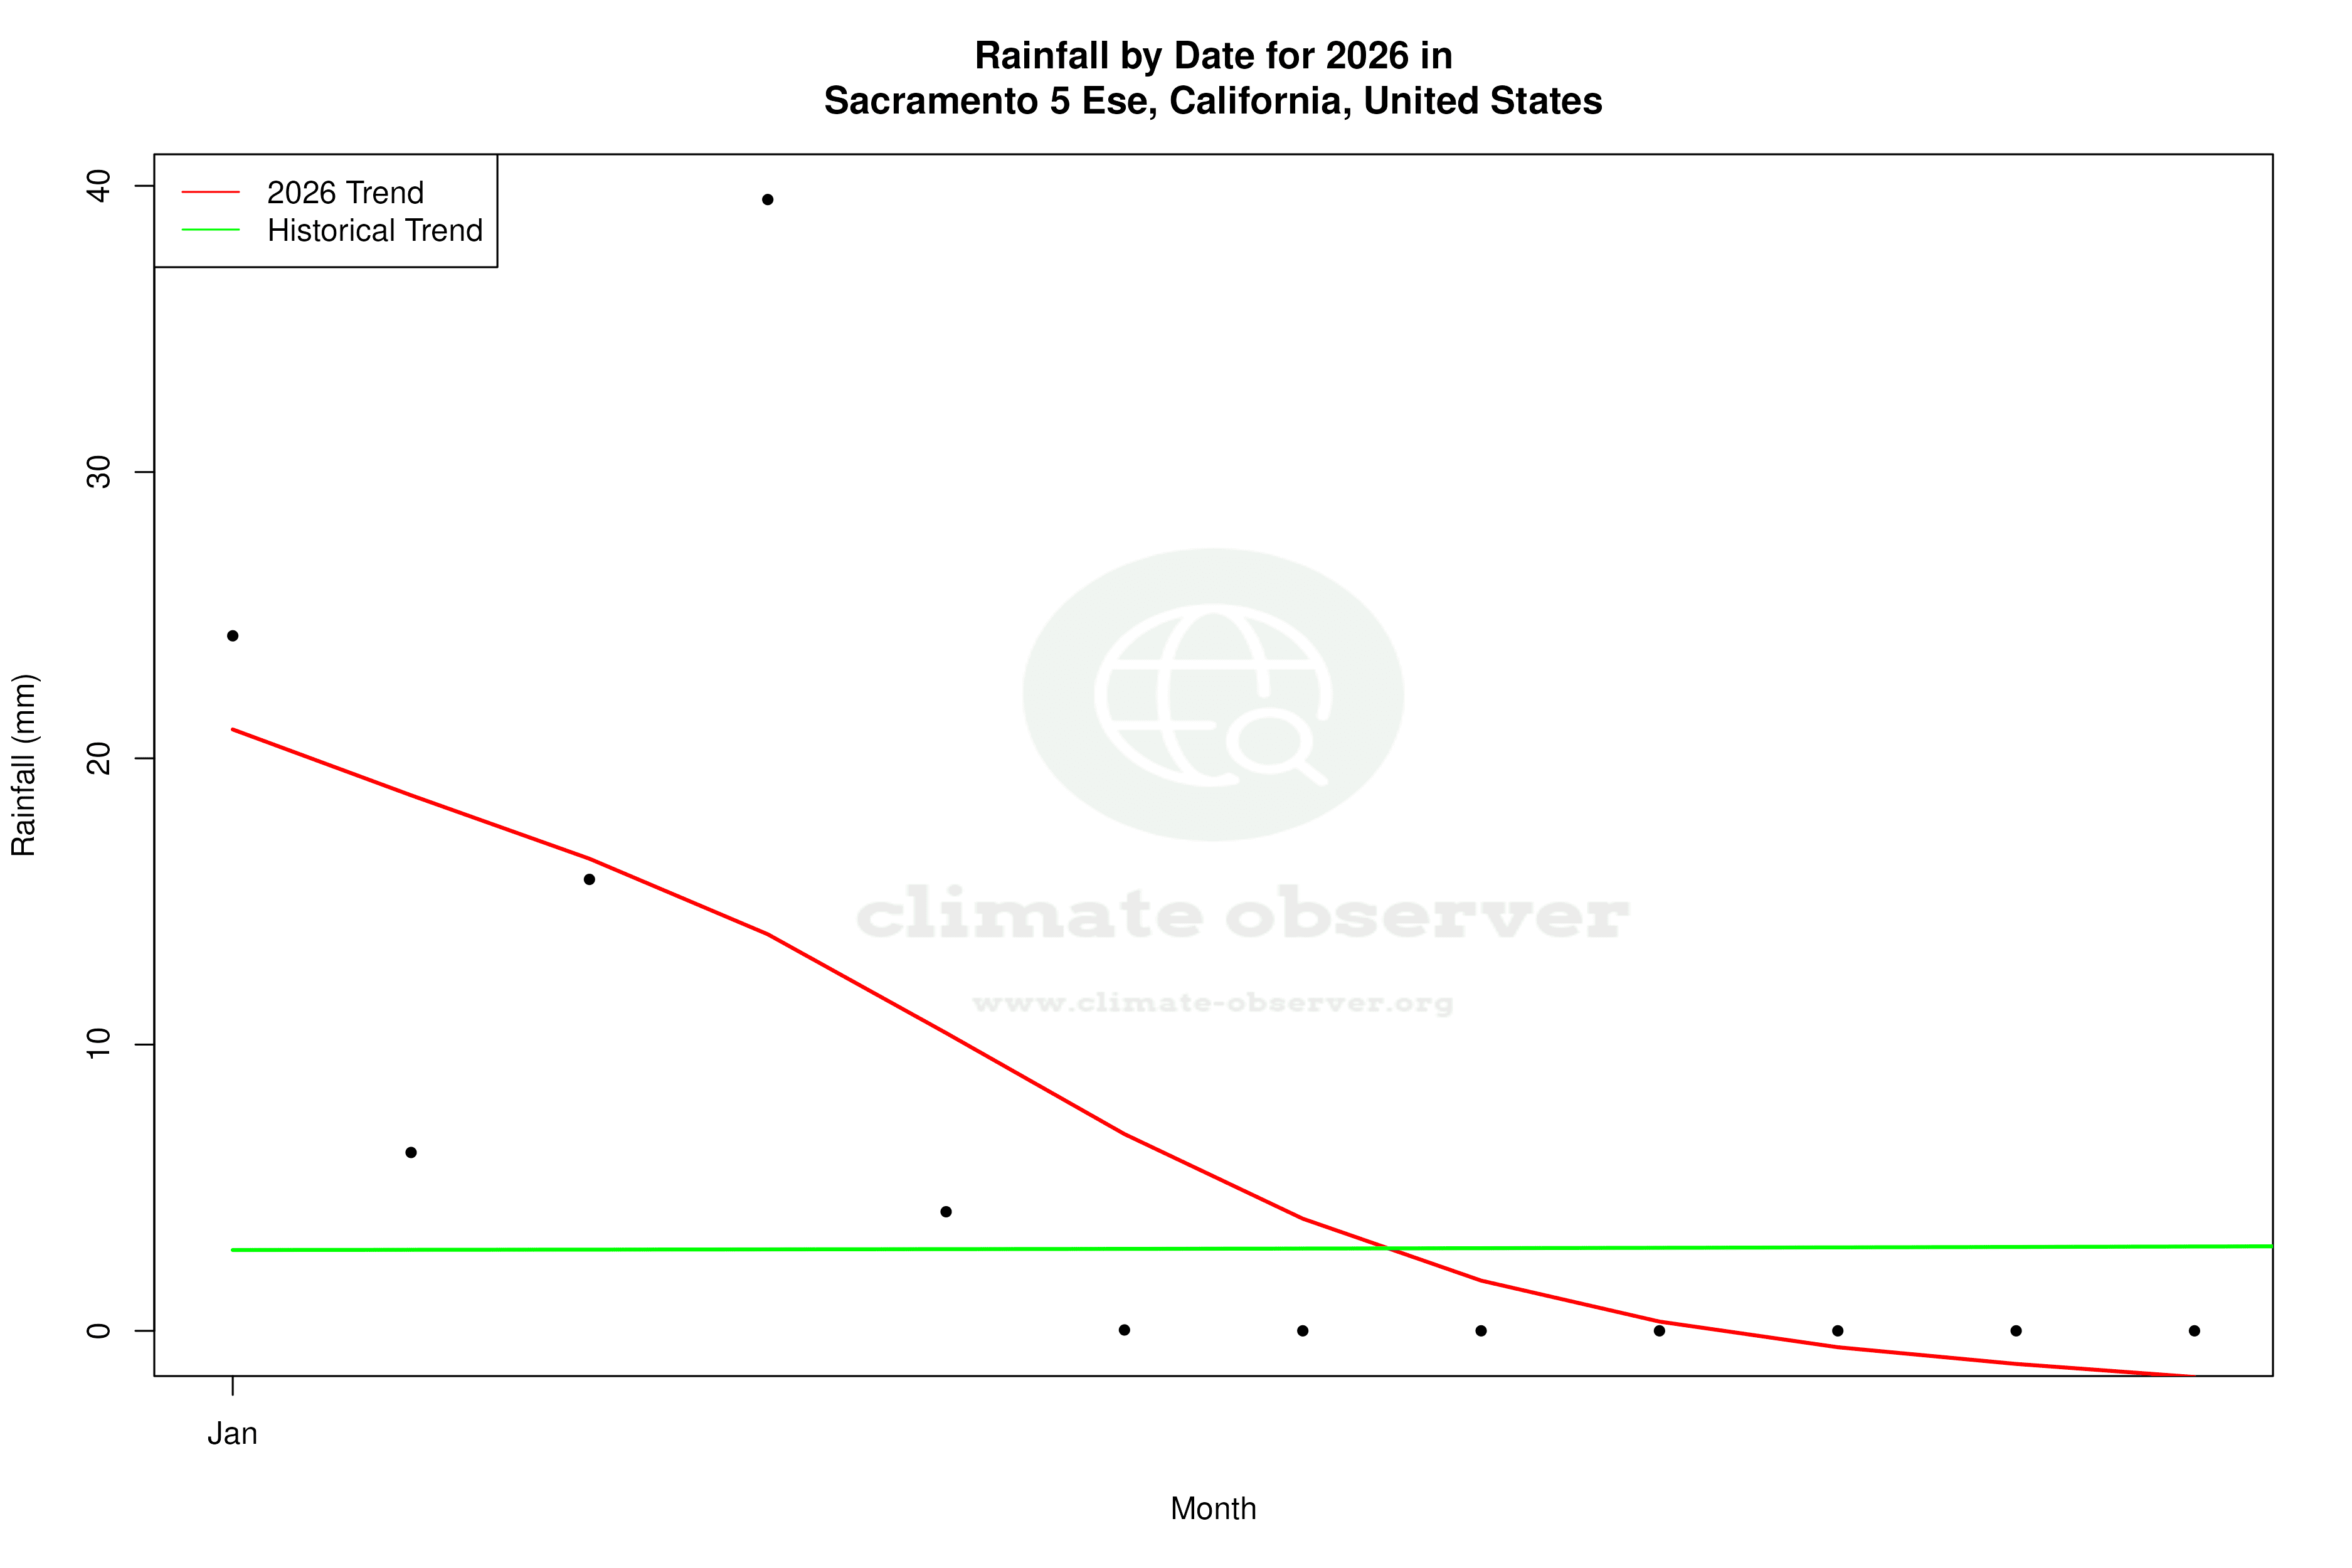
The Precipitation Concentration Index (PCI) for Sacramento 5 Ese has shown a marked decrease from a baseline of 21.35 to a current value of 15.85. The PCI measures how rainfall is distributed over time; a lower value indicates more evenly distributed precipitation. This shift suggests that rainfall events have become less concentrated and more evenly spread throughout the year, which could be beneficial for agriculture and water management in the region. The significant decrease in PCI reflects a notable change in the area's hydrological cycle, potentially aligning with broader climate adaptation goals in the United States.
Temperature Extremes: A Historical Perspective
Sacramento 5 Ese has recorded temperature extremes that underscore its climatic variability. The highest recorded temperature is 46.7°C (116.1°F), while the lowest is -8.3°C (17.1°F). These extremes highlight the range of conditions that can occur within this Mediterranean climate, influenced by both local geography and broader atmospheric patterns. Such variability is crucial for understanding potential impacts on local ecosystems and infrastructure.
Regional Climate Goals and Adaptation
As part of California's broader climate strategy, efforts are underway to mitigate the impacts of climate change through emission reductions and adaptation measures. The observed trends at Sacramento 5 Ese, particularly the more evenly distributed precipitation, may support these regional goals by reducing the risk of extreme weather events such as droughts and floods. This aligns with the state's objectives to enhance resilience against climate variability and to safeguard water resources.
Interpreting the Data Landscape
The climate data from Sacramento 5 Ese provides a window into the complex dynamics at play in this region. The juxtaposition of long-term warming with recent cooling trends, coupled with changes in precipitation distribution, paints a picture of a climate in transition. Understanding these patterns is essential for informing policy and guiding future climate resilience strategies.
Station Statistics
10-Year Trend
High: -0.26 °F/decade
Low: -0.15 °F/decade
Rain: -0.020 in/decade
25-Year Trend
High: +0.78 °F/decade
Low: +0.46 °F/decade
Rain: +0.000 in/decade
50-Year Trend
High: +0.43 °F/decade
Low: +0.07 °F/decade
Rain: -0.001 in/decade
All-Time Trend
High: +0.46 °F/decade
Low: +0.24 °F/decade
Rain: -0.000 in/decade
Percentage Above-Average Days
Last 12 Months: 53.2%
This Year: 65.8%
Precipitation Concentration Index (PCI) ℹ️
Last 12 Months: 17.2
Historical Average: 22.5
Percentile Rank of Last 12 Months ℹ️
High: 78th percentile
Low: 82nd percentile
Rain: 40th percentile
Change in Variance ℹ️
High: +3.5%
Low: +14.5%
Intraday: -6.4%
Data Coverage
89.0%
First Year of Data
1877
Station Location
Historical Weather Records
| Max High | Avg High | Min High | Max Avg | Avg Avg | Min Avg | Max Low | Avg Low | Min Low | Max Precipitation | Avg Precipitation | Max Snow | Avg Snow | |
|---|---|---|---|---|---|---|---|---|---|---|---|---|---|
| Record | 116.06 °F | — | 32.00 °F | 93.92 °F | — | 25.70 °F | 80.06 °F | — | 17.06 °F | 5.44 in | — | 0.71 in | — |
| January | 78.98 °F | 54.06 °F | 33.08 °F | 63.14 °F | 46.31 °F | 31.28 °F | 60.08 °F | 39.81 °F | 19.04 °F | 3.05 in | 0.11 in | 0.00 in | 0.00 in |
| February | 80.06 °F | 60.12 °F | 39.92 °F | 65.66 °F | 50.67 °F | 32.90 °F | 58.53 °F | 43.13 °F | 21.02 °F | 2.63 in | 0.11 in | 0.00 in | 0.00 in |
| March | 89.96 °F | 65.25 °F | 44.96 °F | 72.68 °F | 54.31 °F | 39.56 °F | 60.08 °F | 45.80 °F | 28.94 °F | 2.62 in | 0.08 in | 0.00 in | 0.00 in |
| April | 98.06 °F | 71.45 °F | 48.92 °F | 78.08 °F | 59.02 °F | 43.16 °F | 64.04 °F | 48.55 °F | 33.98 °F | 5.28 in | 0.05 in | 0.00 in | 0.00 in |
| May | 107.06 °F | 78.61 °F | 53.06 °F | 86.72 °F | 65.32 °F | 49.10 °F | 71.96 °F | 52.70 °F | 37.04 °F | 1.94 in | 0.02 in | 0.71 in | 0.00 in |
| June | 111.92 °F | 86.38 °F | 57.02 °F | 91.76 °F | 71.46 °F | 53.60 °F | 78.08 °F | 57.15 °F | 42.98 °F | 0.80 in | 0.01 in | 0.00 in | 0.00 in |
| July | 114.08 °F | 92.08 °F | 64.94 °F | 93.20 °F | 75.33 °F | 58.64 °F | 78.98 °F | 59.54 °F | 46.94 °F | 0.86 in | 0.00 in | 0.00 in | 0.00 in |
| August | 111.92 °F | 90.99 °F | 66.02 °F | 93.92 °F | 74.17 °F | 61.52 °F | 80.06 °F | 59.01 °F | 48.02 °F | 0.67 in | 0.00 in | 0.00 in | 0.00 in |
| September | 116.06 °F | 86.62 °F | 57.92 °F | 92.12 °F | 71.32 °F | 56.48 °F | 80.06 °F | 57.32 °F | 44.06 °F | 3.13 in | 0.01 in | 0.00 in | 0.00 in |
| October | 102.92 °F | 77.09 °F | 48.92 °F | 81.14 °F | 63.63 °F | 47.84 °F | 69.98 °F | 51.84 °F | 33.98 °F | 5.44 in | 0.03 in | 0.00 in | 0.00 in |
| November | 86.00 °F | 64.28 °F | 44.06 °F | 67.28 °F | 53.25 °F | 38.12 °F | 62.06 °F | 44.56 °F | 26.96 °F | 3.02 in | 0.06 in | 0.00 in | 0.00 in |
| December | 71.96 °F | 54.44 °F | 32.00 °F | 63.32 °F | 46.57 °F | 25.70 °F | 59.00 °F | 40.07 °F | 17.06 °F | 3.34 in | 0.10 in | 0.00 in | 0.00 in |
Data Visualisations
Remove WatermarksCurrent Year Climate Trends vs Historical


Max Temperature this Year | 1 of 6
Climate 12-Month Moving Averages


Max Temperature 12-Month MA | 1 of 6
Daily Data Points and Averages Throughout the Year


Average Max Temperature Throughout Year | 1 of 5
