Climate for Station: Winnemucca Ap, Nevada, United States
Loading live weather...
Climate Analysis & Overview
Winnemucca Airport, situated in Nevada's arid landscape, reveals a nuanced climate profile with a notable warming trend over the past decade. The region's precipitation has become more evenly distributed, indicating shifts in local weather patterns.
Desert Climate Dynamics
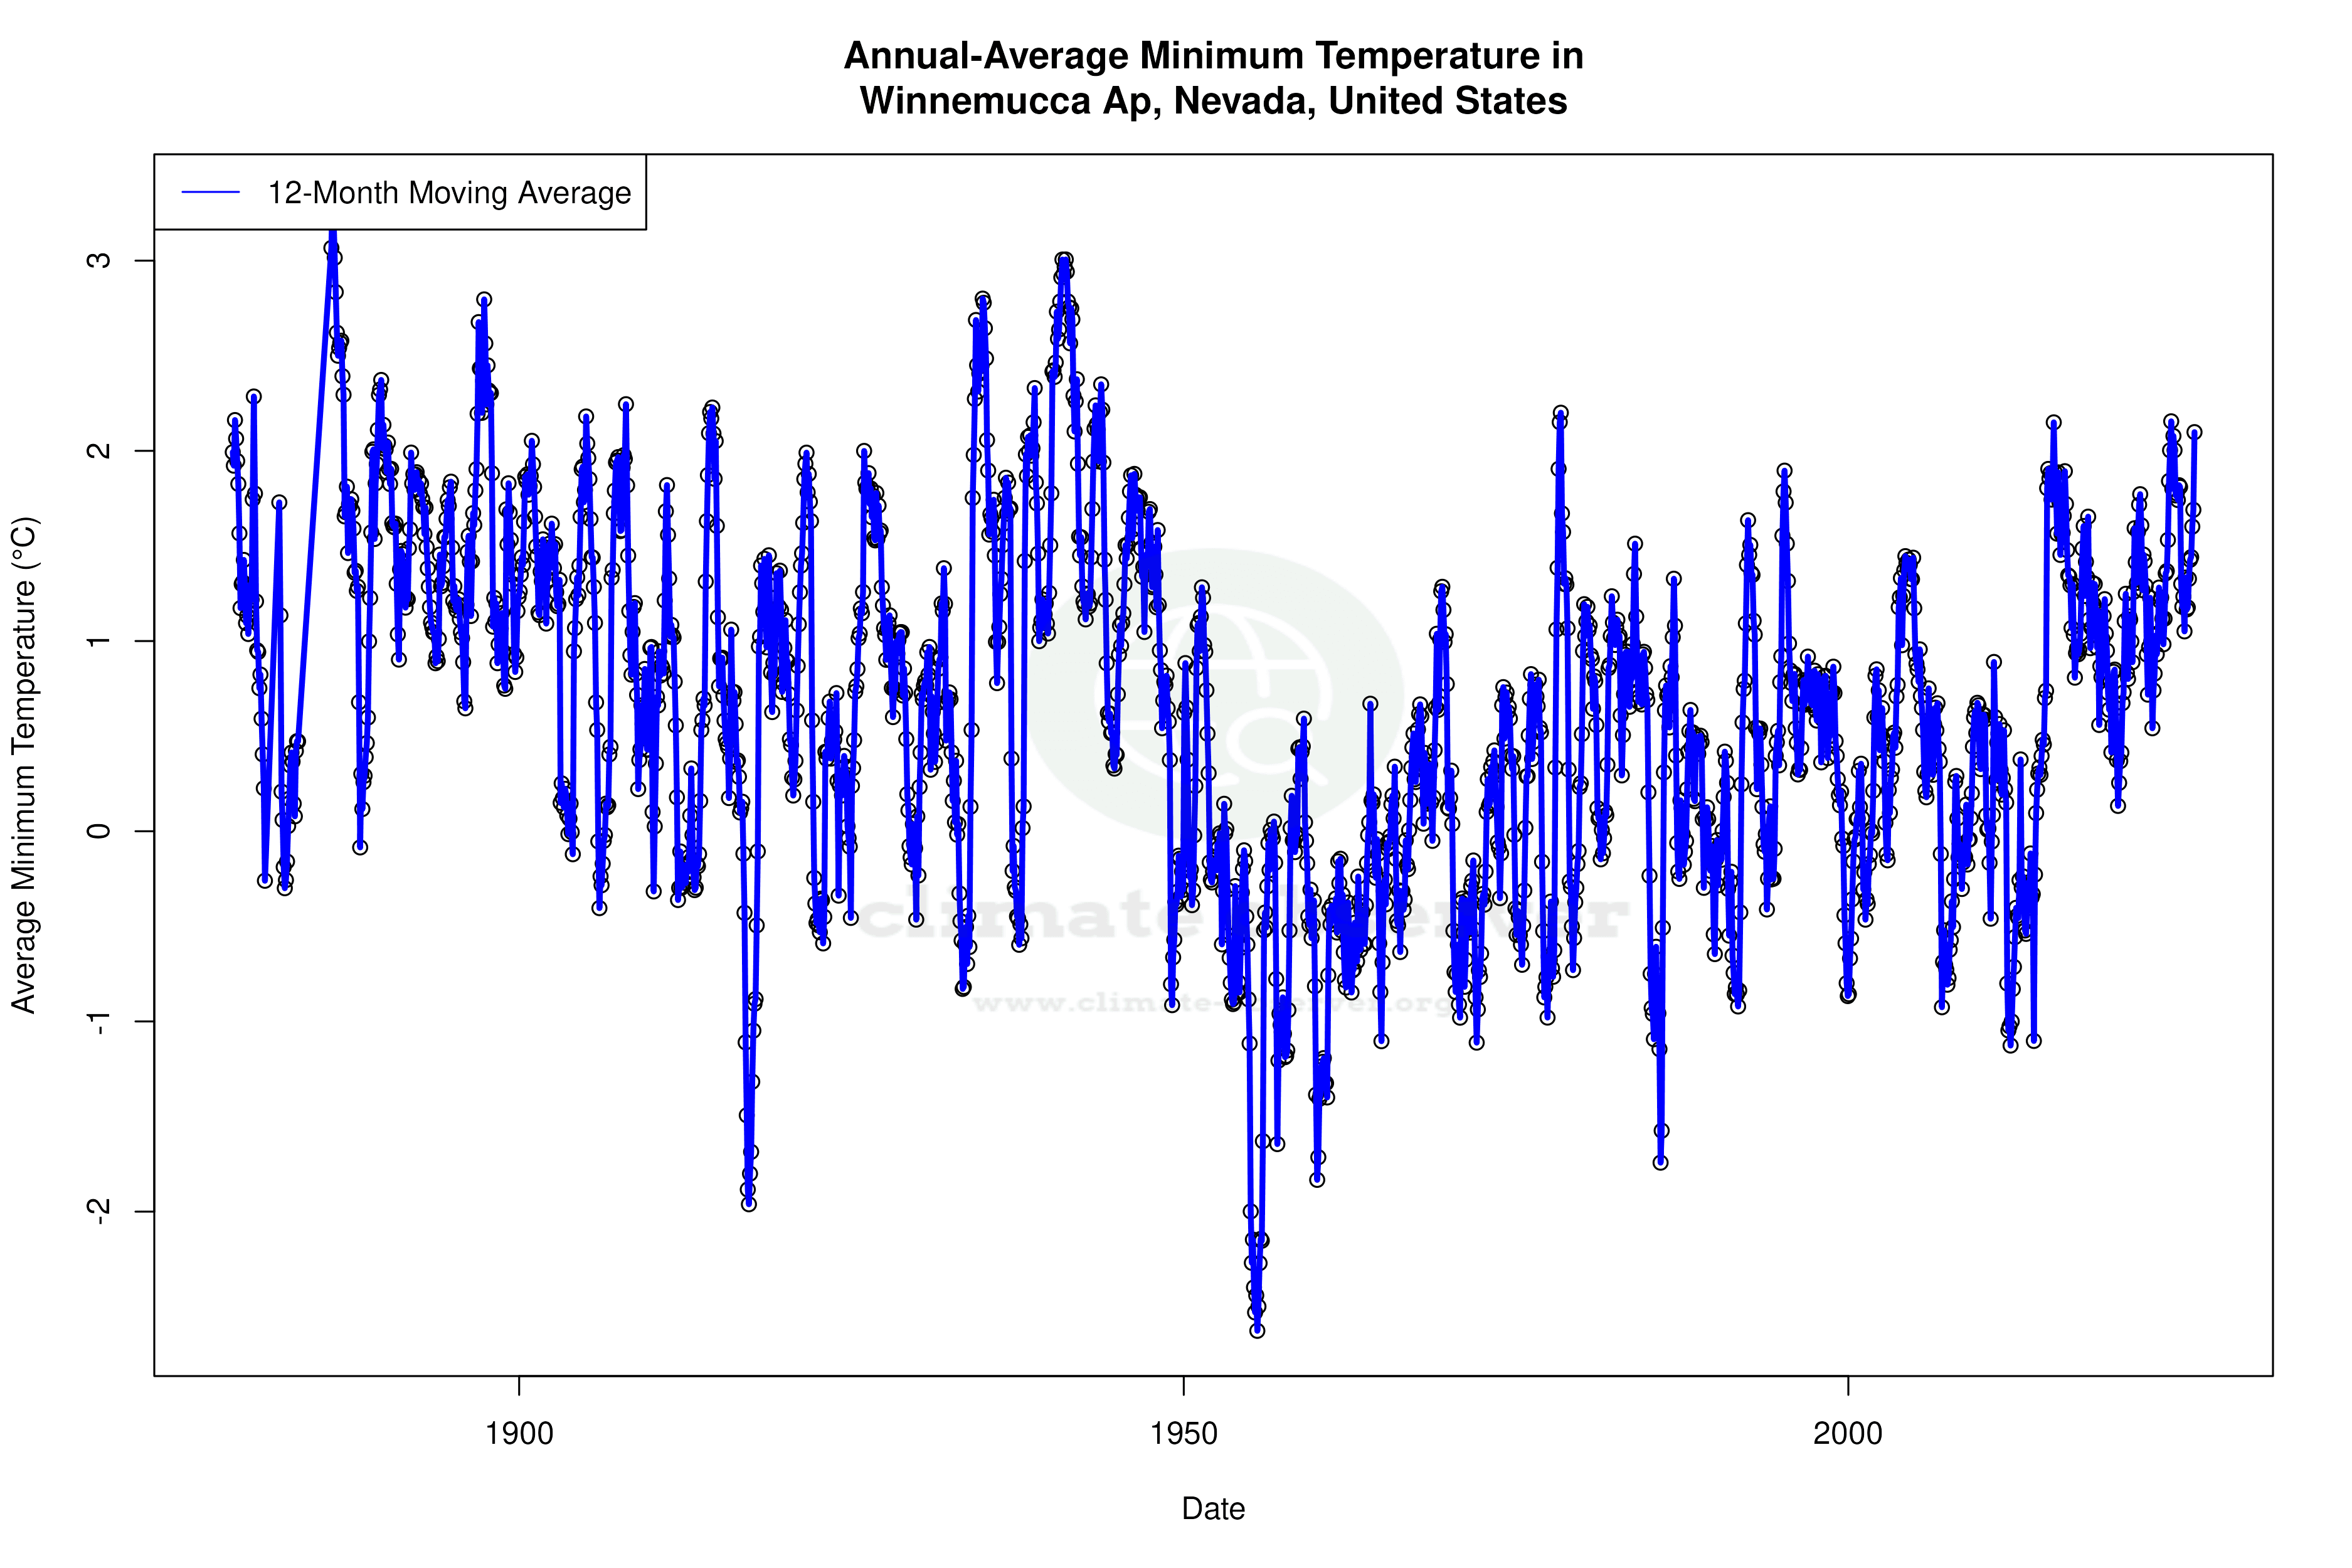
Winnemucca Airport lies within a semi-arid region classified under the Köppen climate system as BSk, characterised by hot summers and cold winters. The surrounding geography, with its expansive desert plains and distant mountain ranges, plays a significant role in moderating temperature extremes and precipitation patterns. Over the past decade, the area has experienced a warming trend, with average high temperatures increasing by 0.82°C (1.48°F) and lows by 0.33°C (0.59°F). This recent warming is more pronounced than the all-time trend, which shows a modest rise in highs of 0.21°C (0.38°F), while lows have slightly cooled by 0.06°C (0.11°F).
Temperature Extremes and Records
The all-time temperature records at Winnemucca Airport highlight the region's climatic variability. The highest recorded temperature is 42.8°C (109.0°F), while the lowest plummets to -38.3°C (-36.9°F). These extremes underscore the thermal oscillations typical of desert climates, where daytime heating and nighttime cooling are pronounced due to the lack of moisture in the air.
Precipitation Patterns and Distribution
The Precipitation Concentration Index (PCI) is a measure of how precipitation is distributed over time. A decrease in PCI from a baseline of 14.1 to 11.7 indicates a more even distribution of rainfall events, suggesting a shift towards less concentrated precipitation. This change could be attributed to broader climatic shifts affecting the region, potentially influenced by global climate patterns. A PCI below 10 would indicate very even distribution, so the current value suggests moderate evenness in rainfall.
Regional Climate Implications
The observed warming trend in Winnemucca aligns with broader regional climate goals aimed at understanding and mitigating the impacts of climate change. As the United States continues to address these challenges, the data from stations like Winnemucca Airport provide critical insights into localised climatic shifts. The more even distribution of precipitation could affect water resource management and agricultural practices in the area, necessitating adaptive strategies to maintain resilience in the face of changing weather patterns.
Future Climate Considerations
Given the observed trends, Winnemucca Airport serves as a valuable indicator of the desert region's response to broader climatic changes. The warming trend over the past decade, combined with a more evenly distributed precipitation pattern, suggests potential shifts in local ecosystems and human activities. Continuous monitoring and analysis will be essential to understanding the long-term implications of these changes and informing policy decisions.
Station Statistics
10-Year Trend
High: +2.87 °F/decade
Low: +1.37 °F/decade
Rain: -0.004 in/decade
25-Year Trend
High: +0.89 °F/decade
Low: +0.71 °F/decade
Rain: +0.002 in/decade
50-Year Trend
High: +0.40 °F/decade
Low: +0.31 °F/decade
Rain: +0.000 in/decade
All-Time Trend
High: +0.31 °F/decade
Low: -0.13 °F/decade
Rain: -0.000 in/decade
Percentage Above-Average Days
Last 12 Months: 56.7%
This Year: 79.6%
Precipitation Concentration Index (PCI) ℹ️
Last 12 Months: 11.7
Historical Average: 14.8
Percentile Rank of Last 12 Months ℹ️
High: 91st percentile
Low: 79th percentile
Rain: 24th percentile
Change in Variance ℹ️
High: +5.6%
Low: -3.0%
Intraday: +8.3%
Data Coverage
82.9%
First Year of Data
1880
Station Location
Historical Weather Records
| Max High | Avg High | Min High | Max Avg | Avg Avg | Min Avg | Max Low | Avg Low | Min Low | Max Precipitation | Avg Precipitation | Max Snow | Avg Snow | |
|---|---|---|---|---|---|---|---|---|---|---|---|---|---|
| Record | 109.04 °F | — | -0.94 °F | 101.84 °F | — | -13.90 °F | 73.94 °F | — | -36.94 °F | 1.58 in | — | 10.91 in | — |
| January | 68.00 °F | 40.79 °F | -0.94 °F | 57.38 °F | 30.34 °F | -5.62 °F | 48.92 °F | 17.58 °F | -36.04 °F | 1.34 in | 0.03 in | 10.91 in | 0.20 in |
| February | 73.94 °F | 46.52 °F | 8.06 °F | 57.02 °F | 35.47 °F | -2.20 °F | 48.02 °F | 22.56 °F | -27.94 °F | 0.99 in | 0.03 in | 9.21 in | 0.16 in |
| March | 87.08 °F | 53.95 °F | 26.06 °F | 68.36 °F | 41.51 °F | 19.94 °F | 50.68 °F | 26.45 °F | -2.92 °F | 0.90 in | 0.03 in | 8.70 in | 0.13 in |
| April | 89.96 °F | 61.98 °F | 32.00 °F | 72.14 °F | 47.64 °F | 27.86 °F | 53.96 °F | 31.39 °F | 6.08 °F | 0.90 in | 0.03 in | 6.50 in | 0.06 in |
| May | 100.04 °F | 71.13 °F | 37.04 °F | 81.50 °F | 56.60 °F | 34.52 °F | 62.37 °F | 38.76 °F | 10.04 °F | 1.13 in | 0.03 in | 5.20 in | 0.01 in |
| June | 105.98 °F | 81.22 °F | 42.08 °F | 89.42 °F | 66.88 °F | 40.46 °F | 71.96 °F | 46.38 °F | 23.00 °F | 1.49 in | 0.02 in | 3.11 in | 0.00 in |
| July | 109.04 °F | 91.80 °F | 60.08 °F | 101.84 °F | 75.57 °F | 52.70 °F | 73.94 °F | 53.03 °F | 28.94 °F | 0.85 in | 0.01 in | 0.00 in | 0.00 in |
| August | 107.96 °F | 89.77 °F | 57.02 °F | 88.34 °F | 72.29 °F | 49.64 °F | 73.04 °F | 49.76 °F | 26.06 °F | 0.73 in | 0.01 in | 0.00 in | 0.00 in |
| September | 105.98 °F | 79.72 °F | 42.98 °F | 85.82 °F | 62.14 °F | 35.96 °F | 66.92 °F | 40.35 °F | 12.02 °F | 1.02 in | 0.01 in | 0.98 in | 0.00 in |
| October | 93.92 °F | 66.79 °F | 33.08 °F | 71.06 °F | 48.82 °F | 19.04 °F | 55.94 °F | 30.68 °F | -2.02 °F | 1.58 in | 0.02 in | 5.98 in | 0.01 in |
| November | 77.00 °F | 52.41 °F | 17.06 °F | 59.90 °F | 37.42 °F | 4.28 °F | 51.98 °F | 23.09 °F | -9.94 °F | 1.56 in | 0.03 in | 7.80 in | 0.08 in |
| December | 69.98 °F | 42.27 °F | 1.04 °F | 54.32 °F | 30.10 °F | -13.90 °F | 51.98 °F | 18.19 °F | -36.94 °F | 1.11 in | 0.03 in | 10.59 in | 0.18 in |
Data Visualisations
Remove WatermarksCurrent Year Climate Trends vs Historical


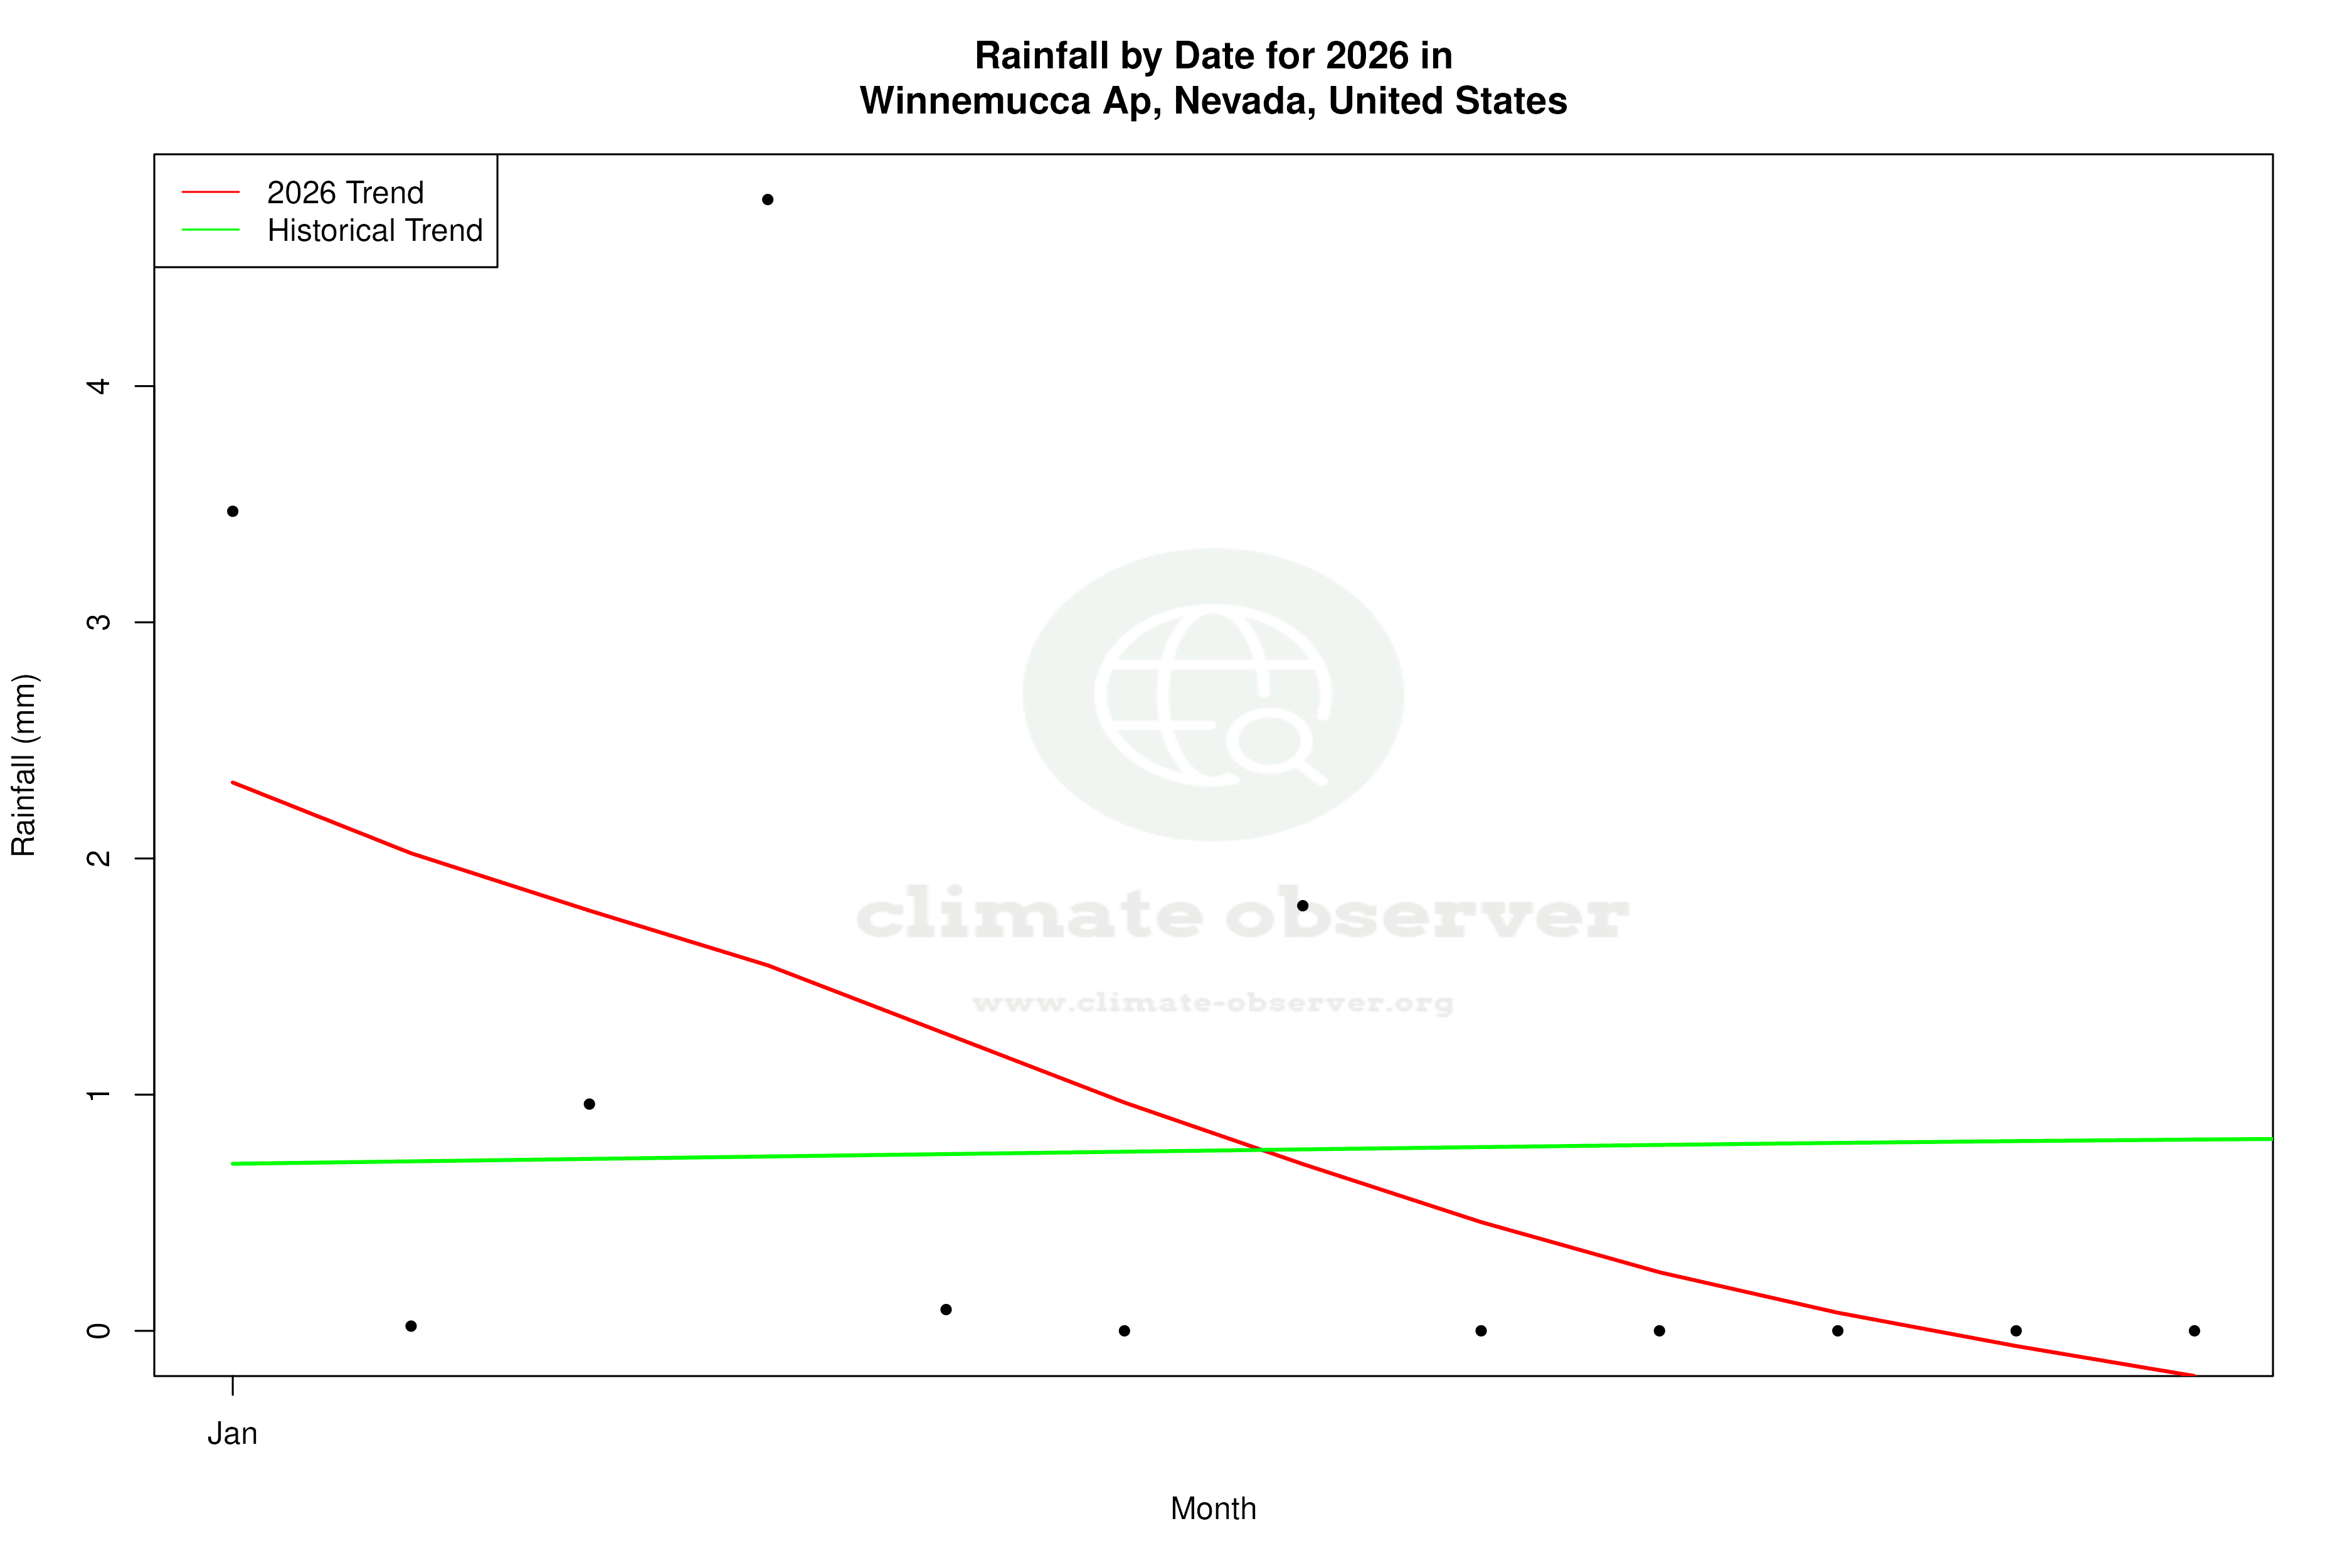


Max Temperature this Year | 1 of 6
Climate 12-Month Moving Averages
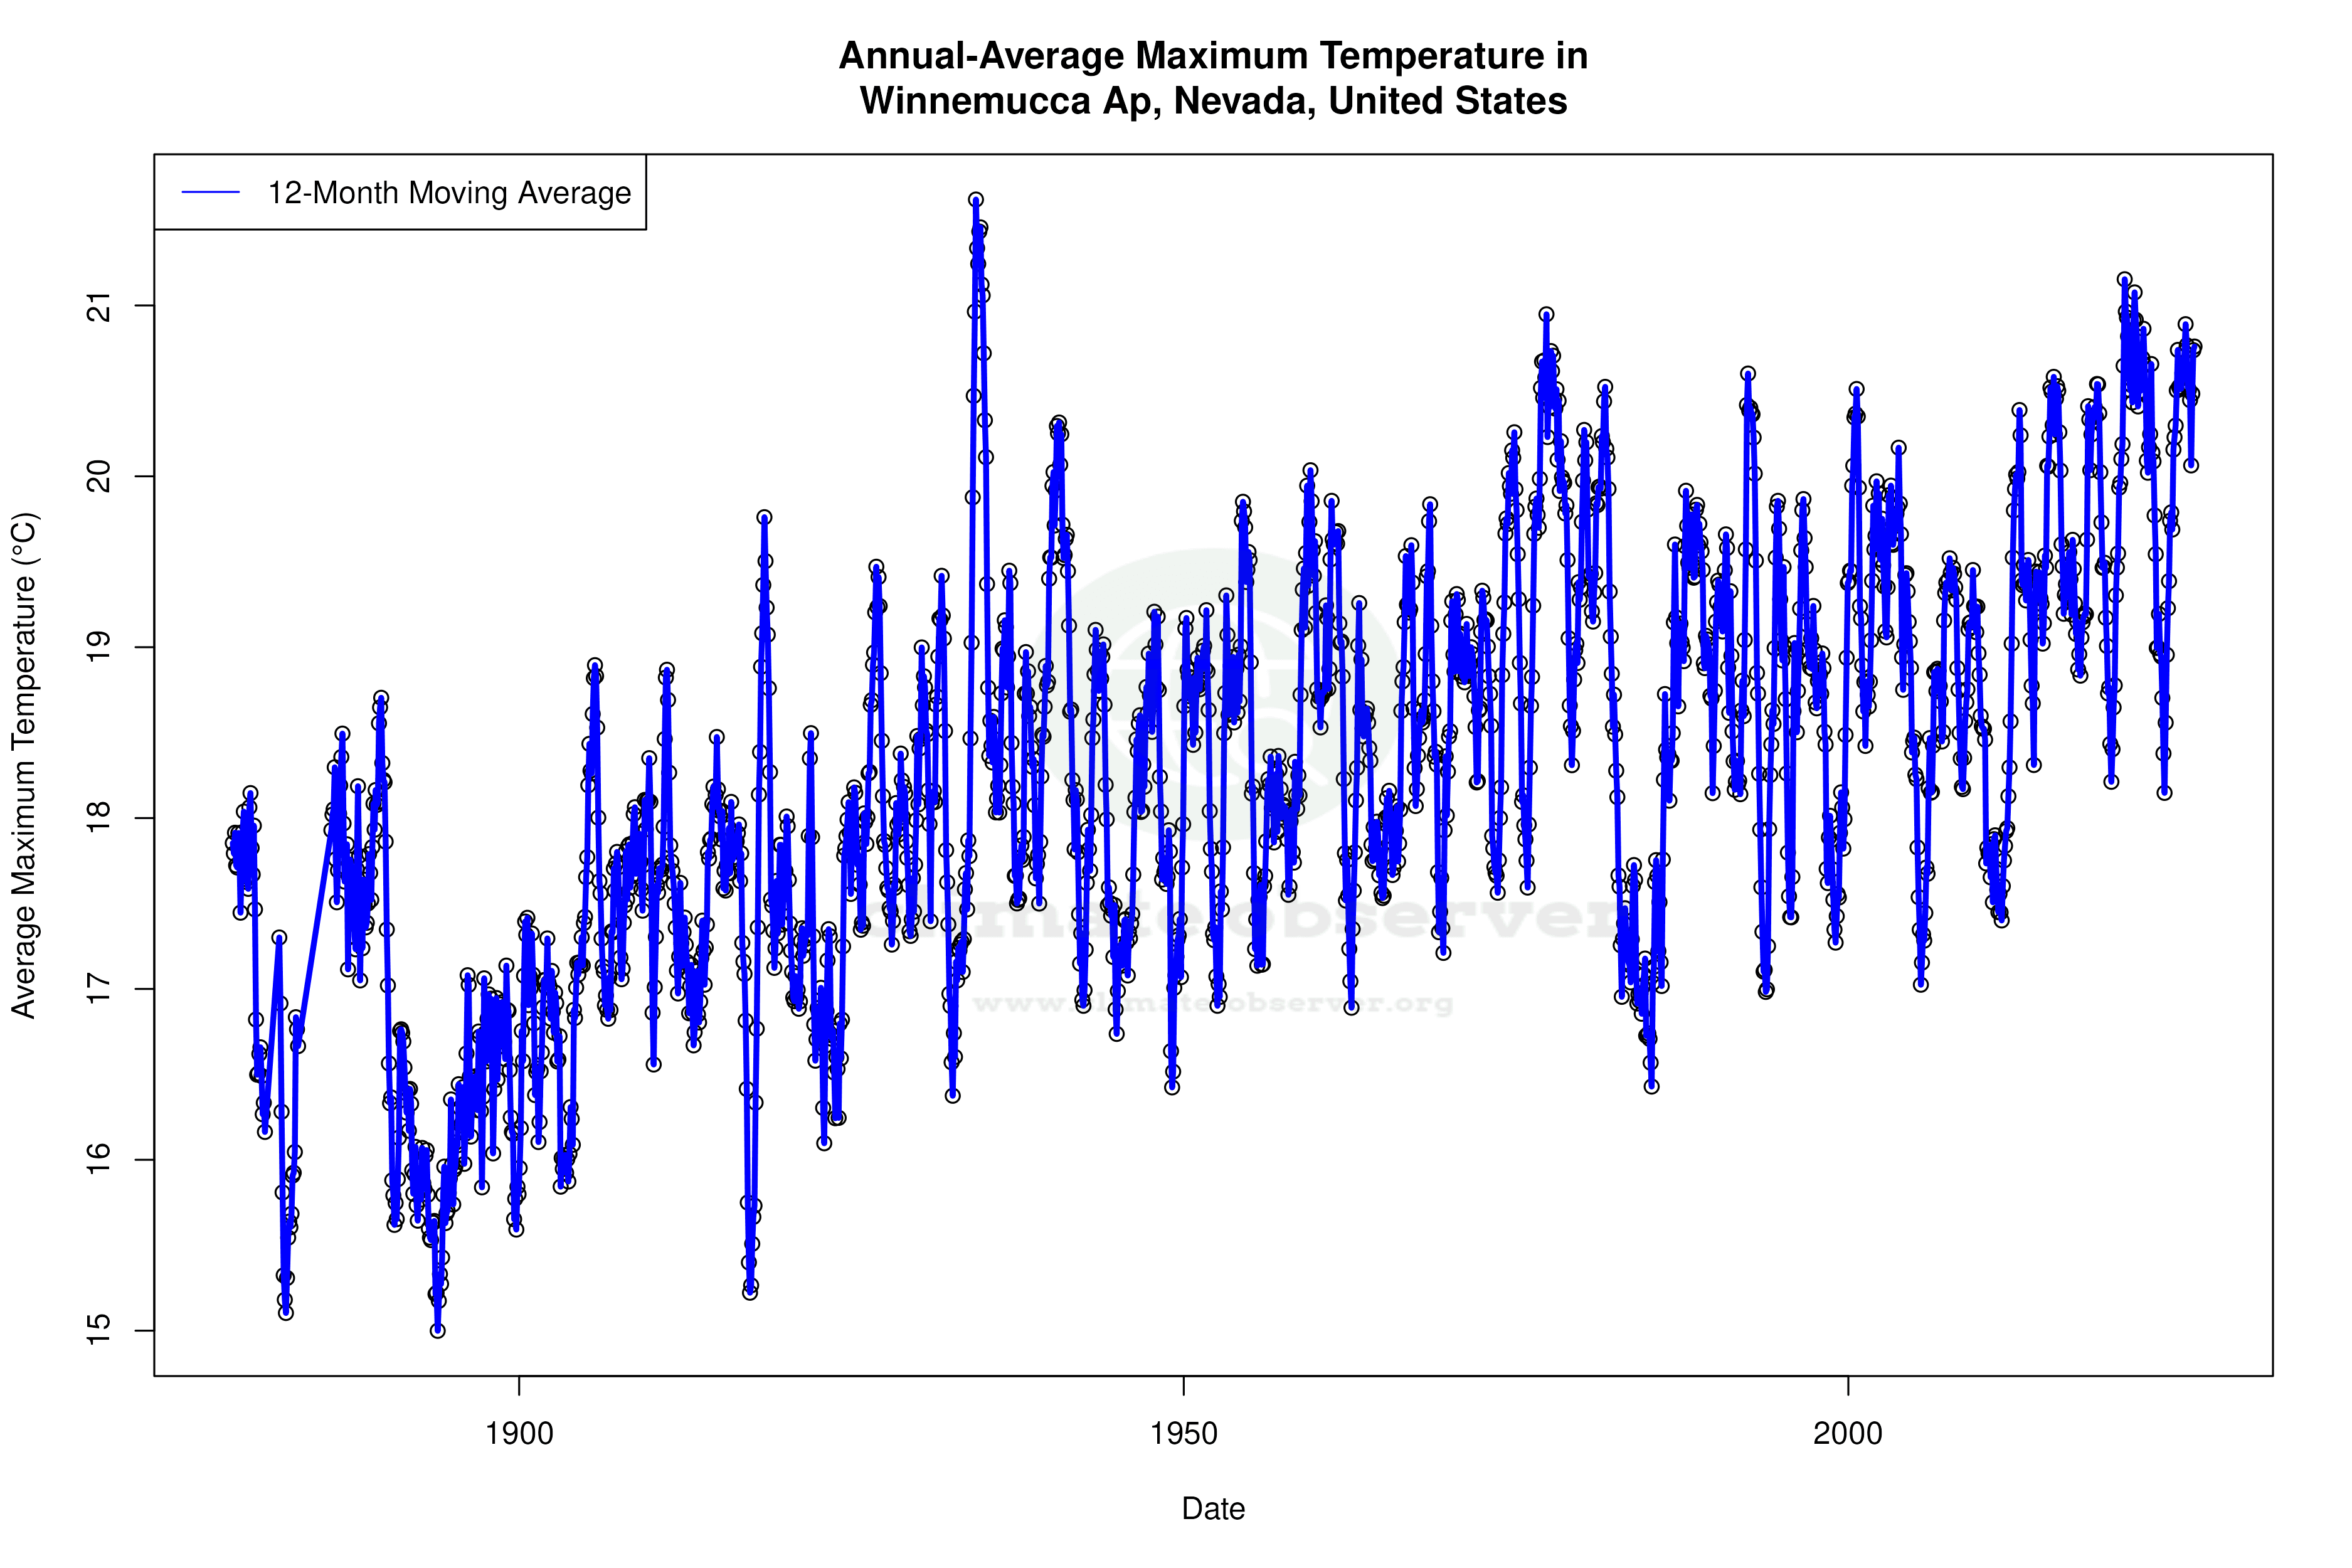


Max Temperature 12-Month MA | 1 of 6
Daily Data Points and Averages Throughout the Year


Average Max Temperature Throughout Year | 1 of 5
