Climate for Station: Miami Beach, Florida, United States
Loading live weather...
Climate Analysis & Overview
Miami Beach is experiencing a complex climate narrative, with a notable warming trend in high temperatures over the past decade, contrasted by a slight cooling in low temperatures. Precipitation patterns have marginally shifted towards more even distribution, reflecting subtle changes in the local climate dynamics.
Tropical Climate Dynamics
Miami Beach, located at latitude 25.8064 and longitude -80.1333, falls under the tropical monsoon climate classification (Am) according to the Köppen system. This classification is characterised by a pronounced wet season and a relatively dry season, influenced by its coastal position adjacent to the Atlantic Ocean. The proximity to water bodies moderates temperature fluctuations, contributing to its generally warm climate.
Temperature Trends: A Mixed Picture
Over the past decade, Miami Beach has experienced a significant warming trend in high temperatures, with an increase of 1.53°C (2.75°F). This recent warming trend is more pronounced than the all-time high temperature trend, which shows a modest rise of 0.15°C (0.27°F). Conversely, the low temperatures have exhibited a cooling trend over the same ten-year period, decreasing by 0.63°C (1.13°F). However, the all-time low temperature trend indicates a slight warming of 0.04°C (0.07°F). These contrasting trends suggest a complex interplay between regional climate factors and broader climatic changes.
Precipitation Patterns: Marginal Shifts
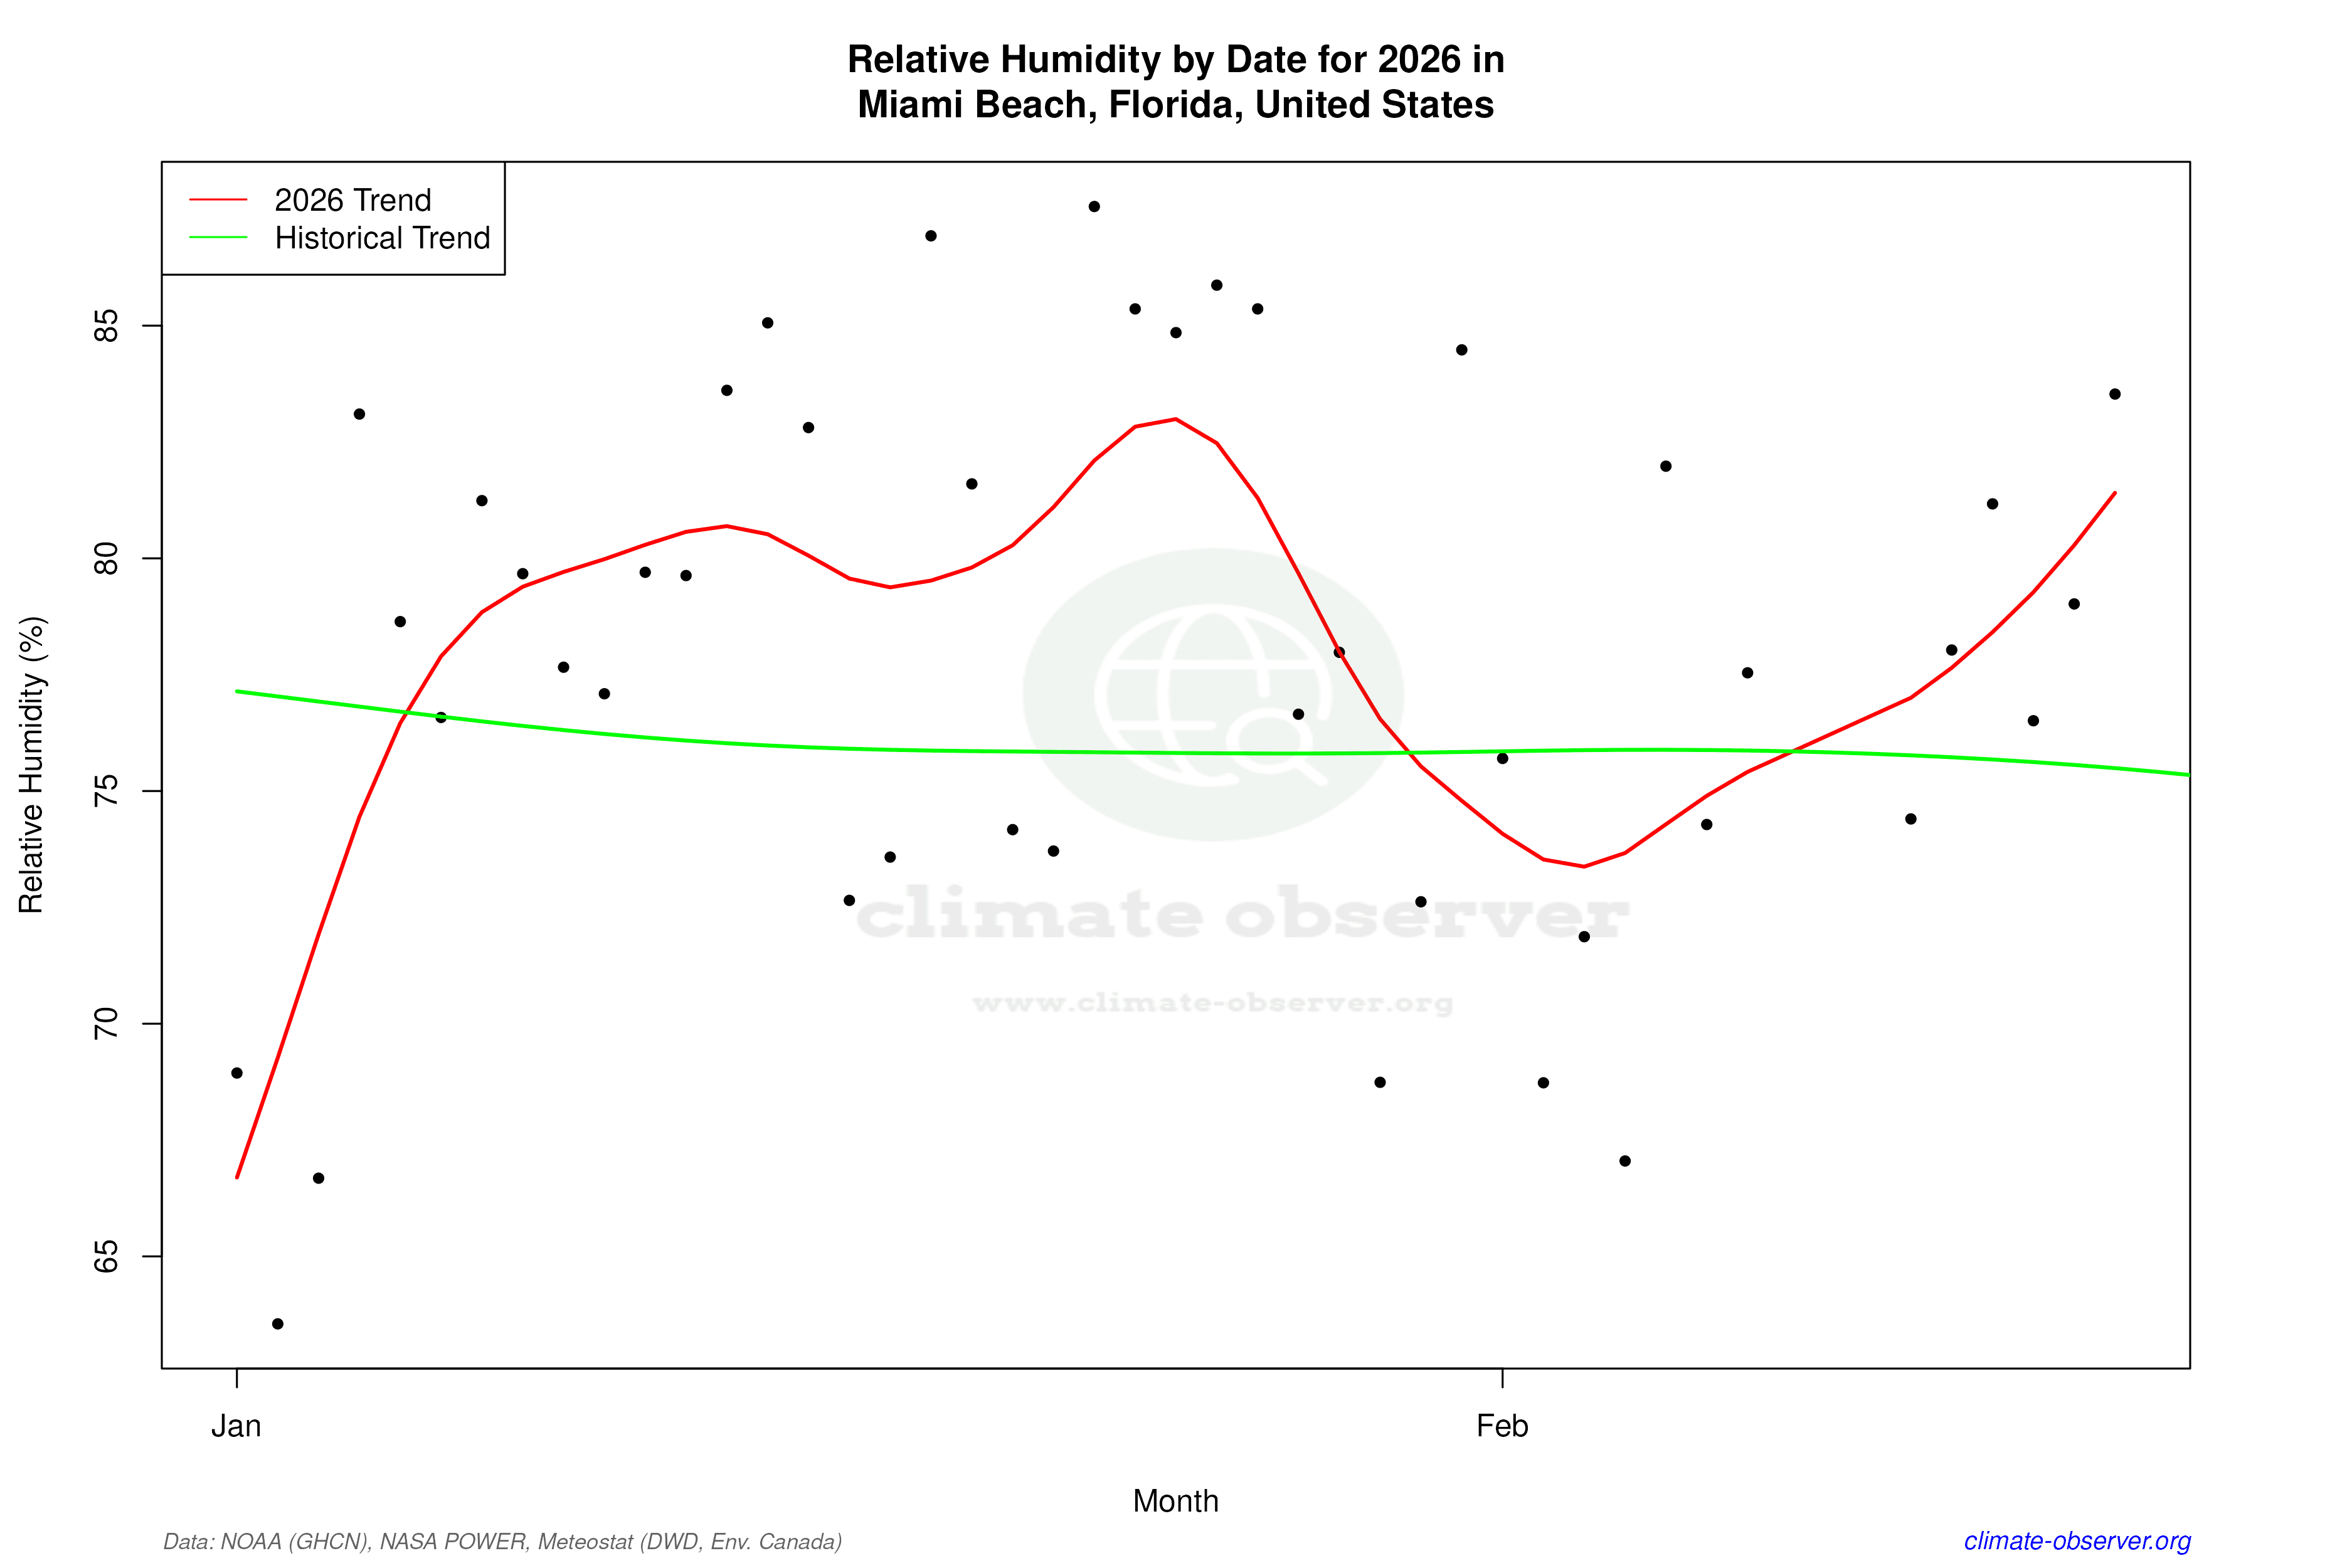
The Precipitation Concentration Index (PCI) is a measure of how precipitation is distributed over time, with higher values indicating more concentrated rainfall events. Miami Beach's PCI has slightly decreased from a baseline of 13.62 to a current value of 13.50. This marginal decrease suggests that precipitation is becoming more evenly distributed, which may influence local water management strategies and ecosystem dynamics. Such changes, though subtle, can have significant implications for urban planning and infrastructure resilience.
Record Extremes and Climate Implications
Miami Beach has recorded an absolute maximum temperature of 36.7°C (98.1°F) and a minimum of 0.0°C (32.0°F). These extremes highlight the potential for significant temperature variability, even within a generally warm climate zone. The recorded maximum underscores the importance of addressing heat-related challenges, particularly in urban areas where heat islands can exacerbate high temperatures.
Regional Climate Context
The climate trends in Miami Beach are reflective of broader regional patterns observed across the southeastern United States. Efforts to mitigate climate change impacts are crucial, especially considering recent weather events such as hurricanes, which have been influenced by warming sea surface temperatures. Understanding these localised trends is essential for aligning with national climate goals aimed at reducing greenhouse gas emissions and enhancing climate resilience.
Station Statistics
10-Year Trend
High: +3.97 °F/decade
Low: +0.82 °F/decade
Rain: -0.011 in/decade
25-Year Trend
High: +0.72 °F/decade
Low: +0.33 °F/decade
Rain: +0.003 in/decade
50-Year Trend
High: +0.66 °F/decade
Low: +0.05 °F/decade
Rain: +0.011 in/decade
All-Time Trend
High: +0.27 °F/decade
Low: +0.09 °F/decade
Rain: +0.006 in/decade
Percentage Above-Average Days
Last 12 Months: 65.5%
This Year: 62.2%
Precipitation Concentration Index (PCI) ℹ️
Last 12 Months: 14.1
Historical Average: 14.0
Percentile Rank of Last 12 Months ℹ️
High: 98th percentile
Low: 78th percentile
Rain: 61st percentile
Change in Variance ℹ️
High: +19.0%
Low: -10.4%
Intraday: -3.3%
Data Coverage
89.8%
First Year of Data
1927
Station Location
Historical Weather Records
| Max High | Avg High | Min High | Max Avg | Avg Avg | Min Avg | Max Low | Avg Low | Min Low | Max Precipitation | Avg Precipitation | Max Snow | Avg Snow | |
|---|---|---|---|---|---|---|---|---|---|---|---|---|---|
| Record | 98.06 °F | — | 48.76 °F | 89.78 °F | — | 40.46 °F | 87.08 °F | — | 32.00 °F | 6.91 in | — | 0.00 in | — |
| January | 87.98 °F | 74.43 °F | 50.81 °F | 79.70 °F | 68.19 °F | 40.46 °F | 77.00 °F | 62.40 °F | 32.00 °F | 1.99 in | 0.06 in | 0.00 in | 0.00 in |
| February | 89.06 °F | 75.45 °F | 51.98 °F | 80.96 °F | 70.04 °F | 43.34 °F | 77.00 °F | 63.86 °F | 33.98 °F | 2.08 in | 0.07 in | 0.00 in | 0.00 in |
| March | 91.94 °F | 77.51 °F | 53.96 °F | 84.92 °F | 72.84 °F | 50.90 °F | 80.06 °F | 66.68 °F | 32.00 °F | 2.89 in | 0.07 in | 0.00 in | 0.00 in |
| April | 95.00 °F | 80.15 °F | 64.04 °F | 86.00 °F | 76.05 °F | 60.39 °F | 80.06 °F | 70.32 °F | 48.02 °F | 6.91 in | 0.10 in | 0.00 in | 0.00 in |
| May | 98.06 °F | 83.19 °F | 68.00 °F | 87.62 °F | 79.56 °F | 67.82 °F | 82.04 °F | 73.87 °F | 55.94 °F | 4.48 in | 0.18 in | 0.00 in | 0.00 in |
| June | 98.06 °F | 86.12 °F | 71.06 °F | 88.16 °F | 81.96 °F | 70.88 °F | 84.92 °F | 76.58 °F | 64.04 °F | 6.64 in | 0.31 in | 0.00 in | 0.00 in |
| July | 98.06 °F | 87.73 °F | 78.08 °F | 89.78 °F | 83.46 °F | 74.66 °F | 87.08 °F | 78.17 °F | 66.02 °F | 5.49 in | 0.21 in | 0.00 in | 0.00 in |
| August | 98.06 °F | 88.25 °F | 78.08 °F | 88.70 °F | 83.48 °F | 75.02 °F | 84.92 °F | 78.36 °F | 66.92 °F | 6.41 in | 0.25 in | 0.00 in | 0.00 in |
| September | 96.08 °F | 86.88 °F | 77.00 °F | 89.24 °F | 82.28 °F | 73.40 °F | 84.02 °F | 77.37 °F | 66.92 °F | 6.07 in | 0.30 in | 0.00 in | 0.00 in |
| October | 95.00 °F | 83.68 °F | 68.00 °F | 87.26 °F | 79.35 °F | 64.58 °F | 84.92 °F | 74.22 °F | 55.04 °F | 5.85 in | 0.21 in | 0.00 in | 0.00 in |
| November | 91.04 °F | 79.39 °F | 62.96 °F | 84.02 °F | 74.69 °F | 55.04 °F | 82.04 °F | 69.34 °F | 39.02 °F | 6.70 in | 0.09 in | 0.00 in | 0.00 in |
| December | 89.06 °F | 75.93 °F | 48.76 °F | 81.14 °F | 70.68 °F | 42.08 °F | 78.08 °F | 64.87 °F | 32.00 °F | 2.81 in | 0.06 in | 0.00 in | 0.00 in |
Data Visualisations
Remove WatermarksCurrent Year Climate Trends vs Historical
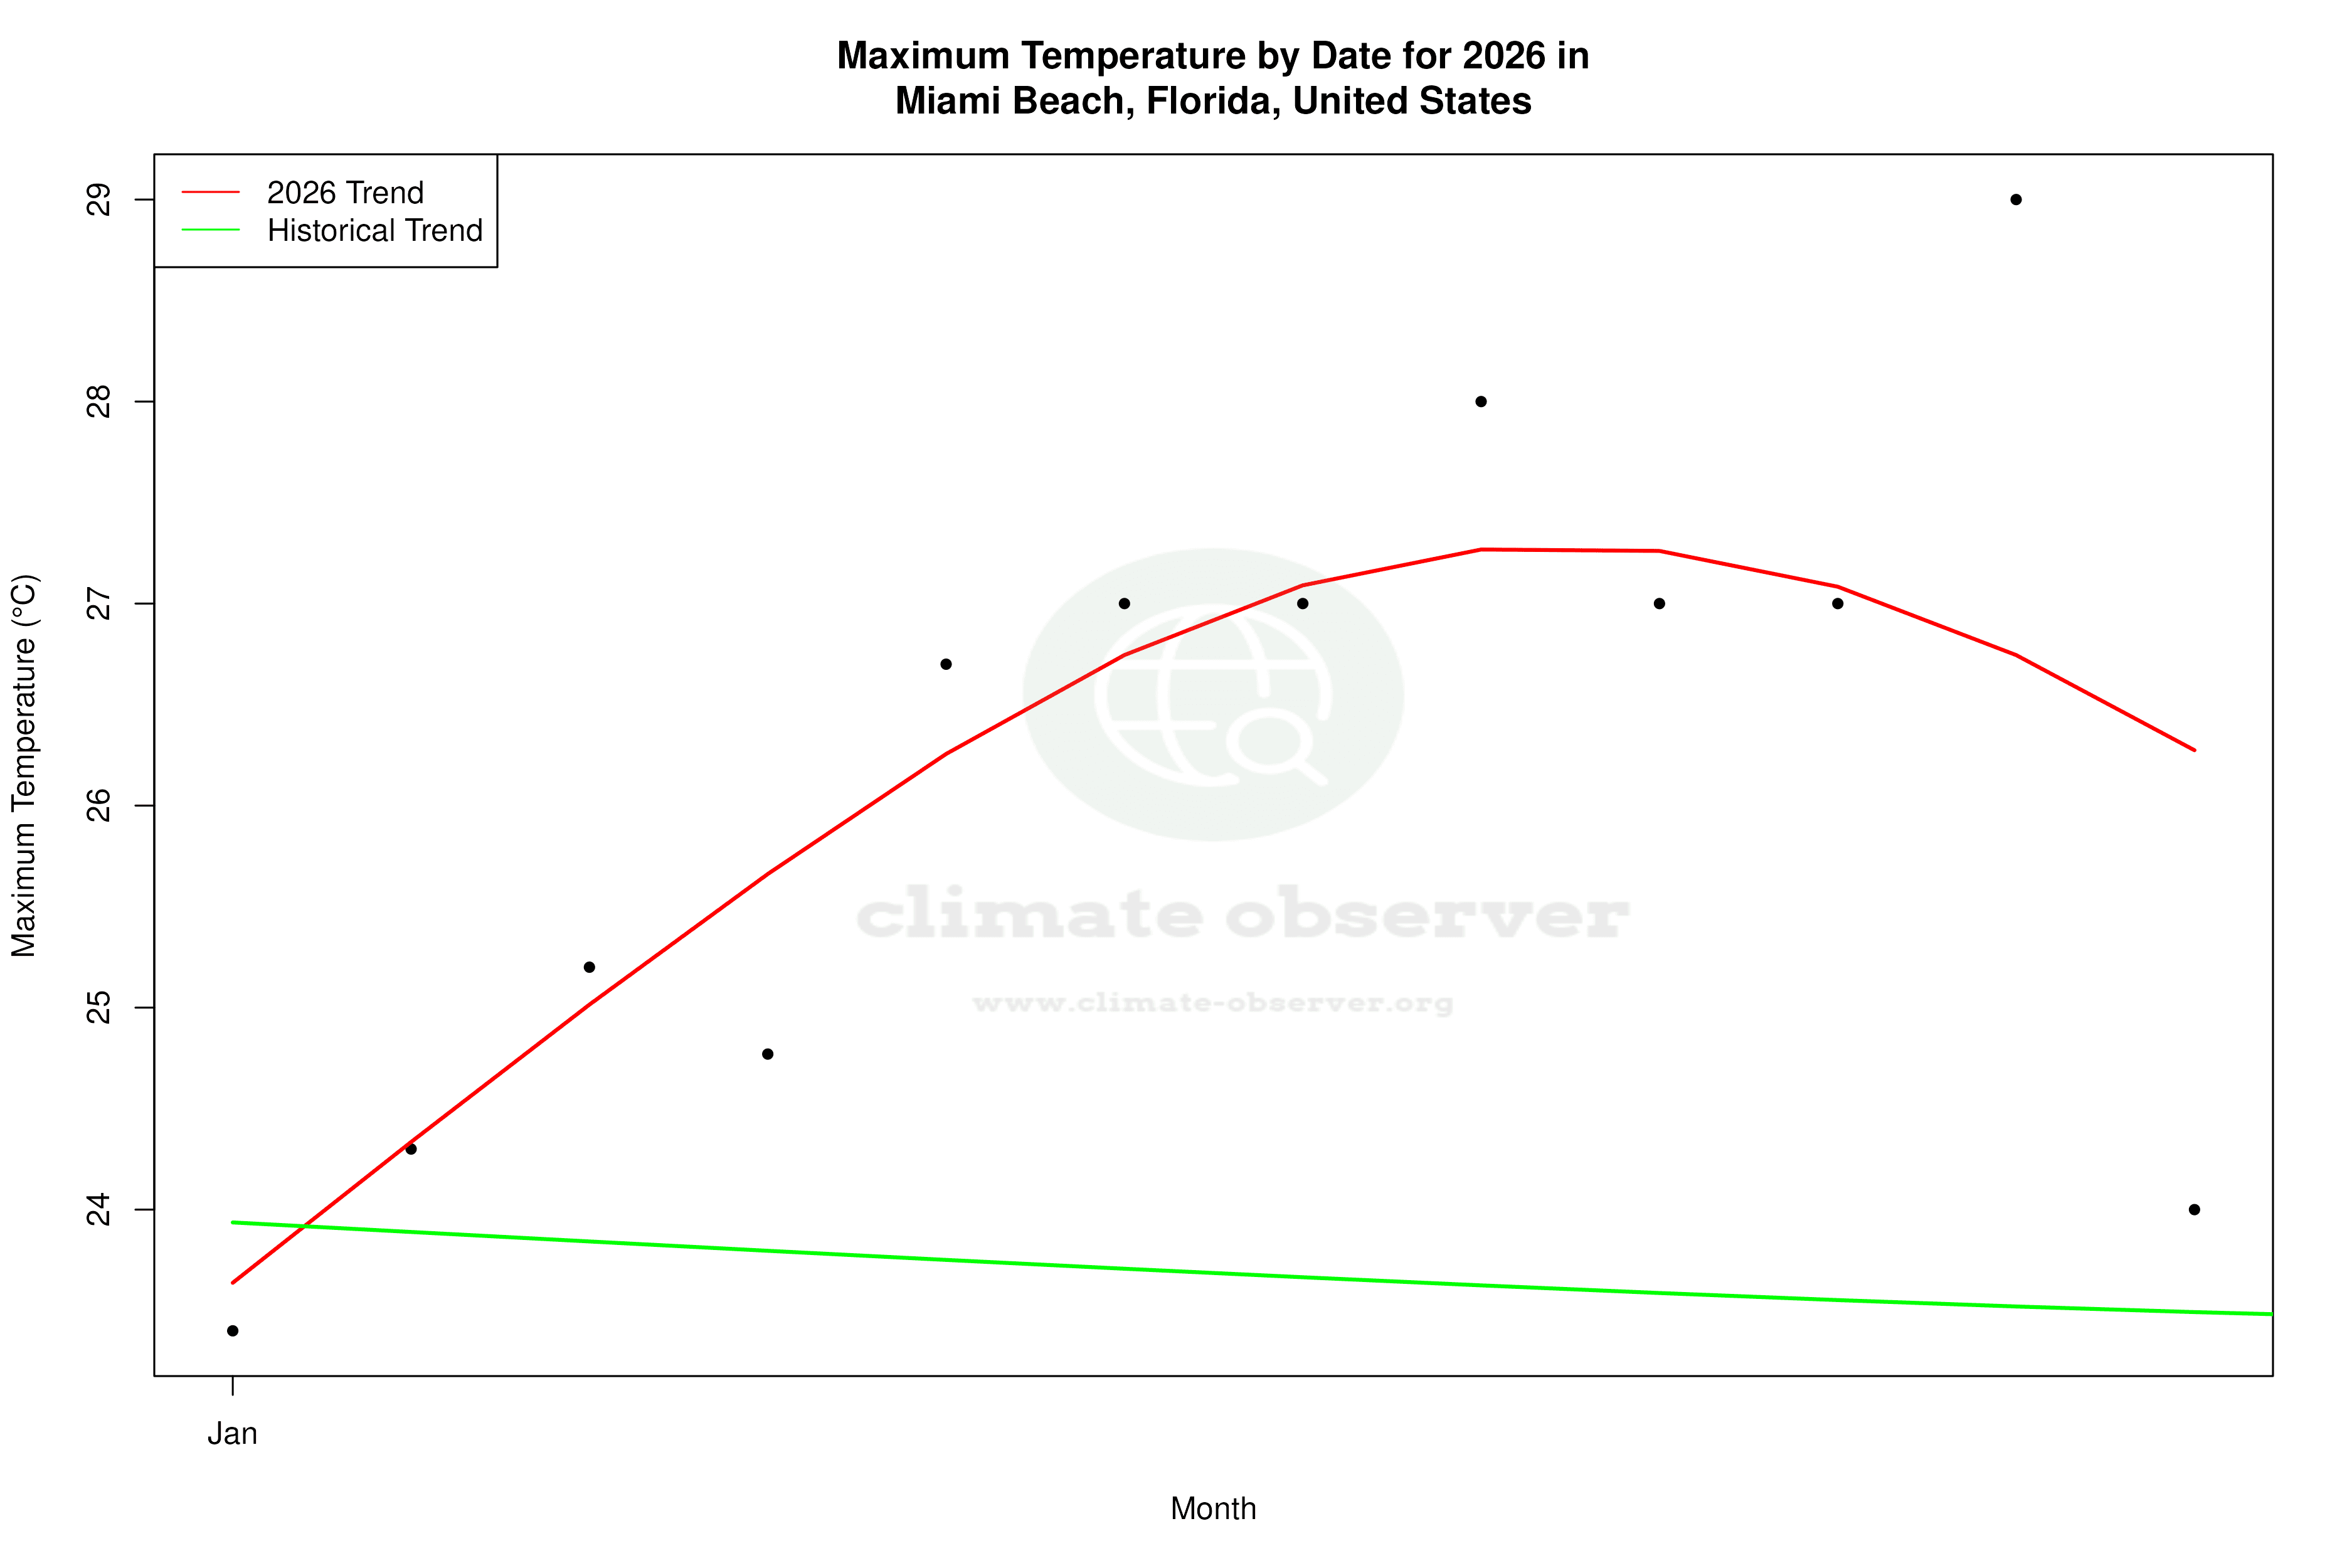


Max Temperature this Year | 1 of 6
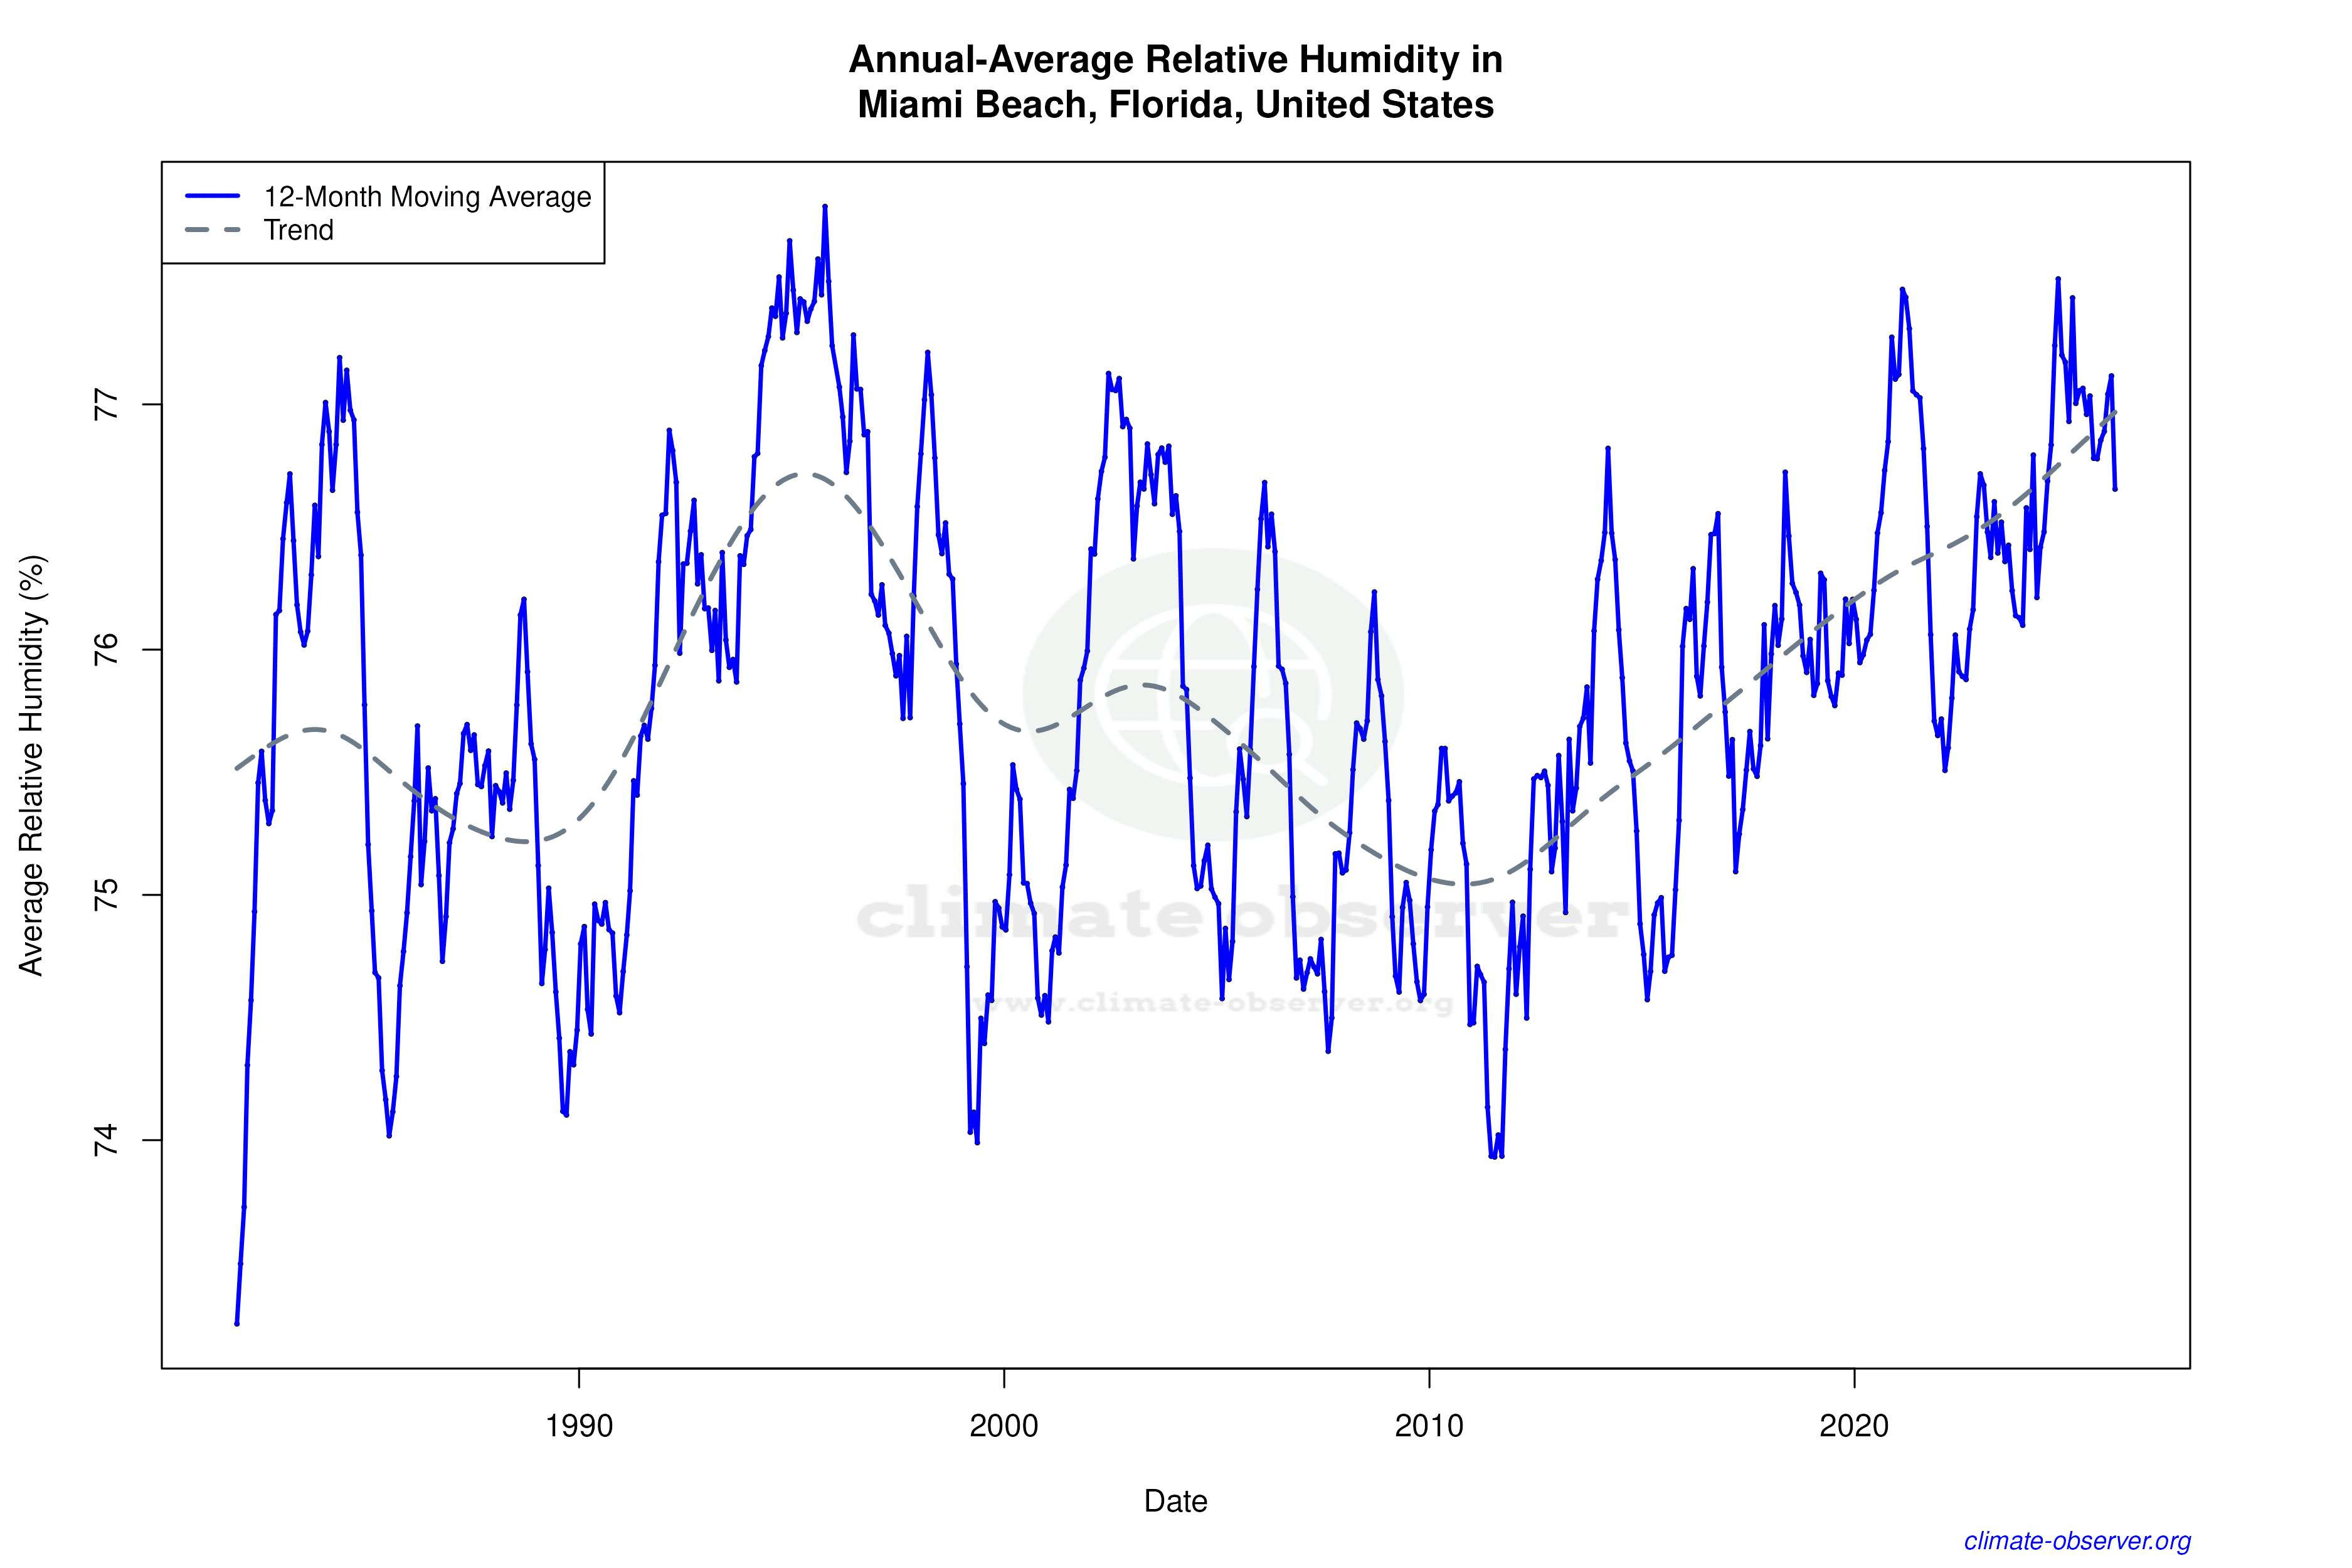
Climate 12-Month Moving Averages


Max Temperature 12-Month MA | 1 of 6
Daily Data Points and Averages Throughout the Year


Average Max Temperature Throughout Year | 1 of 5
