Climate for Station: El Dorado Goodwin Fld, Arkansas, United States
Loading live weather...
Climate Analysis & Overview
The climate profile for El Dorado Goodwin Field reveals a complex interplay of warming and cooling trends, with recent years showing a marked divergence from historical patterns. Precipitation has become more evenly distributed, indicating a shift towards less extreme rainfall events.
Climate Classification and Geographic Influence
El Dorado Goodwin Field, located in Union County, Arkansas, falls under the humid subtropical climate classification (Cfa) according to the Köppen system. This region is characterised by hot, humid summers and mild to cool winters. The local geography, including the proximity to the Ouachita Mountains and various river systems, influences its weather patterns by moderating temperature extremes and contributing to humidity levels. These geographical features play a significant role in shaping the area's climatic responses to broader environmental changes.
Temperature Trends: A Mixed Picture
The temperature trends at El Dorado Goodwin Field present a nuanced picture. Over the past decade, there has been a warming trend in high temperatures, with an increase of 0.40°C (0.72°F). In contrast, low temperatures have shown a cooling trend, decreasing by 0.70°C (1.26°F). However, when examining the all-time trends, both high and low temperatures have experienced a slight cooling, with highs falling by 0.04°C (0.07°F) and lows by 0.02°C (0.04°F). This divergence between short-term and long-term trends highlights the complexity of climatic changes in the region.
Record Extremes and Their Implications
The station's record temperatures underscore the variability of its climate. The highest recorded temperature is 44.4°C (111.9°F), while the lowest is -23.3°C (-9.9°F). These extremes reflect the potential for significant temperature fluctuations, which can impact local ecosystems and human activities. Understanding these records is crucial for preparing for future climate variability, especially in the context of regional climate goals aimed at mitigating extreme weather impacts.
Precipitation Patterns: A Shift Towards Evenness
The Precipitation Concentration Index (PCI) at El Dorado Goodwin Field has shown a decrease from a baseline of 11.78 to a current value of 9.90. This indicates a shift towards more evenly distributed precipitation events, moving away from highly concentrated rainfall. Such a change suggests fewer instances of intense rainfall, which can reduce the risk of flooding and soil erosion, aligning with broader climate adaptation strategies.
Regional Climate Context and Goals
The climate dynamics at El Dorado Goodwin Field are part of a larger narrative of climate change across the United States. Recent weather events, such as increased frequency of heatwaves and shifting precipitation patterns, underscore the importance of robust climate policies. The observed trends at this station provide valuable insights into the effectiveness of regional climate goals, such as reducing greenhouse gas emissions and enhancing climate resilience through adaptive infrastructure and community planning.
Station Statistics
10-Year Trend
High: +2.96 °F/decade
Low: +1.41 °F/decade
Rain: -0.027 in/decade
25-Year Trend
High: +0.68 °F/decade
Low: +0.67 °F/decade
Rain: -0.002 in/decade
50-Year Trend
High: +0.26 °F/decade
Low: +0.36 °F/decade
Rain: -0.003 in/decade
All-Time Trend
High: -0.05 °F/decade
Low: -0.03 °F/decade
Rain: -0.001 in/decade
Percentage Above-Average Days
Last 12 Months: 64.7%
This Year: 68.4%
Precipitation Concentration Index (PCI) ℹ️
Last 12 Months: 10.0
Historical Average: 11.2
Percentile Rank of Last 12 Months ℹ️
High: 62nd percentile
Low: 56th percentile
Rain: 31st percentile
Change in Variance ℹ️
High: -9.9%
Low: -2.7%
Intraday: -5.2%
Data Coverage
84.7%
First Year of Data
1892
Station Location
Historical Weather Records
| Max High | Avg High | Min High | Max Avg | Avg Avg | Min Avg | Max Low | Avg Low | Min Low | Max Precipitation | Avg Precipitation | Max Snow | Avg Snow | |
|---|---|---|---|---|---|---|---|---|---|---|---|---|---|
| Record | 111.92 °F | — | 14.00 °F | 93.33 °F | — | 11.34 °F | 82.94 °F | — | -9.94 °F | 10.65 in | — | 15.20 in | — |
| January | 82.94 °F | 55.40 °F | 14.00 °F | 71.96 °F | 43.12 °F | 15.98 °F | 71.06 °F | 33.84 °F | -9.94 °F | 6.15 in | 0.15 in | 9.02 in | 0.03 in |
| February | 89.06 °F | 59.79 °F | 19.94 °F | 72.32 °F | 47.61 °F | 15.62 °F | 68.00 °F | 36.76 °F | -9.04 °F | 3.99 in | 0.15 in | 4.02 in | 0.02 in |
| March | 98.96 °F | 68.06 °F | 30.02 °F | 77.54 °F | 56.01 °F | 25.70 °F | 71.06 °F | 43.77 °F | 10.94 °F | 5.85 in | 0.17 in | 5.00 in | 0.01 in |
| April | 96.08 °F | 76.22 °F | 44.06 °F | 80.96 °F | 63.56 °F | 40.30 °F | 78.08 °F | 52.11 °F | 26.06 °F | 10.65 in | 0.18 in | 0.00 in | 0.00 in |
| May | 98.96 °F | 82.73 °F | 55.04 °F | 84.69 °F | 71.49 °F | 47.12 °F | 78.08 °F | 60.37 °F | 33.98 °F | 5.20 in | 0.16 in | 0.00 in | 0.00 in |
| June | 107.96 °F | 90.23 °F | 64.04 °F | 91.69 °F | 78.62 °F | 64.04 °F | 82.04 °F | 67.97 °F | 41.00 °F | 6.37 in | 0.13 in | 0.00 in | 0.00 in |
| July | 109.94 °F | 93.04 °F | 71.06 °F | 93.33 °F | 81.75 °F | 64.76 °F | 80.96 °F | 71.28 °F | 57.02 °F | 5.50 in | 0.12 in | 0.00 in | 0.00 in |
| August | 111.92 °F | 93.00 °F | 69.08 °F | 93.13 °F | 81.28 °F | 66.38 °F | 80.06 °F | 70.25 °F | 51.08 °F | 4.37 in | 0.10 in | 0.00 in | 0.00 in |
| September | 109.94 °F | 87.70 °F | 55.04 °F | 93.04 °F | 74.97 °F | 54.86 °F | 82.94 °F | 64.06 °F | 35.06 °F | 4.00 in | 0.10 in | 0.00 in | 0.00 in |
| October | 98.96 °F | 77.86 °F | 37.04 °F | 82.76 °F | 63.95 °F | 36.14 °F | 77.00 °F | 52.17 °F | 24.08 °F | 4.70 in | 0.12 in | 0.00 in | 0.00 in |
| November | 89.06 °F | 66.16 °F | 30.02 °F | 77.72 °F | 53.50 °F | 30.56 °F | 73.04 °F | 42.05 °F | 8.96 °F | 6.00 in | 0.14 in | 0.71 in | 0.00 in |
| December | 82.94 °F | 57.35 °F | 15.08 °F | 73.04 °F | 46.01 °F | 11.34 °F | 69.28 °F | 36.02 °F | -4.00 °F | 5.45 in | 0.17 in | 15.20 in | 0.02 in |
Data Visualisations
Remove WatermarksCurrent Year Climate Trends vs Historical


Max Temperature this Year | 1 of 6
Climate 12-Month Moving Averages


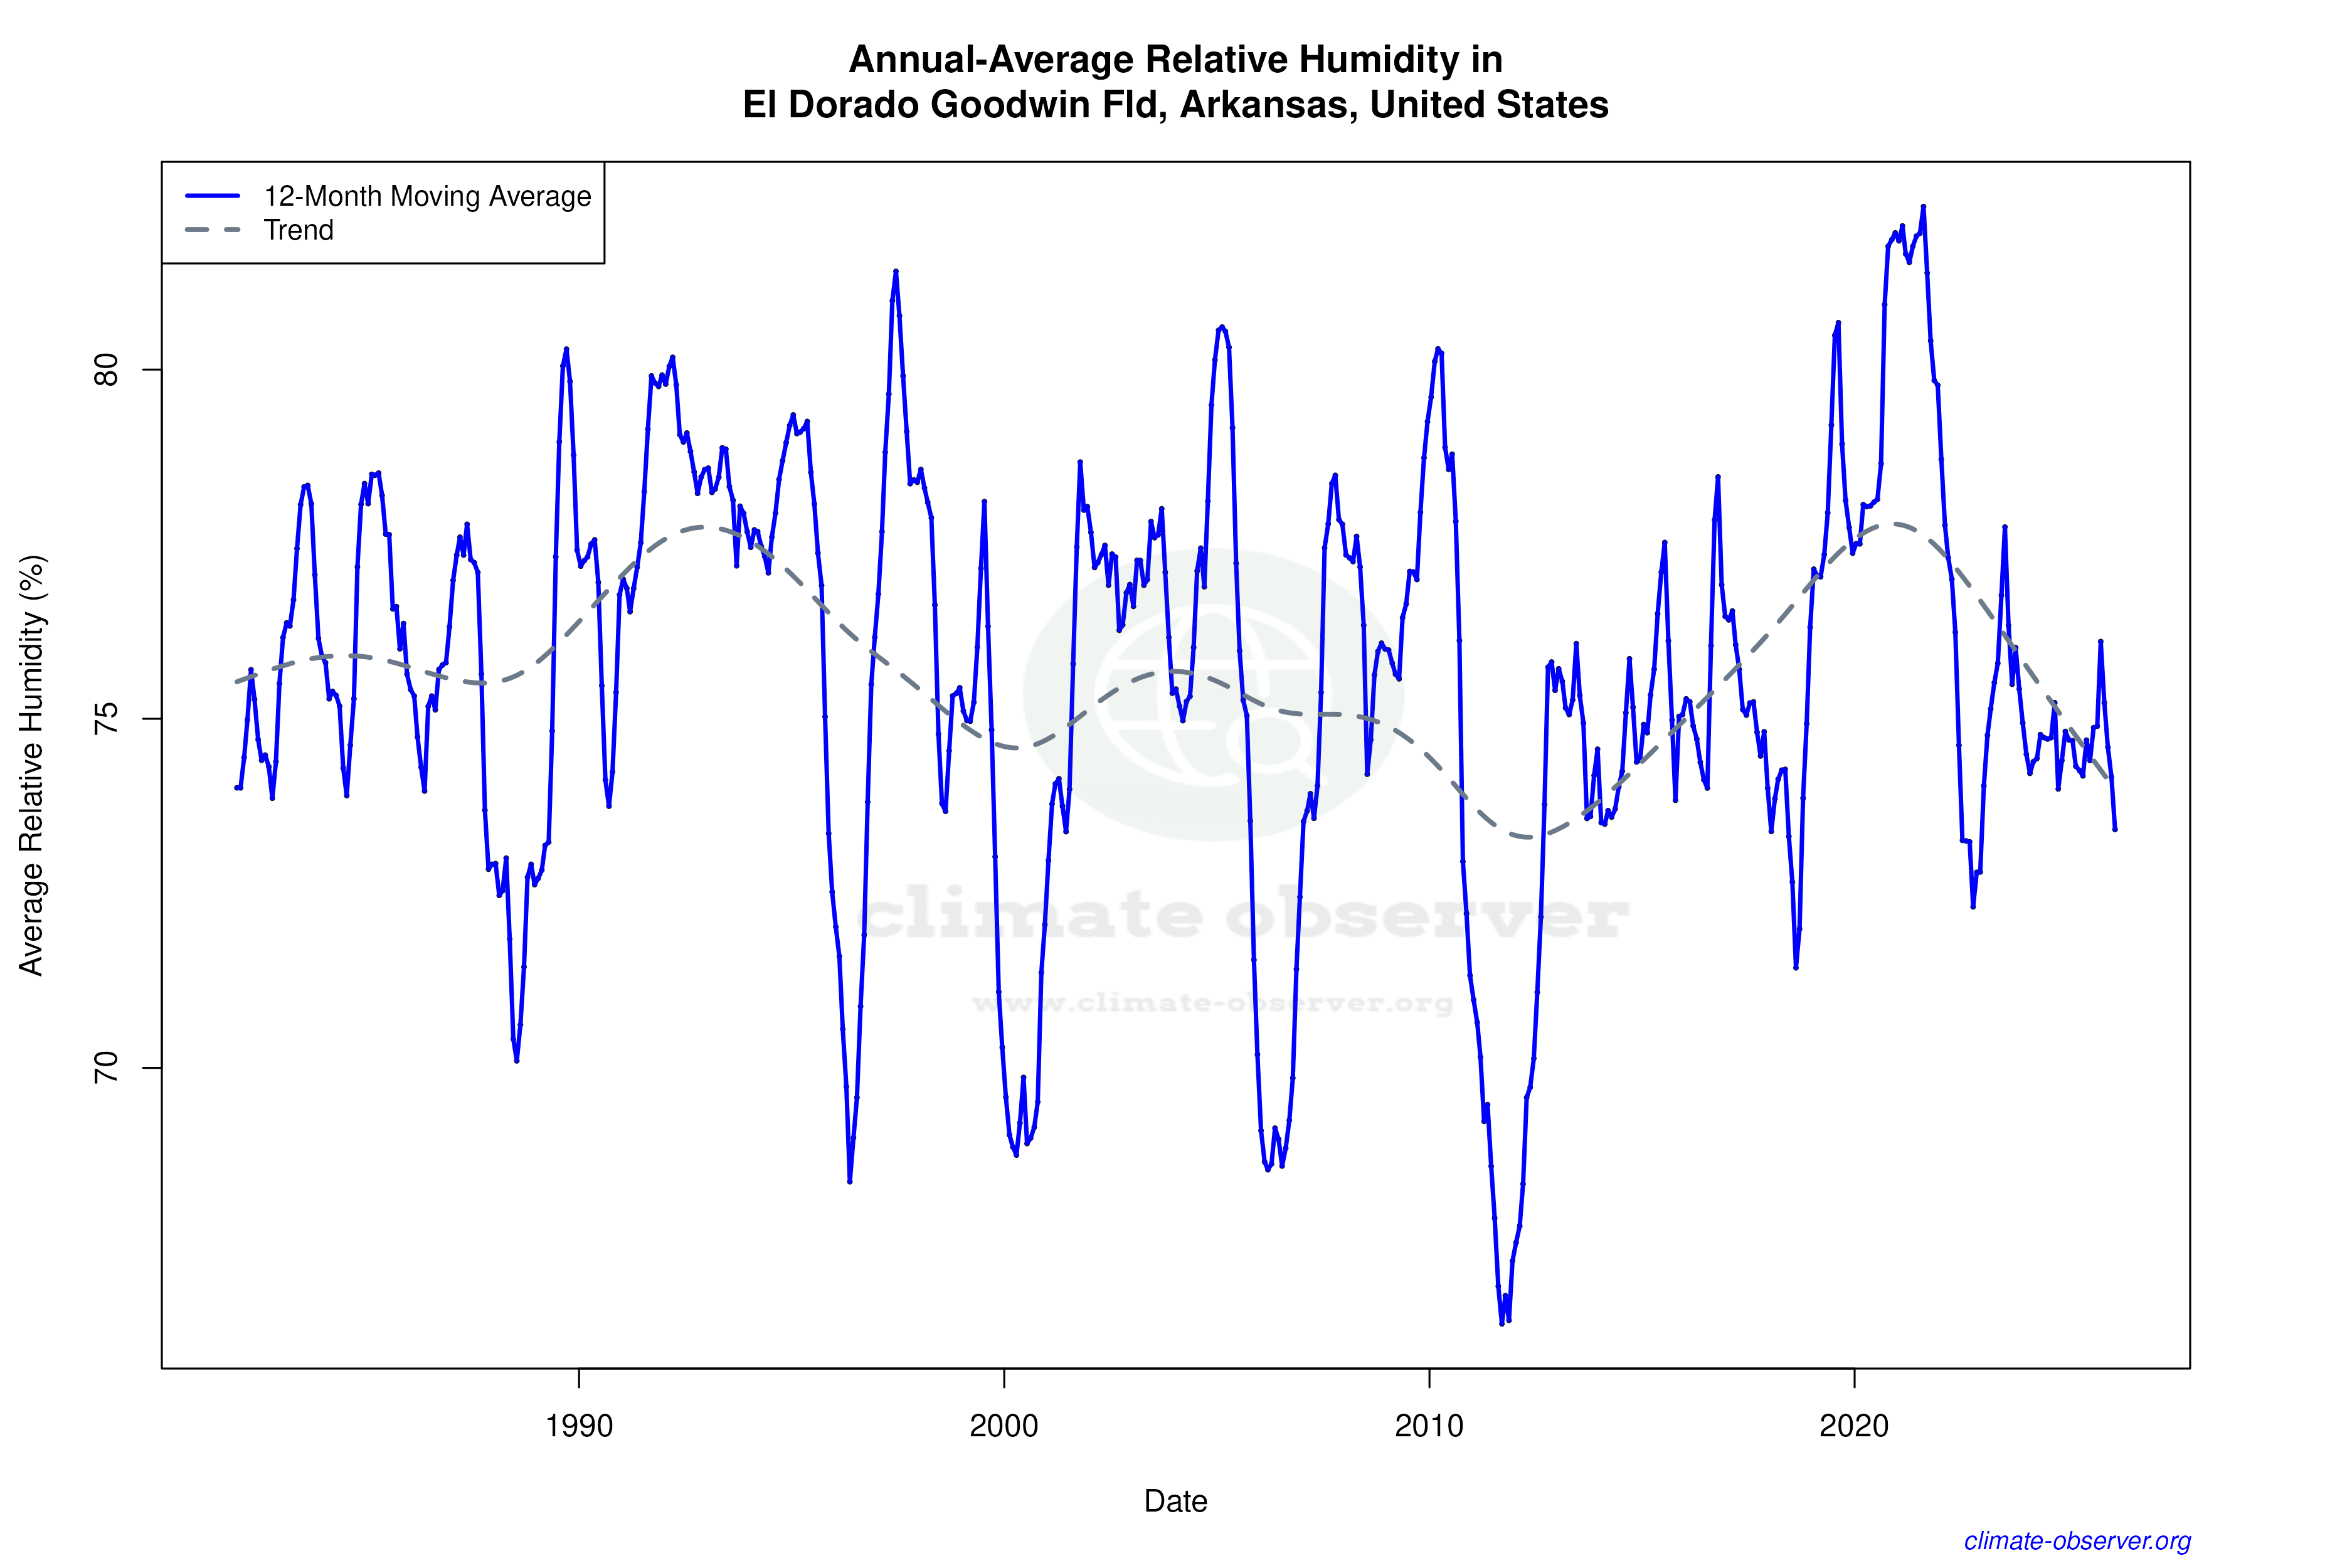

Max Temperature 12-Month MA | 1 of 6
Daily Data Points and Averages Throughout the Year


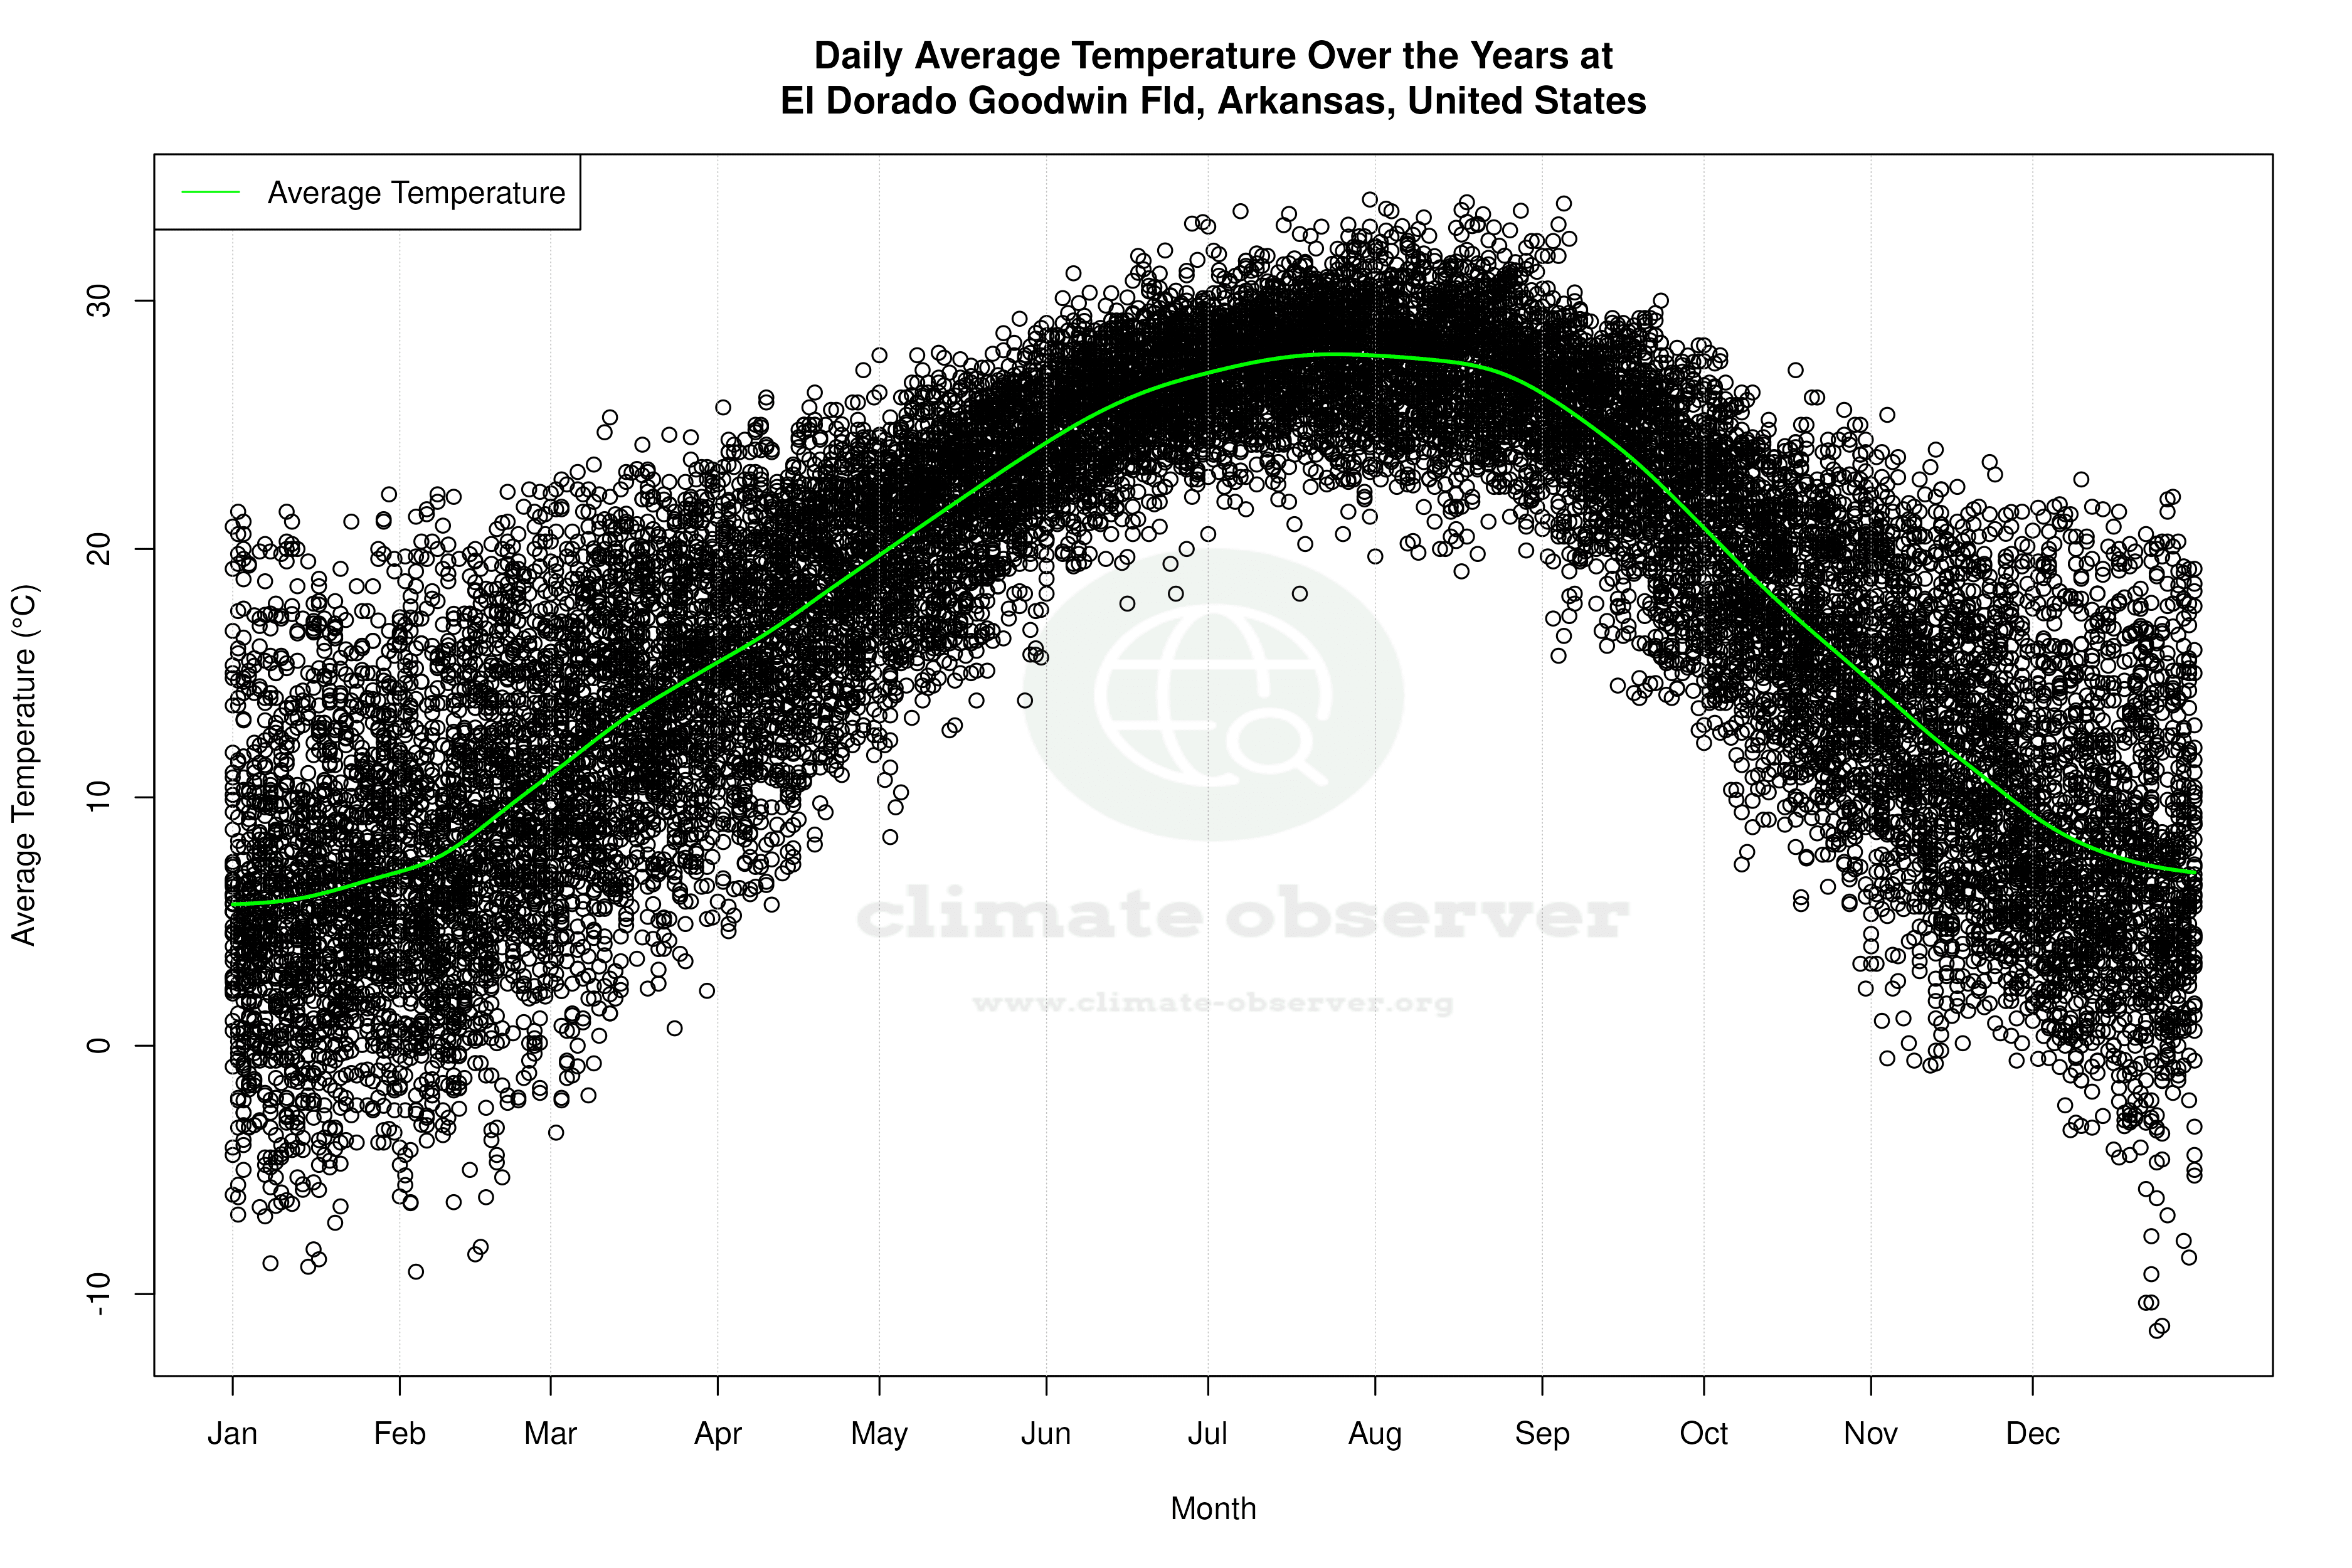


Average Max Temperature Throughout Year | 1 of 5
