Climate for Station: Fada N'gourma, Est Region, Burkina Faso
Loading live weather...
Climate Analysis & Overview
Fada N'gourma, located in Burkina Faso, is experiencing a warming trend with significant concentration in precipitation events. The region's climate is shifting, with more intense temperature extremes and precipitation patterns that could challenge local agricultural practices.
Climate Classification and Geography
Fada N'gourma is situated in the semi-arid region of Burkina Faso, characterised by a Köppen climate classification of Aw, indicating a tropical savanna climate with a distinct wet and dry season. The geography is predominantly flat with occasional hills, influencing local weather patterns by limiting moisture retention and enhancing temperature variability. This geographical setup contributes to the area's susceptibility to climate shifts, as reflected in the station's data.
Temperature Trends: A Warming Landscape
Over the last decade, Fada N'gourma has seen a warming trend with average highs increasing by 0.17°C (0.31°F) and lows by 0.12°C (0.21°F). However, the all-time data presents a more nuanced picture. The highs have risen by 0.08°C (0.14°F), while the lows have experienced a more pronounced increase of 0.35°C (0.63°F). This warming trend, particularly in nighttime temperatures, suggests a shift in the thermal dynamics of the region, potentially impacting local ecosystems and agriculture.
Precipitation Patterns: Intensifying Concentration
The Precipitation Concentration Index (PCI) for Fada N'gourma has seen a significant increase from a baseline of 18.9 to a current value of 22.9. This indicates that rainfall events are becoming more concentrated, with intense periods of precipitation followed by longer dry spells. Such a pattern poses challenges for water management and agricultural planning, as the region may experience more frequent and severe droughts interspersed with heavy rainfall.
Temperature Extremes: Record Highs and Lows
The station's records highlight the region's potential for extreme temperatures, with a maximum recorded high of 50.0°C (122.0°F) and a minimum of 8.4°C (47.1°F). These extremes underscore the volatility of the local climate, which can have profound effects on both human and natural systems, particularly in a region where agriculture is a critical component of the economy.
Implications for Regional Climate Goals
Burkina Faso is actively working towards climate resilience, aiming to adapt to these changing conditions through sustainable agricultural practices and improved water management. The trends observed in Fada N'gourma are crucial for informing these strategies, as they highlight the need for adaptive measures to cope with increased temperature extremes and more concentrated precipitation events.
Station Statistics
10-Year Trend
High: +0.19 °F/decade
Low: +0.24 °F/decade
Rain: -0.016 in/decade
25-Year Trend
High: +0.27 °F/decade
Low: +0.86 °F/decade
Rain: -0.005 in/decade
50-Year Trend
High: +0.36 °F/decade
Low: +0.74 °F/decade
Rain: -0.002 in/decade
All-Time Trend
High: +0.11 °F/decade
Low: +0.62 °F/decade
Rain: -0.001 in/decade
Percentage Above-Average Days
Last 12 Months: 52.9%
This Year: 72.7%
Precipitation Concentration Index (PCI) ℹ️
Last 12 Months: 19.5
Historical Average: 20.3
Percentile Rank of Last 12 Months ℹ️
High: 74th percentile
Low: 94th percentile
Rain: 2nd percentile
Change in Variance ℹ️
High: +5.3%
Low: -15.2%
Intraday: -20.0%
Data Coverage
89.6%
First Year of Data
1945
Station Location
Historical Weather Records
| Max High | Avg High | Min High | Max Avg | Avg Avg | Min Avg | Max Low | Avg Low | Min Low | Max Precipitation | Avg Precipitation | Max Snow | Avg Snow | |
|---|---|---|---|---|---|---|---|---|---|---|---|---|---|
| Record | 122.00 °F | — | 72.32 °F | 102.92 °F | — | 64.94 °F | 94.10 °F | — | 47.12 °F | 7.24 in | — | — | — |
| January | 105.80 °F | 93.46 °F | 76.46 °F | 95.18 °F | 77.98 °F | 65.12 °F | 77.13 °F | 63.23 °F | 51.26 °F | 0.09 in | 0.00 in | — | — |
| February | 111.92 °F | 98.41 °F | 81.50 °F | 95.54 °F | 83.12 °F | 66.56 °F | 84.56 °F | 67.97 °F | 52.52 °F | 0.49 in | 0.00 in | — | — |
| March | 119.30 °F | 102.95 °F | 85.46 °F | 101.48 °F | 89.28 °F | 72.32 °F | 87.80 °F | 74.81 °F | 57.15 °F | 1.40 in | 0.01 in | — | — |
| April | 122.00 °F | 103.76 °F | 84.56 °F | 102.92 °F | 91.54 °F | 77.54 °F | 89.24 °F | 79.11 °F | 63.50 °F | 2.67 in | 0.04 in | — | — |
| May | 111.92 °F | 99.73 °F | 76.46 °F | 99.68 °F | 88.86 °F | 74.84 °F | 94.10 °F | 78.46 °F | 56.30 °F | 3.27 in | 0.11 in | — | — |
| June | 106.52 °F | 94.25 °F | 76.82 °F | 94.82 °F | 84.41 °F | 73.76 °F | 85.46 °F | 75.16 °F | 59.00 °F | 4.53 in | 0.17 in | — | — |
| July | 102.92 °F | 89.24 °F | 73.94 °F | 90.86 °F | 80.63 °F | 71.24 °F | 81.86 °F | 72.91 °F | 62.60 °F | 7.11 in | 0.25 in | — | — |
| August | 98.60 °F | 86.75 °F | 73.40 °F | 88.16 °F | 78.90 °F | 71.78 °F | 79.52 °F | 71.90 °F | 65.30 °F | 7.24 in | 0.32 in | — | — |
| September | 101.84 °F | 88.82 °F | 72.32 °F | 90.68 °F | 79.89 °F | 71.96 °F | 78.80 °F | 71.67 °F | 64.40 °F | 5.29 in | 0.22 in | — | — |
| October | 107.24 °F | 95.40 °F | 79.16 °F | 94.10 °F | 82.81 °F | 71.60 °F | 80.06 °F | 71.72 °F | 59.36 °F | 1.89 in | 0.06 in | — | — |
| November | 107.60 °F | 97.60 °F | 85.10 °F | 93.20 °F | 81.97 °F | 70.16 °F | 80.60 °F | 66.52 °F | 53.24 °F | 0.37 in | 0.00 in | — | — |
| December | 104.72 °F | 93.97 °F | 76.64 °F | 91.40 °F | 78.35 °F | 64.94 °F | 77.18 °F | 63.23 °F | 47.12 °F | 0.59 in | 0.00 in | — | — |
Data Visualisations
Remove WatermarksCurrent Year Climate Trends vs Historical


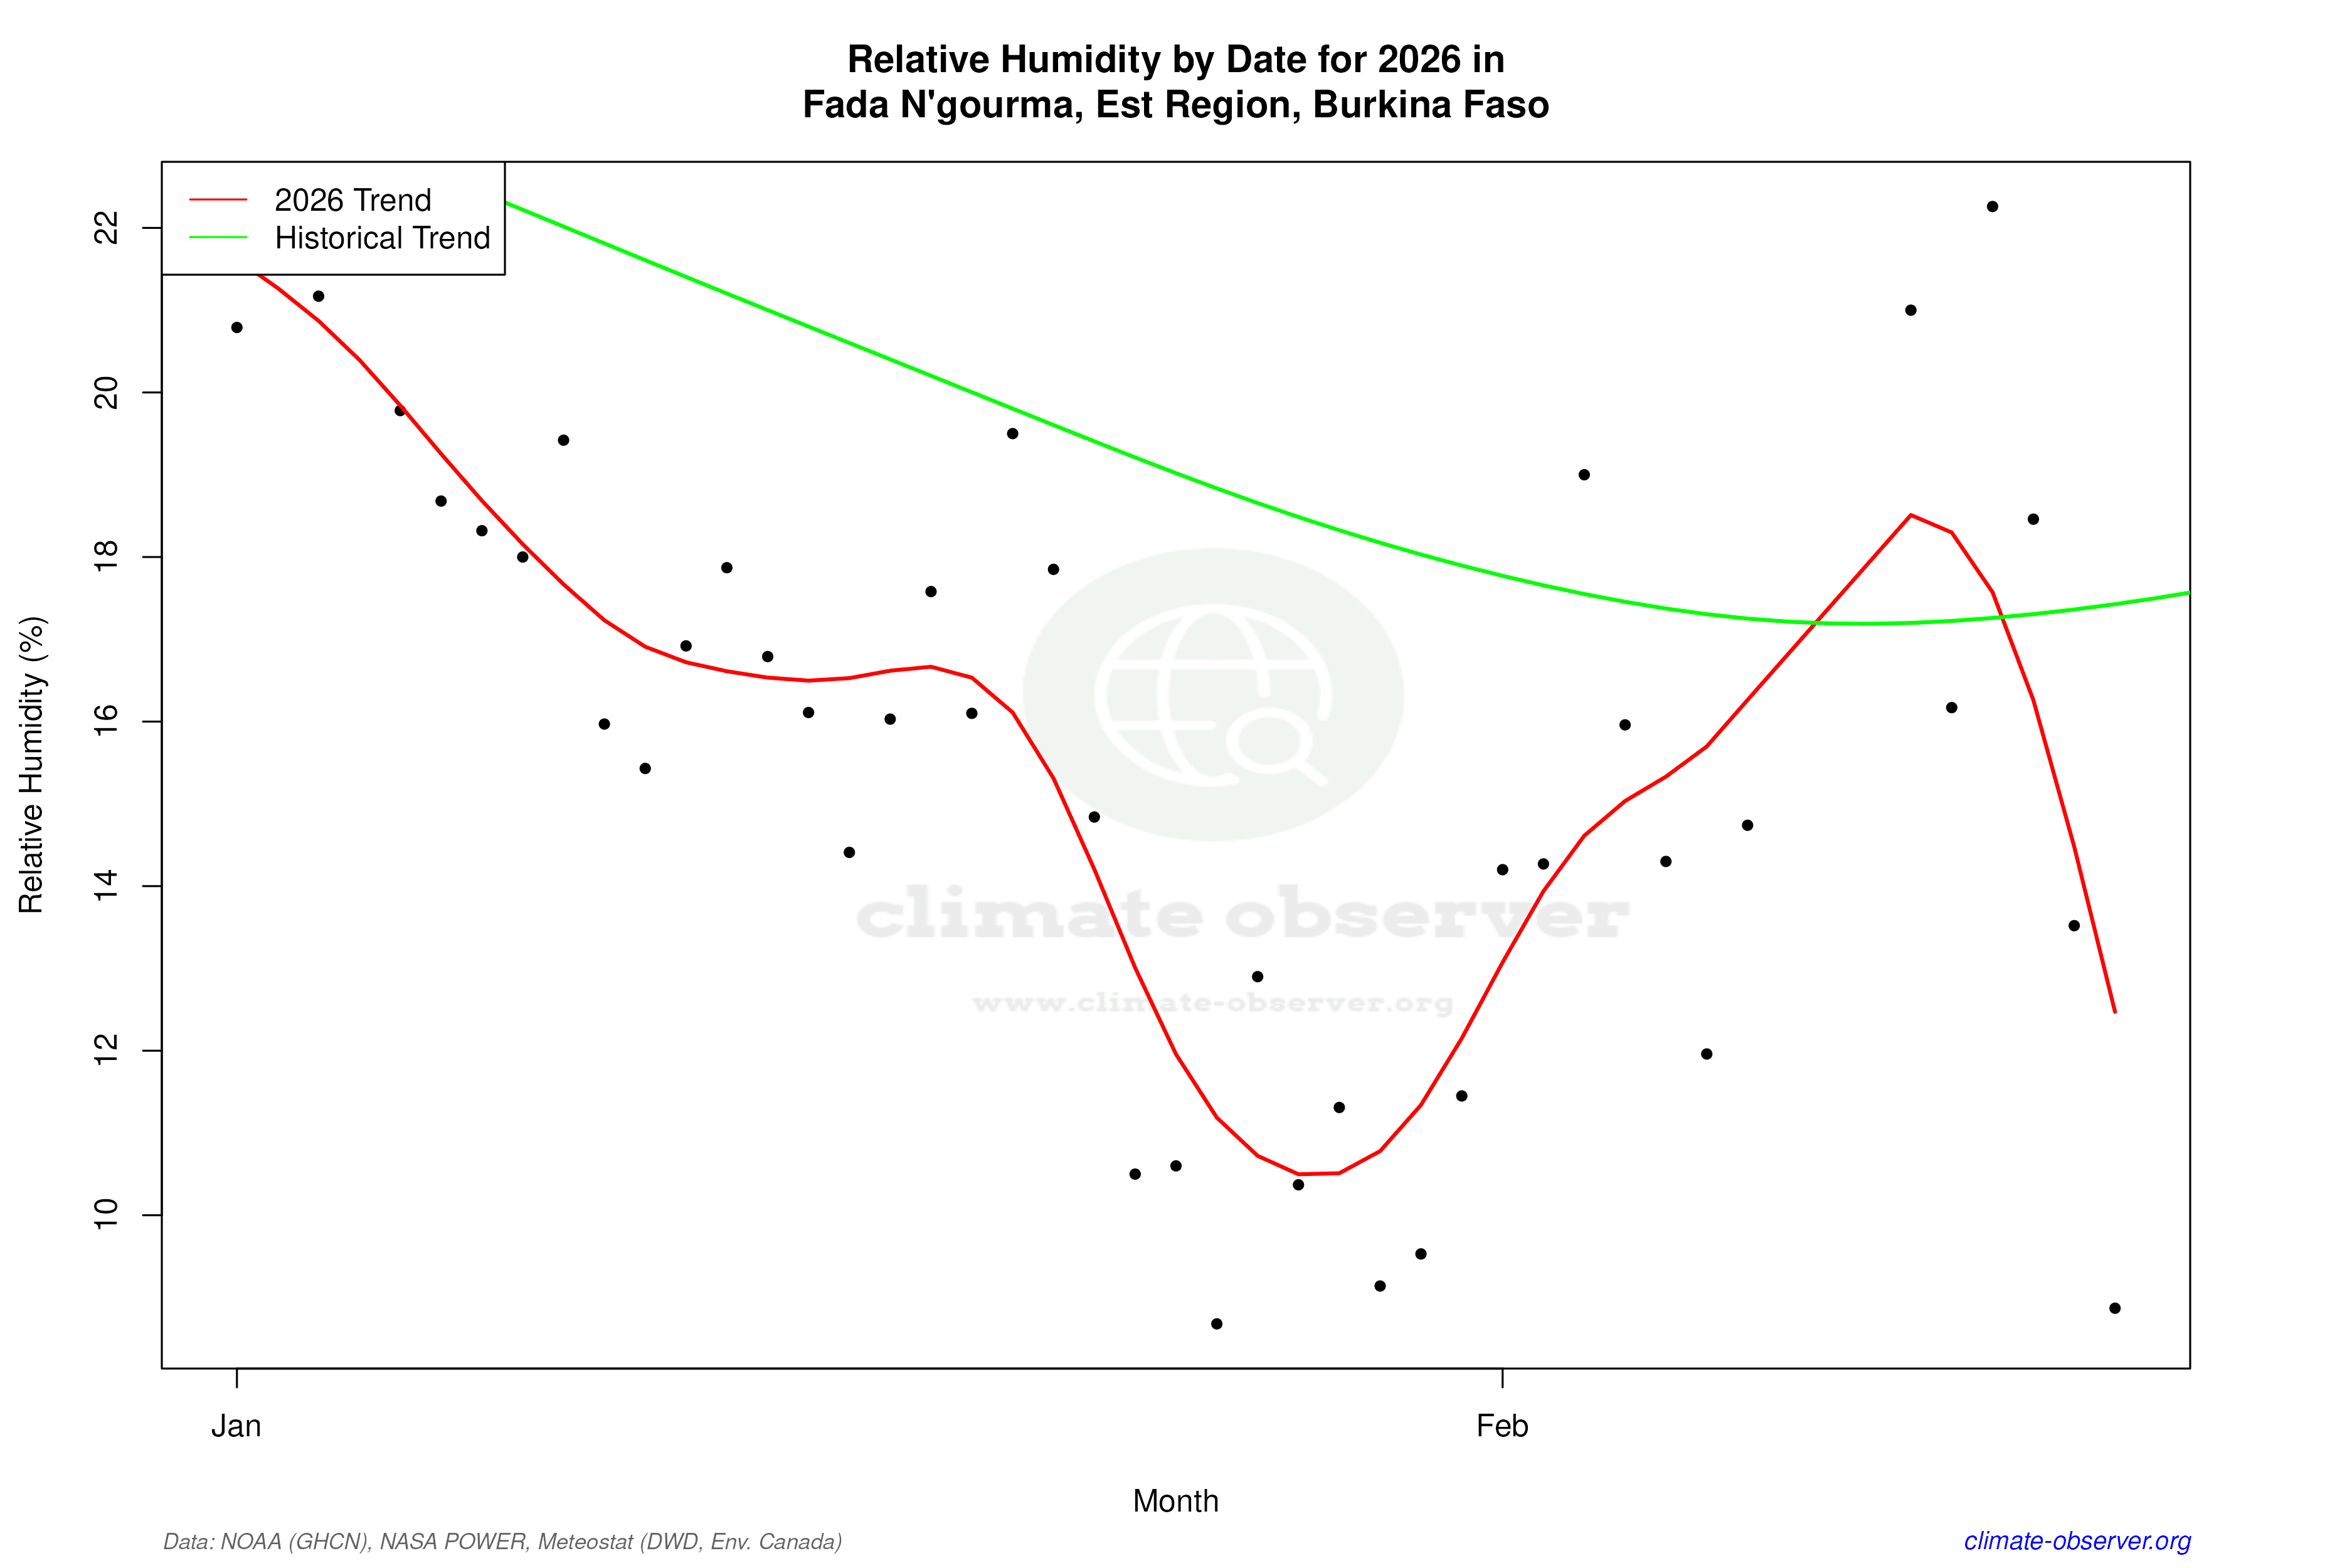

Max Temperature this Year | 1 of 6
Climate 12-Month Moving Averages


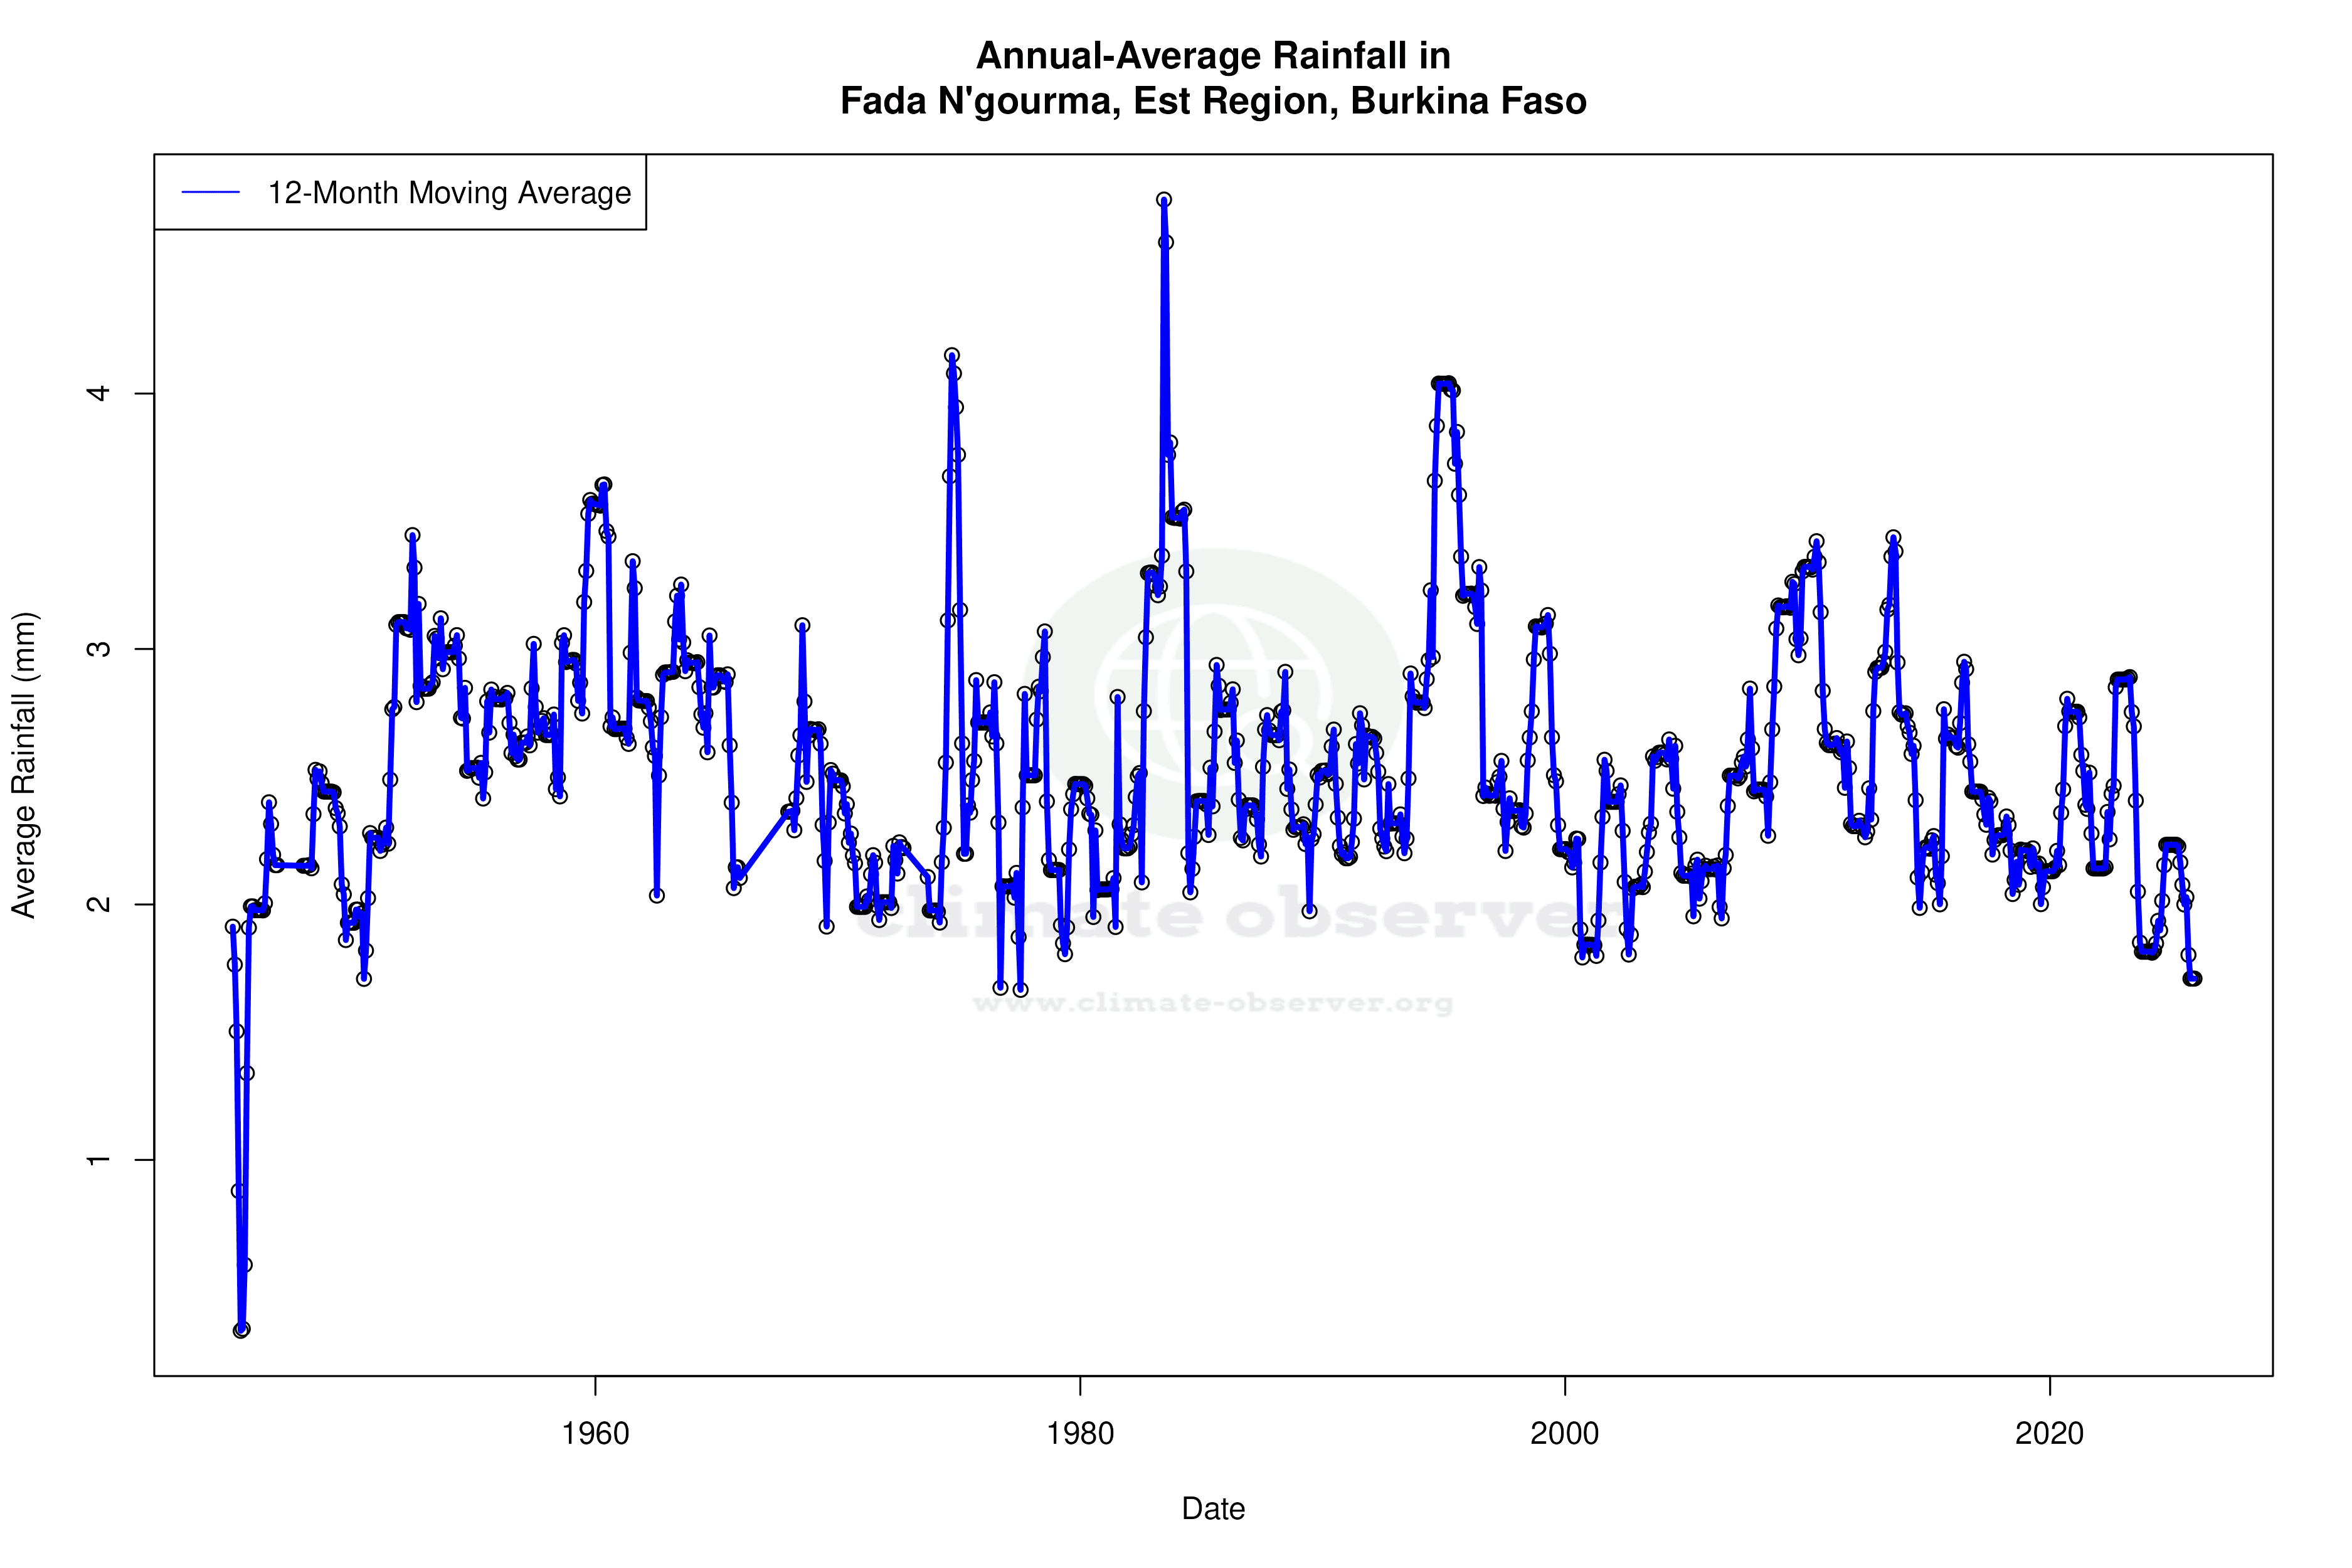


Max Temperature 12-Month MA | 1 of 6
Daily Data Points and Averages Throughout the Year


Average Max Temperature Throughout Year | 1 of 5
