Climate for Station: Mercedes, Soriano, Uruguay
Loading live weather...
Climate Analysis & Overview
Mercedes, located in Uruguay's Soriano Department, is experiencing a complex climate narrative. While long-term data shows a warming trend, recent years indicate a cooling of high temperatures. Precipitation has become more evenly distributed, reflecting broader regional climate goals.
Climate Classification and Geographic Influence
Mercedes is characterised by a humid subtropical climate, according to the Köppen classification. This climate type typically features hot summers and mild winters, influenced by its proximity to the Uruguay River. The river's moderating effect is evident in the temperature records, with an all-time high of 43.0°C (109.4°F) and a low of -8.2°C (17.2°F). These extremes illustrate the range of temperatures that can occur in this region, although they are tempered by the river's presence.
Temperature Trends: A Dual Narrative
The temperature trends in Mercedes present a dual narrative. Over the long term, there has been a warming trend, with high temperatures rising by 0.21°C (0.38°F) and low temperatures increasing by 0.08°C (0.14°F). However, the past decade tells a different story for high temperatures, which have shown a slight cooling of 0.02°C (0.04°F). In contrast, low temperatures have risen significantly by 0.87°C (1.57°F) during the same period. This divergence suggests a complex interplay of local and regional climatic factors, possibly influenced by broader climate variability patterns.
Precipitation Patterns: A Shift Towards Evenness
The Precipitation Concentration Index (PCI) for Mercedes has decreased from a baseline of 13.4 to a current value of 9.7. This indicates a more even distribution of rainfall events, moving away from concentrated heavy downpours. A PCI below 10 suggests that precipitation is now more evenly spread throughout the year, which can be beneficial for agriculture and water management. This shift aligns with Uruguay's regional climate goals, which focus on adapting to changing precipitation patterns to ensure sustainable water resources.
Regional Climate Goals and Recent Events
Uruguay has been proactive in addressing climate change, with initiatives aimed at managing water resources and reducing greenhouse gas emissions. The more even distribution of precipitation in Mercedes complements these goals, providing a more stable water supply for agriculture, a key economic activity in the region. Recent weather events, such as unseasonal rains or dry spells, underscore the importance of these adaptive strategies.
Implications of Temperature and Precipitation Changes
The observed trends in Mercedes have significant implications for local agriculture and infrastructure. The warming of low temperatures may extend the growing season, while the cooling of high temperatures could reduce heat stress on crops. Meanwhile, the more even precipitation distribution can mitigate the risk of flooding and drought, enhancing resilience to climate variability. These changes highlight the dynamic nature of Mercedes' climate and the importance of continuous monitoring and adaptation.
Station Statistics
10-Year Trend
High: -0.51 °F/decade
Low: +1.95 °F/decade
Rain: -0.006 in/decade
25-Year Trend
High: +0.44 °F/decade
Low: -0.26 °F/decade
Rain: -0.013 in/decade
50-Year Trend
High: +0.80 °F/decade
Low: +0.07 °F/decade
Rain: +0.002 in/decade
All-Time Trend
High: +0.38 °F/decade
Low: +0.16 °F/decade
Rain: +0.006 in/decade
Percentage Above-Average Days
Last 12 Months: 47.4%
This Year: 48.2%
Precipitation Concentration Index (PCI) ℹ️
Last 12 Months: 11.4
Historical Average: 12.9
Percentile Rank of Last 12 Months ℹ️
High: 71st percentile
Low: 87th percentile
Rain: 69th percentile
Change in Variance ℹ️
High: -0.8%
Low: +17.3%
Intraday: -12.5%
Data Coverage
86.2%
First Year of Data
1931
Station Location
Historical Weather Records
| Max High | Avg High | Min High | Max Avg | Avg Avg | Min Avg | Max Low | Avg Low | Min Low | Max Precipitation | Avg Precipitation | Max Snow | Avg Snow | |
|---|---|---|---|---|---|---|---|---|---|---|---|---|---|
| Record | 109.40 °F | — | 39.38 °F | 95.72 °F | — | 31.64 °F | 84.20 °F | — | 17.24 °F | 6.73 in | — | — | — |
| January | 109.40 °F | 88.69 °F | 59.00 °F | 95.72 °F | 77.93 °F | 60.98 °F | 84.20 °F | 63.67 °F | 42.62 °F | 6.73 in | 0.13 in | — | — |
| February | 105.80 °F | 86.24 °F | 60.80 °F | 92.66 °F | 75.62 °F | 57.56 °F | 80.42 °F | 62.91 °F | 41.54 °F | 6.42 in | 0.15 in | — | — |
| March | 105.80 °F | 81.82 °F | 53.60 °F | 91.22 °F | 71.83 °F | 48.38 °F | 82.04 °F | 59.29 °F | 34.34 °F | 5.87 in | 0.16 in | — | — |
| April | 98.96 °F | 74.59 °F | 50.00 °F | 84.02 °F | 64.86 °F | 47.12 °F | 74.10 °F | 52.68 °F | 30.20 °F | 4.43 in | 0.12 in | — | — |
| May | 89.96 °F | 67.95 °F | 48.38 °F | 78.44 °F | 57.85 °F | 31.64 °F | 74.12 °F | 47.26 °F | 24.26 °F | 6.22 in | 0.09 in | — | — |
| June | 86.36 °F | 62.19 °F | 44.42 °F | 77.18 °F | 52.87 °F | 33.08 °F | 69.80 °F | 43.24 °F | 17.24 °F | 3.42 in | 0.08 in | — | — |
| July | 86.90 °F | 61.84 °F | 39.38 °F | 77.36 °F | 51.96 °F | 32.36 °F | 70.16 °F | 42.11 °F | 18.32 °F | 4.69 in | 0.08 in | — | — |
| August | 91.40 °F | 65.21 °F | 44.96 °F | 81.86 °F | 55.29 °F | 35.42 °F | 69.26 °F | 43.55 °F | 17.60 °F | 3.74 in | 0.09 in | — | — |
| September | 96.98 °F | 68.67 °F | 47.12 °F | 85.82 °F | 58.61 °F | 41.18 °F | 73.40 °F | 46.62 °F | 23.00 °F | 3.46 in | 0.10 in | — | — |
| October | 98.60 °F | 74.08 °F | 49.82 °F | 87.44 °F | 64.55 °F | 43.16 °F | 73.40 °F | 51.35 °F | 30.20 °F | 4.72 in | 0.13 in | — | — |
| November | 102.74 °F | 80.12 °F | 55.40 °F | 89.29 °F | 70.27 °F | 49.46 °F | 77.88 °F | 55.96 °F | 36.50 °F | 4.49 in | 0.12 in | — | — |
| December | 109.00 °F | 85.86 °F | 59.00 °F | 92.48 °F | 75.22 °F | 58.28 °F | 78.08 °F | 60.48 °F | 37.22 °F | 5.04 in | 0.12 in | — | — |
Data Visualisations
Remove WatermarksCurrent Year Climate Trends vs Historical


Max Temperature this Year | 1 of 6
Climate 12-Month Moving Averages


Max Temperature 12-Month MA | 1 of 6
Daily Data Points and Averages Throughout the Year


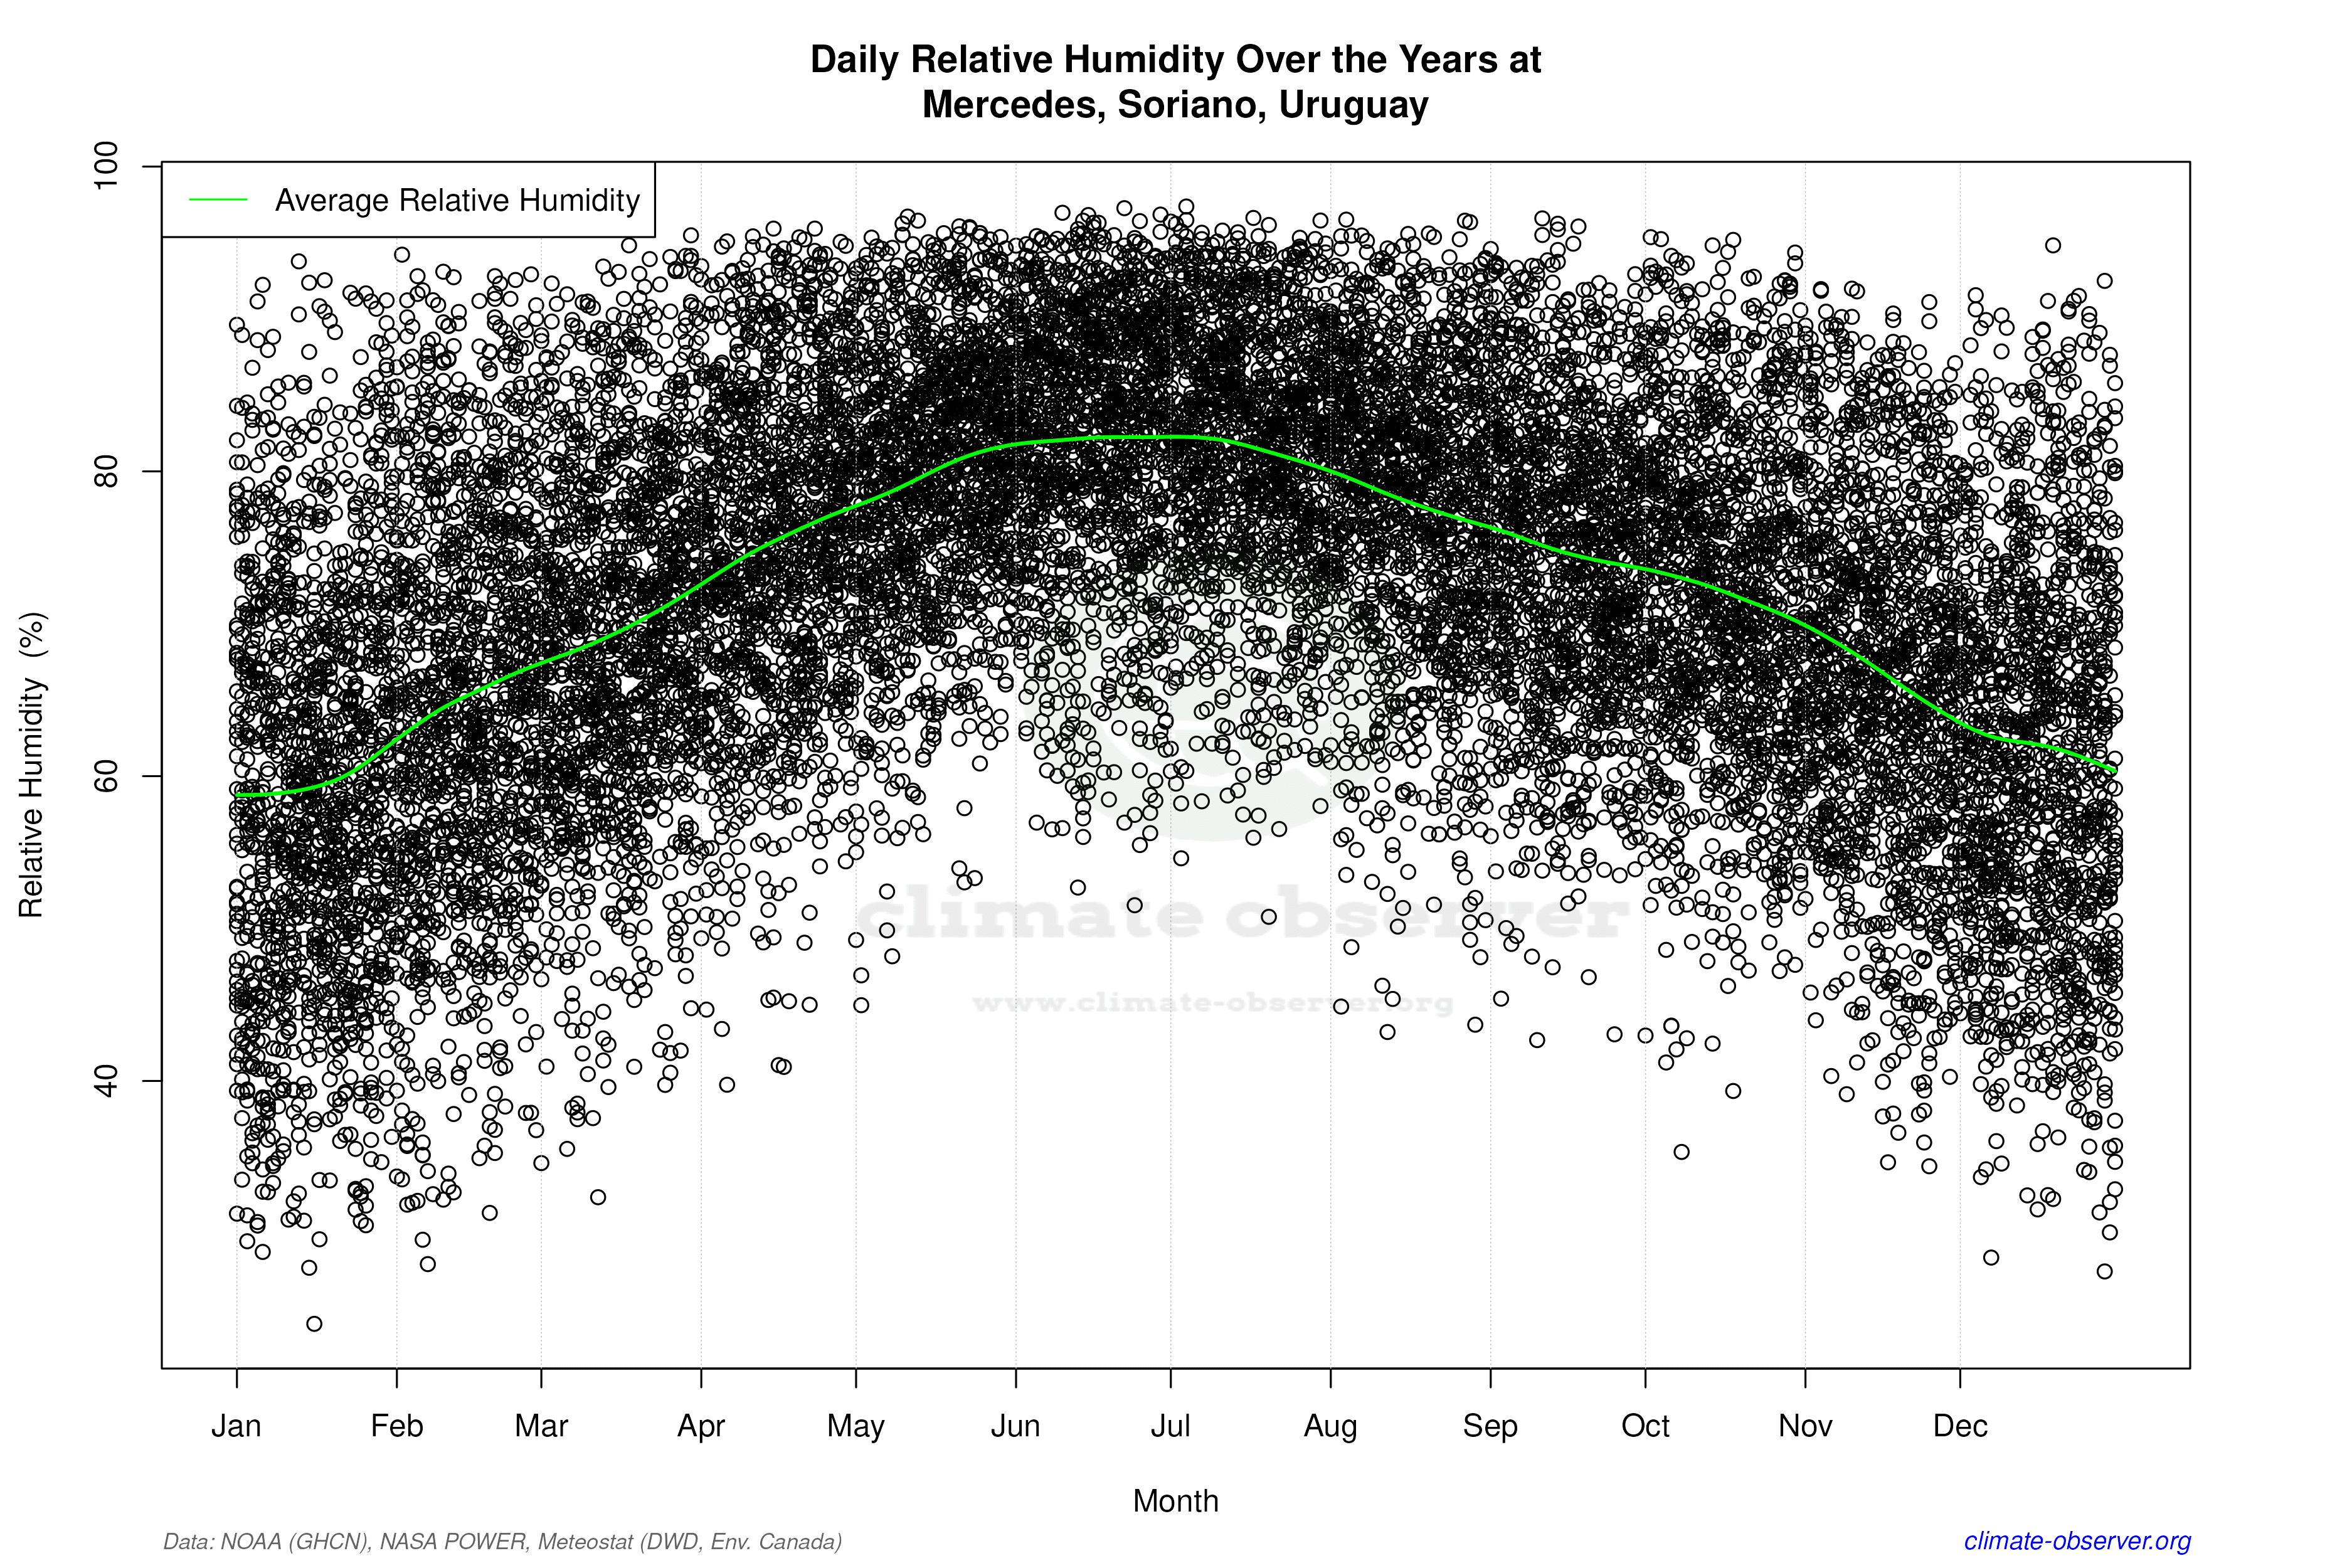

Average Max Temperature Throughout Year | 1 of 5
