Climate for Station: Cimbaj, Karakalpakstan, Uzbekistan
Loading live weather...
Climate Analysis & Overview
The climate profile for Cimbaj (Shımbay rayonı, Qaraqalpaqstan Respublikası, Oʻzbekiston) reveals a warming trend, with significant increases in temperature over both the past decade and all-time records. The region experiences concentrated precipitation events, indicating potential challenges for water management in this arid area.
Warming Trends and Temperature Extremes
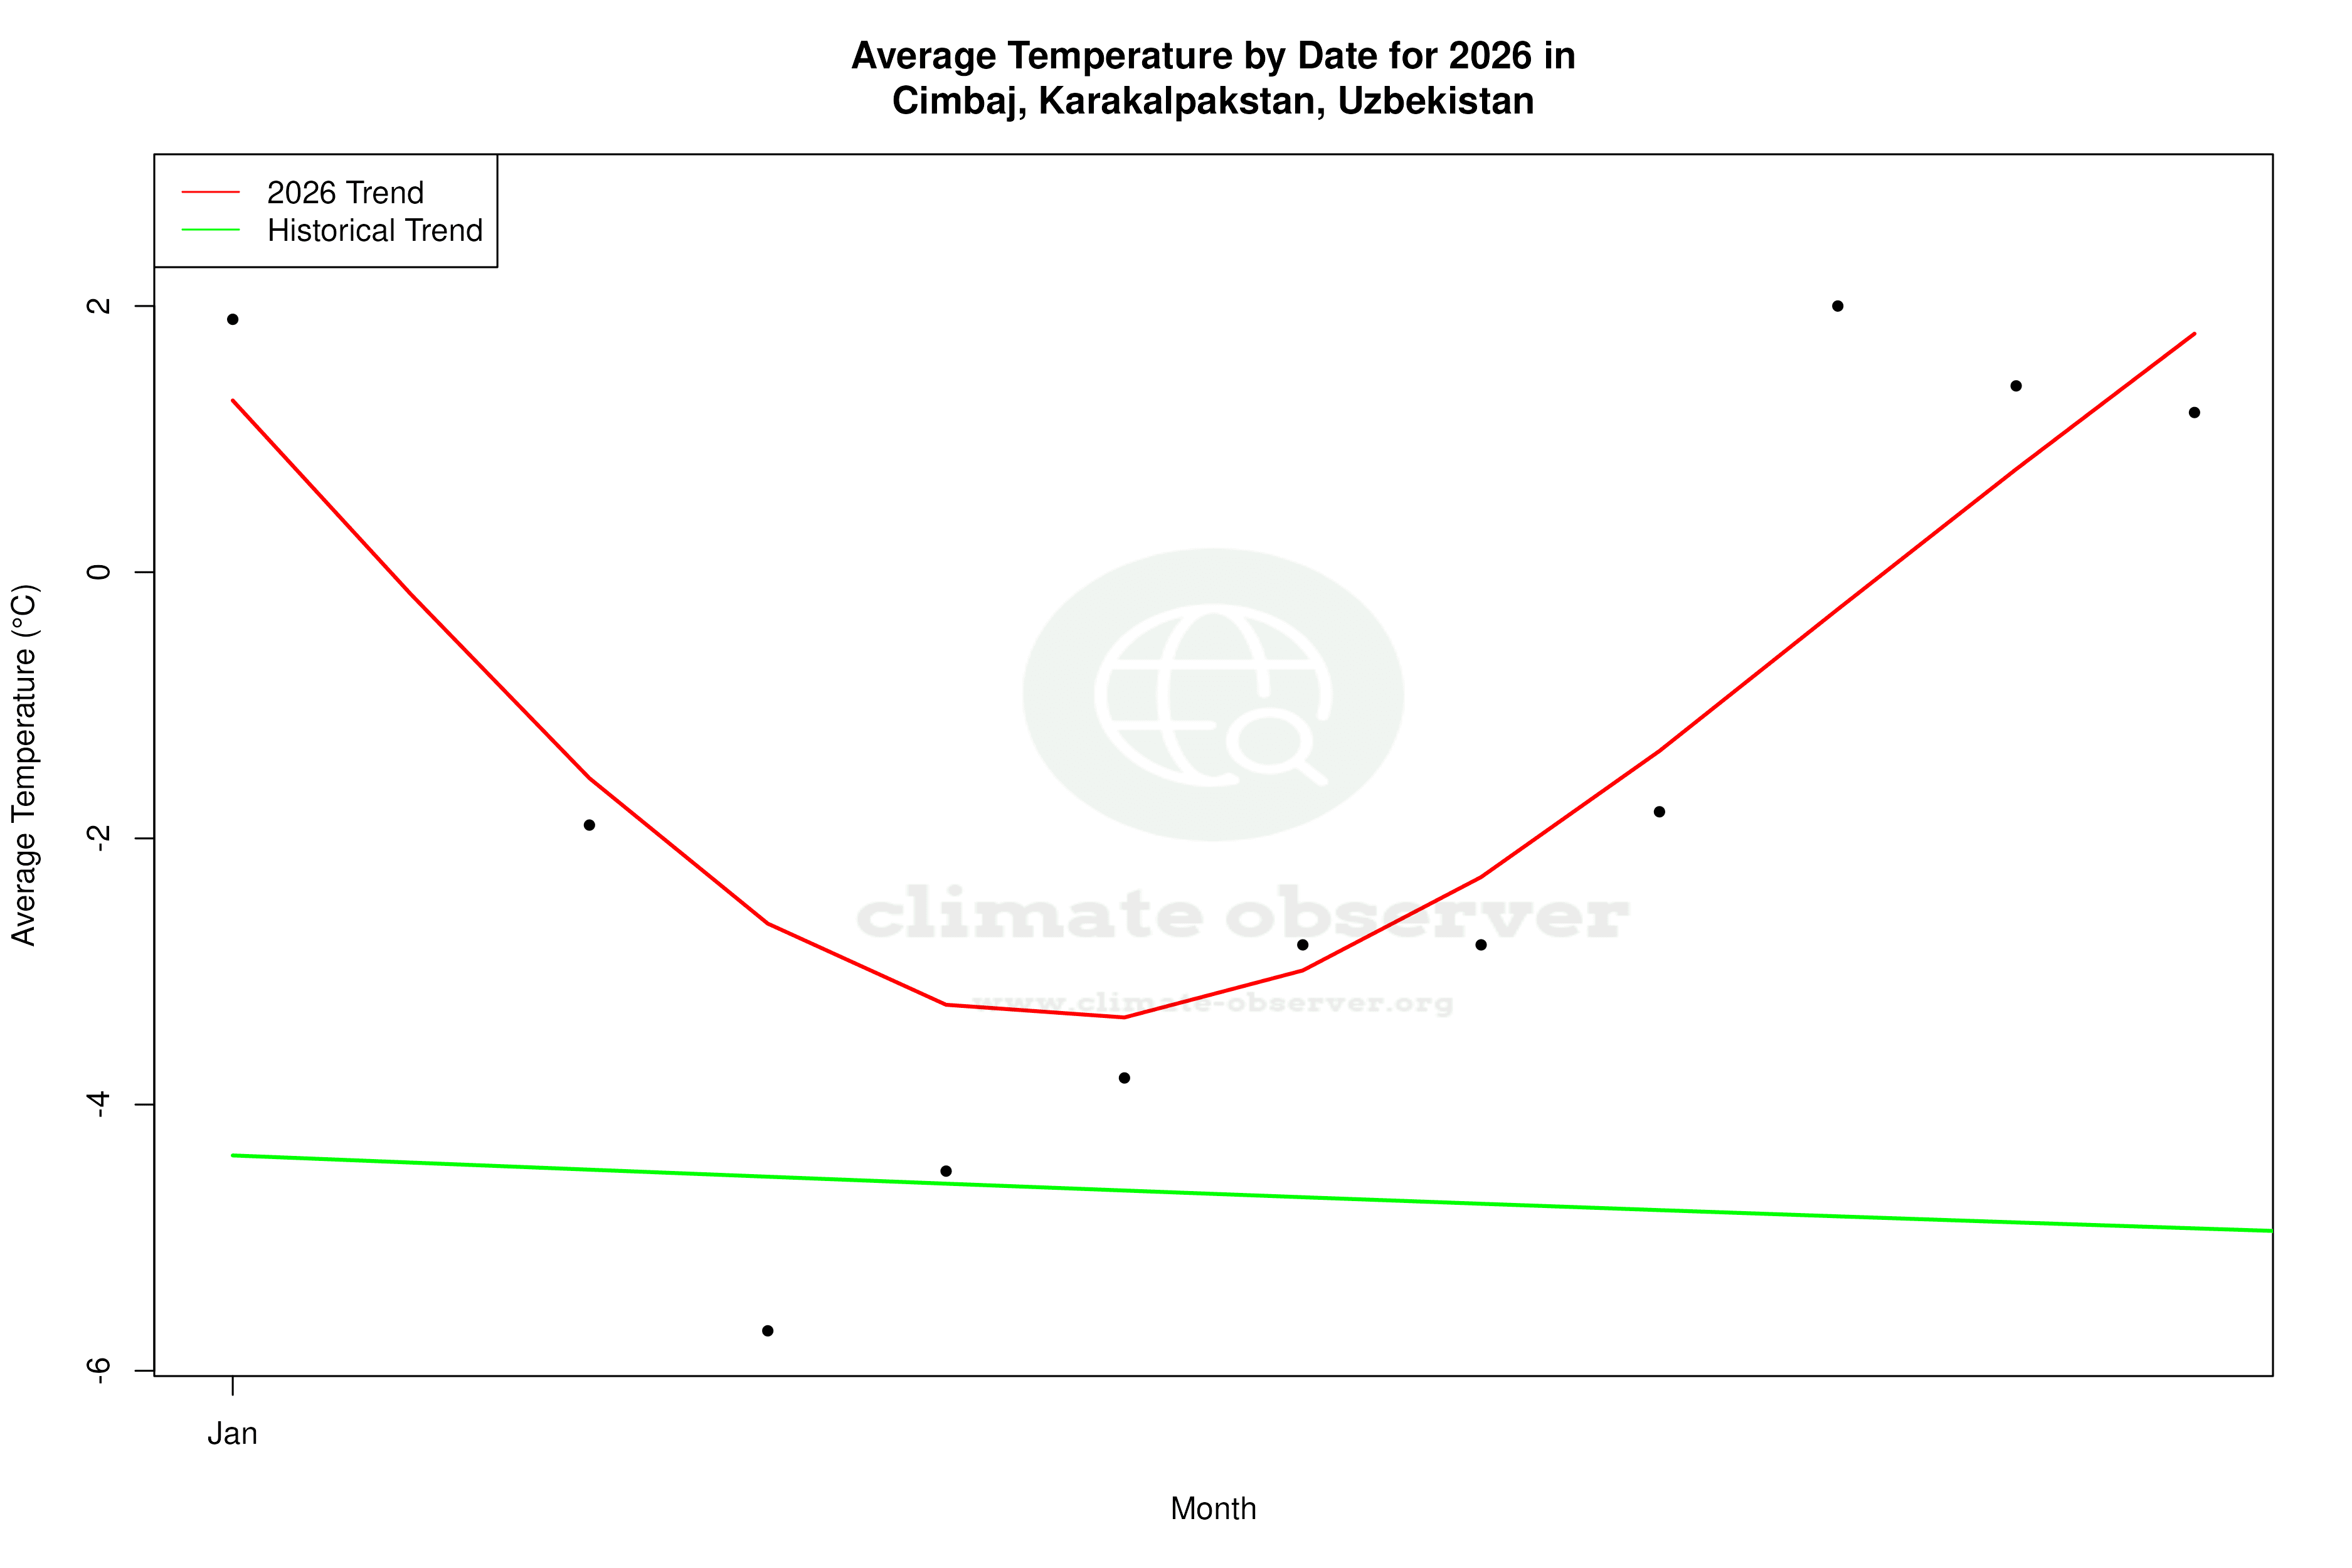
Cimbaj, located at 42.95°N, 59.8167°E, lies within an arid continental climate zone, classified under the Köppen system as BWk. This classification is characterised by hot summers and cold winters, influenced by its inland position far from moderating oceanic effects. Over the past decade, the region has experienced a notable warming trend with highs increasing by 1.32°C (2.38°F) and lows by 0.77°C (1.39°F). When considering all-time trends, there is a consistent warming with highs rising by 0.31°C (0.56°F) and lows by 0.34°C (0.61°F). These trends highlight an ongoing increase in temperature, which could exacerbate the already harsh climate conditions.
Temperature Records: A Study in Extremes
The temperature records for Cimbaj reflect its continental climate extremes. The highest recorded temperature is a scorching 47.91°C (118.24°F), while the lowest plummets to a frigid -33.7°C (-28.66°F). Such extremes underscore the challenges faced by local agriculture and infrastructure, which must adapt to both intense heat and severe cold.
Precipitation Patterns: Concentration and Variability
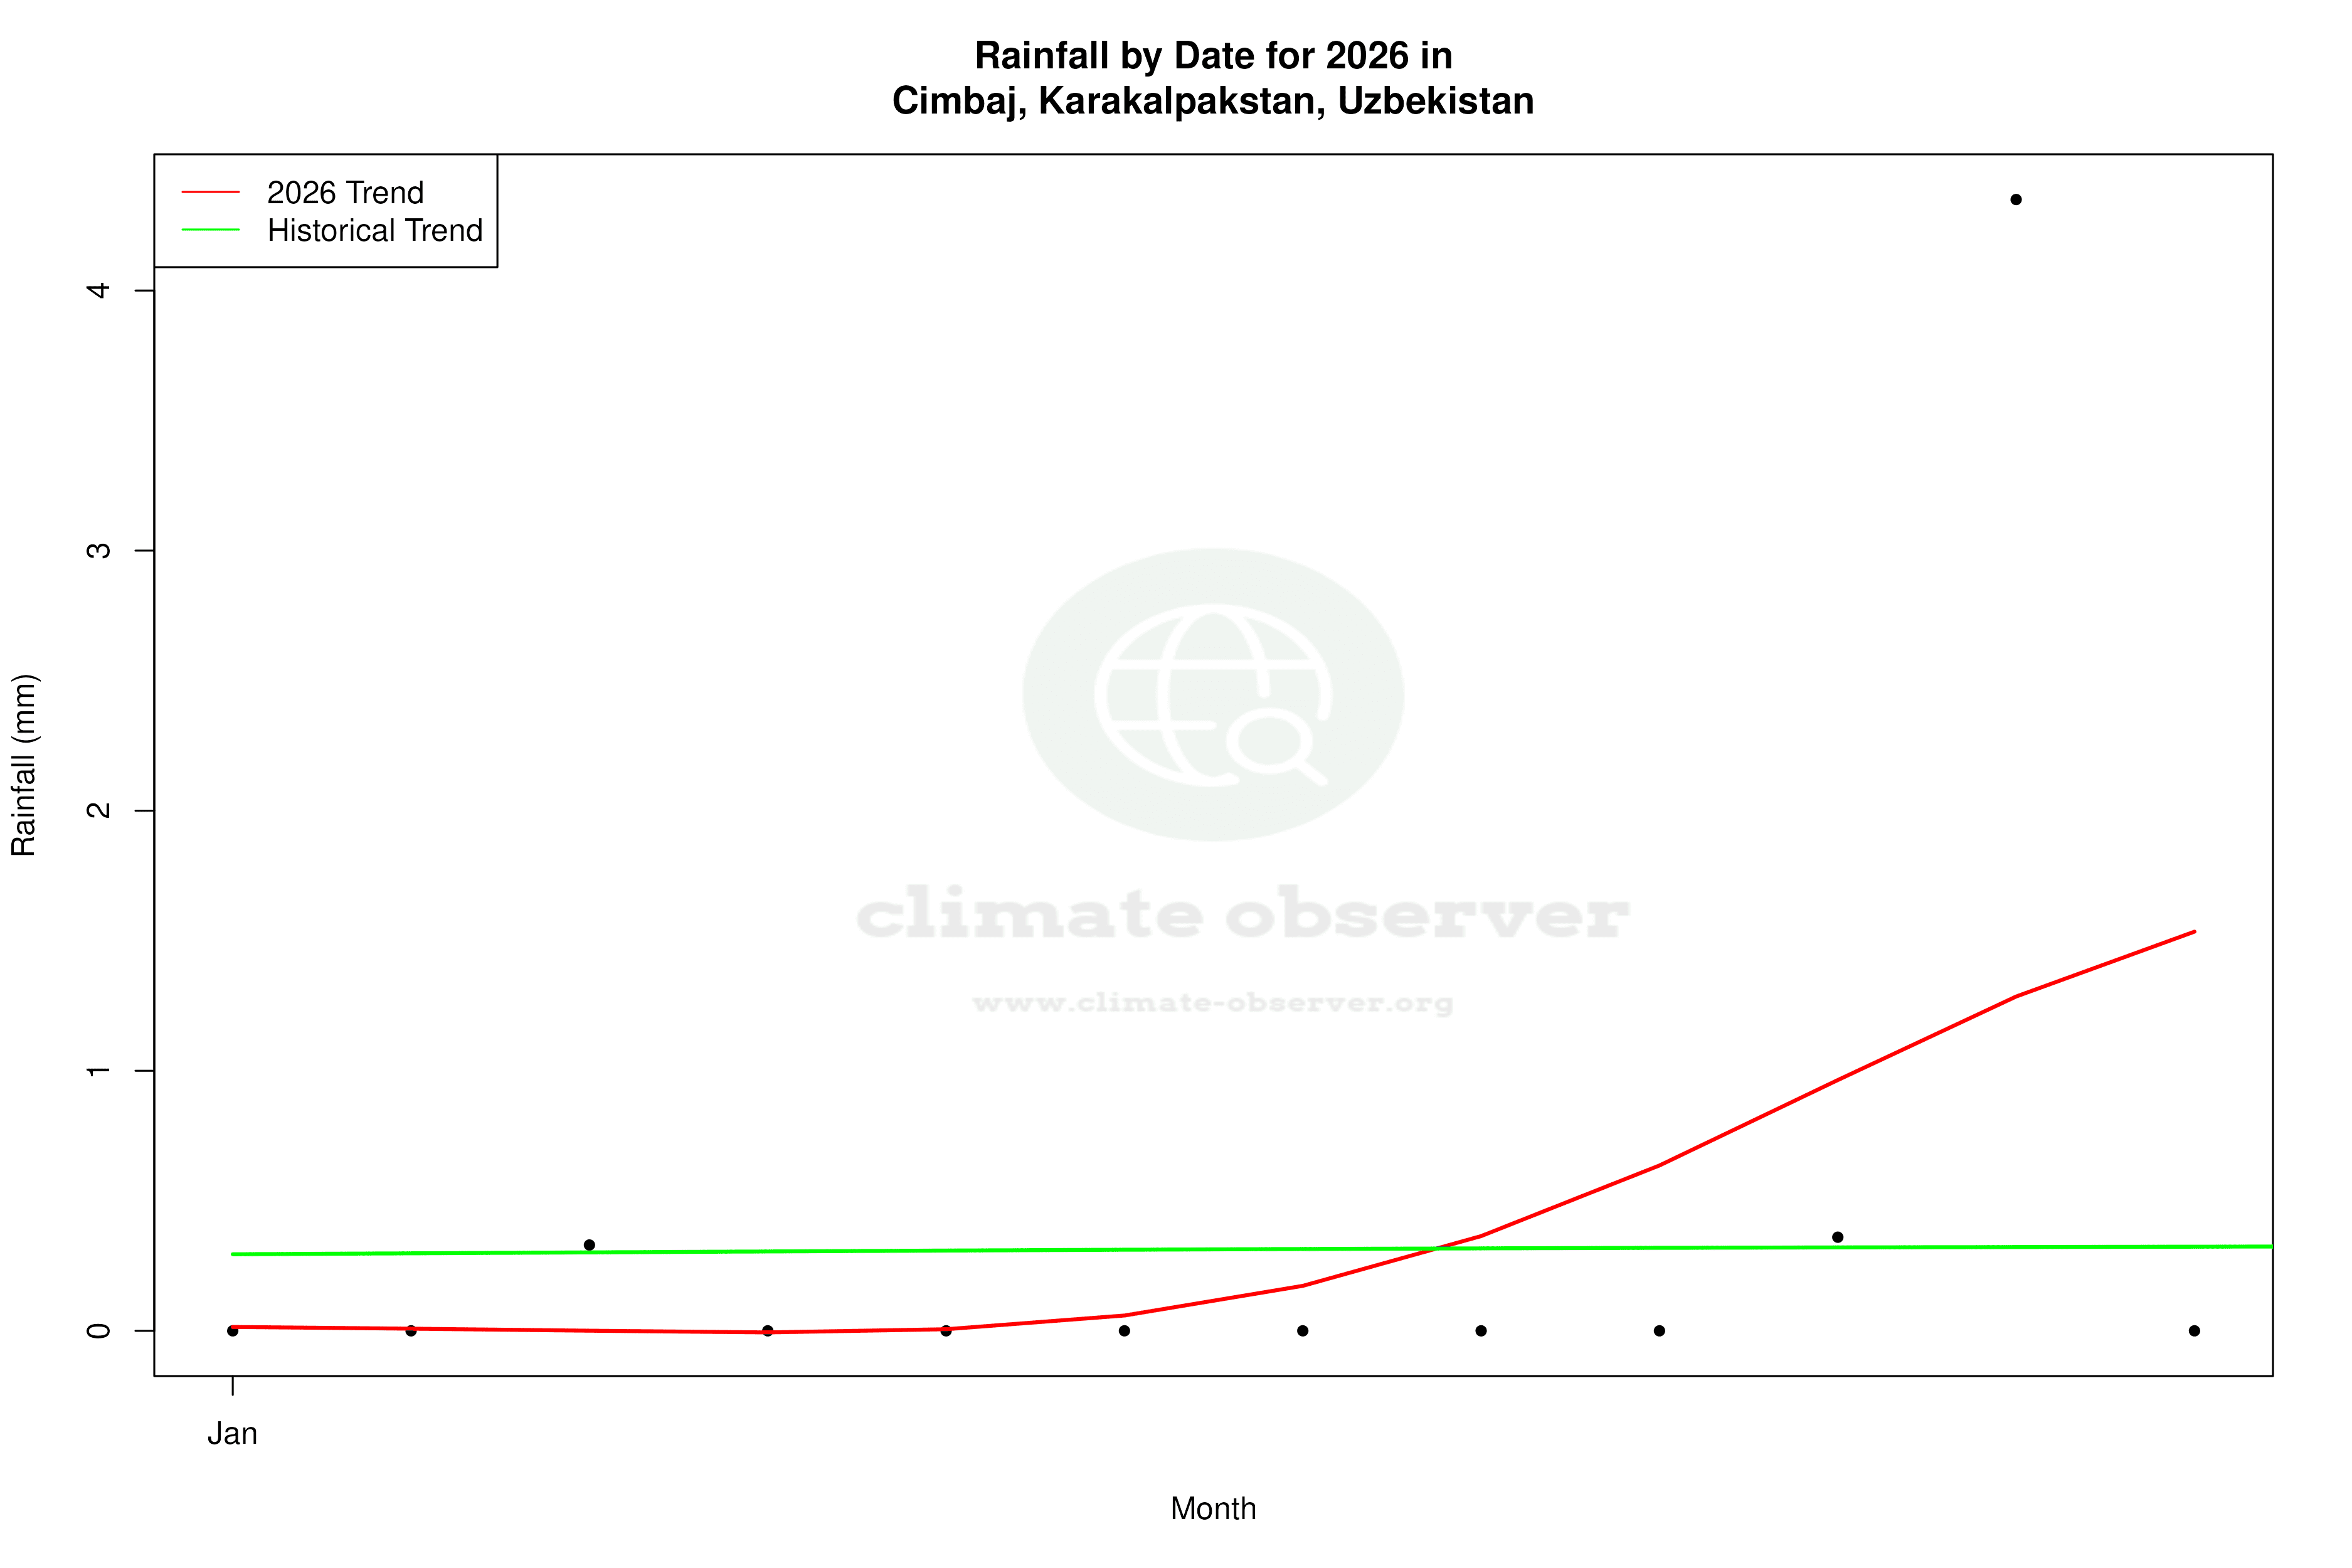
The Precipitation Concentration Index (PCI) for Cimbaj has shown a significant increase from a baseline of 20.1 to a current value of 25.4. This indicates that precipitation events have become more concentrated over fewer occurrences, increasing the potential for flash flooding and water scarcity between events. A PCI above 20 suggests highly concentrated precipitation, which can complicate water resource management and agricultural planning in this already arid region.
Regional Implications and Climate Goals
Uzbekistan has been focusing on enhancing water management and agricultural resilience in response to climate change. The trends observed in Cimbaj align with broader regional patterns of warming and precipitation variability. These changes pose challenges but also opportunities for implementing adaptive strategies, such as improved irrigation practices and drought-resistant crops, to mitigate the impacts of climate variability.
The Broader Climate Context
Cimbaj's climate trends are part of a larger narrative of global climate change, where rising temperatures and altered precipitation patterns are becoming increasingly common. The region's warming aligns with global observations, reinforcing the urgency of international and local efforts to address climate change impacts. As Uzbekistan continues to develop its climate policies, the data from Cimbaj can provide valuable insights into the effectiveness of these strategies and the need for ongoing adaptation measures.
Station Statistics
10-Year Trend
High: +2.33 °F/decade
Low: +2.71 °F/decade
Rain: -0.001 in/decade
25-Year Trend
High: +1.16 °F/decade
Low: +0.54 °F/decade
Rain: -0.001 in/decade
50-Year Trend
High: +0.80 °F/decade
Low: +0.73 °F/decade
Rain: -0.000 in/decade
All-Time Trend
High: +0.59 °F/decade
Low: +0.63 °F/decade
Rain: +0.000 in/decade
Percentage Above-Average Days
Last 12 Months: 60.5%
This Year: 69.5%
Precipitation Concentration Index (PCI) ℹ️
Last 12 Months: 17.9
Historical Average: 19.1
Percentile Rank of Last 12 Months ℹ️
High: 88th percentile
Low: 99th percentile
Rain: 76th percentile
Change in Variance ℹ️
High: +0.5%
Low: +0.2%
Intraday: +3.9%
Data Coverage
99.3%
First Year of Data
1936
Station Location
Historical Weather Records
| Max High | Avg High | Min High | Max Avg | Avg Avg | Min Avg | Max Low | Avg Low | Min Low | Max Precipitation | Avg Precipitation | Max Snow | Avg Snow | |
|---|---|---|---|---|---|---|---|---|---|---|---|---|---|
| Record | 118.24 °F | — | -9.40 °F | 96.44 °F | — | -15.52 °F | 85.28 °F | — | -28.66 °F | 1.21 in | — | — | — |
| January | 62.60 °F | 32.10 °F | -4.18 °F | 49.64 °F | 23.04 °F | -15.52 °F | 43.34 °F | 15.76 °F | -28.66 °F | 0.59 in | 0.01 in | — | — |
| February | 81.86 °F | 37.14 °F | -9.40 °F | 60.62 °F | 26.22 °F | -14.44 °F | 44.24 °F | 17.93 °F | -21.28 °F | 1.07 in | 0.01 in | — | — |
| March | 91.58 °F | 51.55 °F | 8.60 °F | 72.41 °F | 39.09 °F | -2.92 °F | 58.64 °F | 29.32 °F | -8.68 °F | 1.03 in | 0.02 in | — | — |
| April | 100.40 °F | 70.12 °F | 37.40 °F | 83.30 °F | 56.32 °F | 28.40 °F | 70.88 °F | 44.13 °F | 16.16 °F | 1.21 in | 0.02 in | — | — |
| May | 110.30 °F | 83.20 °F | 50.18 °F | 92.66 °F | 69.50 °F | 44.60 °F | 79.16 °F | 55.76 °F | 31.10 °F | 0.83 in | 0.02 in | — | — |
| June | 109.94 °F | 91.78 °F | 65.66 °F | 96.24 °F | 78.23 °F | 58.10 °F | 82.76 °F | 63.47 °F | 32.00 °F | 0.64 in | 0.01 in | — | — |
| July | 118.24 °F | 94.76 °F | 73.22 °F | 96.44 °F | 81.29 °F | 64.76 °F | 85.28 °F | 67.57 °F | 47.12 °F | 0.61 in | 0.00 in | — | — |
| August | 114.80 °F | 91.15 °F | 69.44 °F | 94.28 °F | 76.80 °F | 57.92 °F | 83.48 °F | 63.36 °F | 44.24 °F | 0.56 in | 0.00 in | — | — |
| September | 105.80 °F | 80.41 °F | 47.84 °F | 86.18 °F | 64.96 °F | 37.22 °F | 74.17 °F | 51.35 °F | 25.52 °F | 0.74 in | 0.00 in | — | — |
| October | 93.20 °F | 65.47 °F | 27.86 °F | 73.58 °F | 50.46 °F | 20.84 °F | 64.40 °F | 38.25 °F | 8.24 °F | 0.80 in | 0.01 in | — | — |
| November | 80.96 °F | 48.69 °F | 8.24 °F | 65.48 °F | 36.78 °F | -1.84 °F | 55.76 °F | 27.49 °F | -13.90 °F | 0.76 in | 0.01 in | — | — |
| December | 70.16 °F | 35.41 °F | -0.40 °F | 54.50 °F | 26.49 °F | -10.84 °F | 43.52 °F | 19.48 °F | -21.46 °F | 0.56 in | 0.01 in | — | — |
Data Visualisations
Remove WatermarksCurrent Year Climate Trends vs Historical
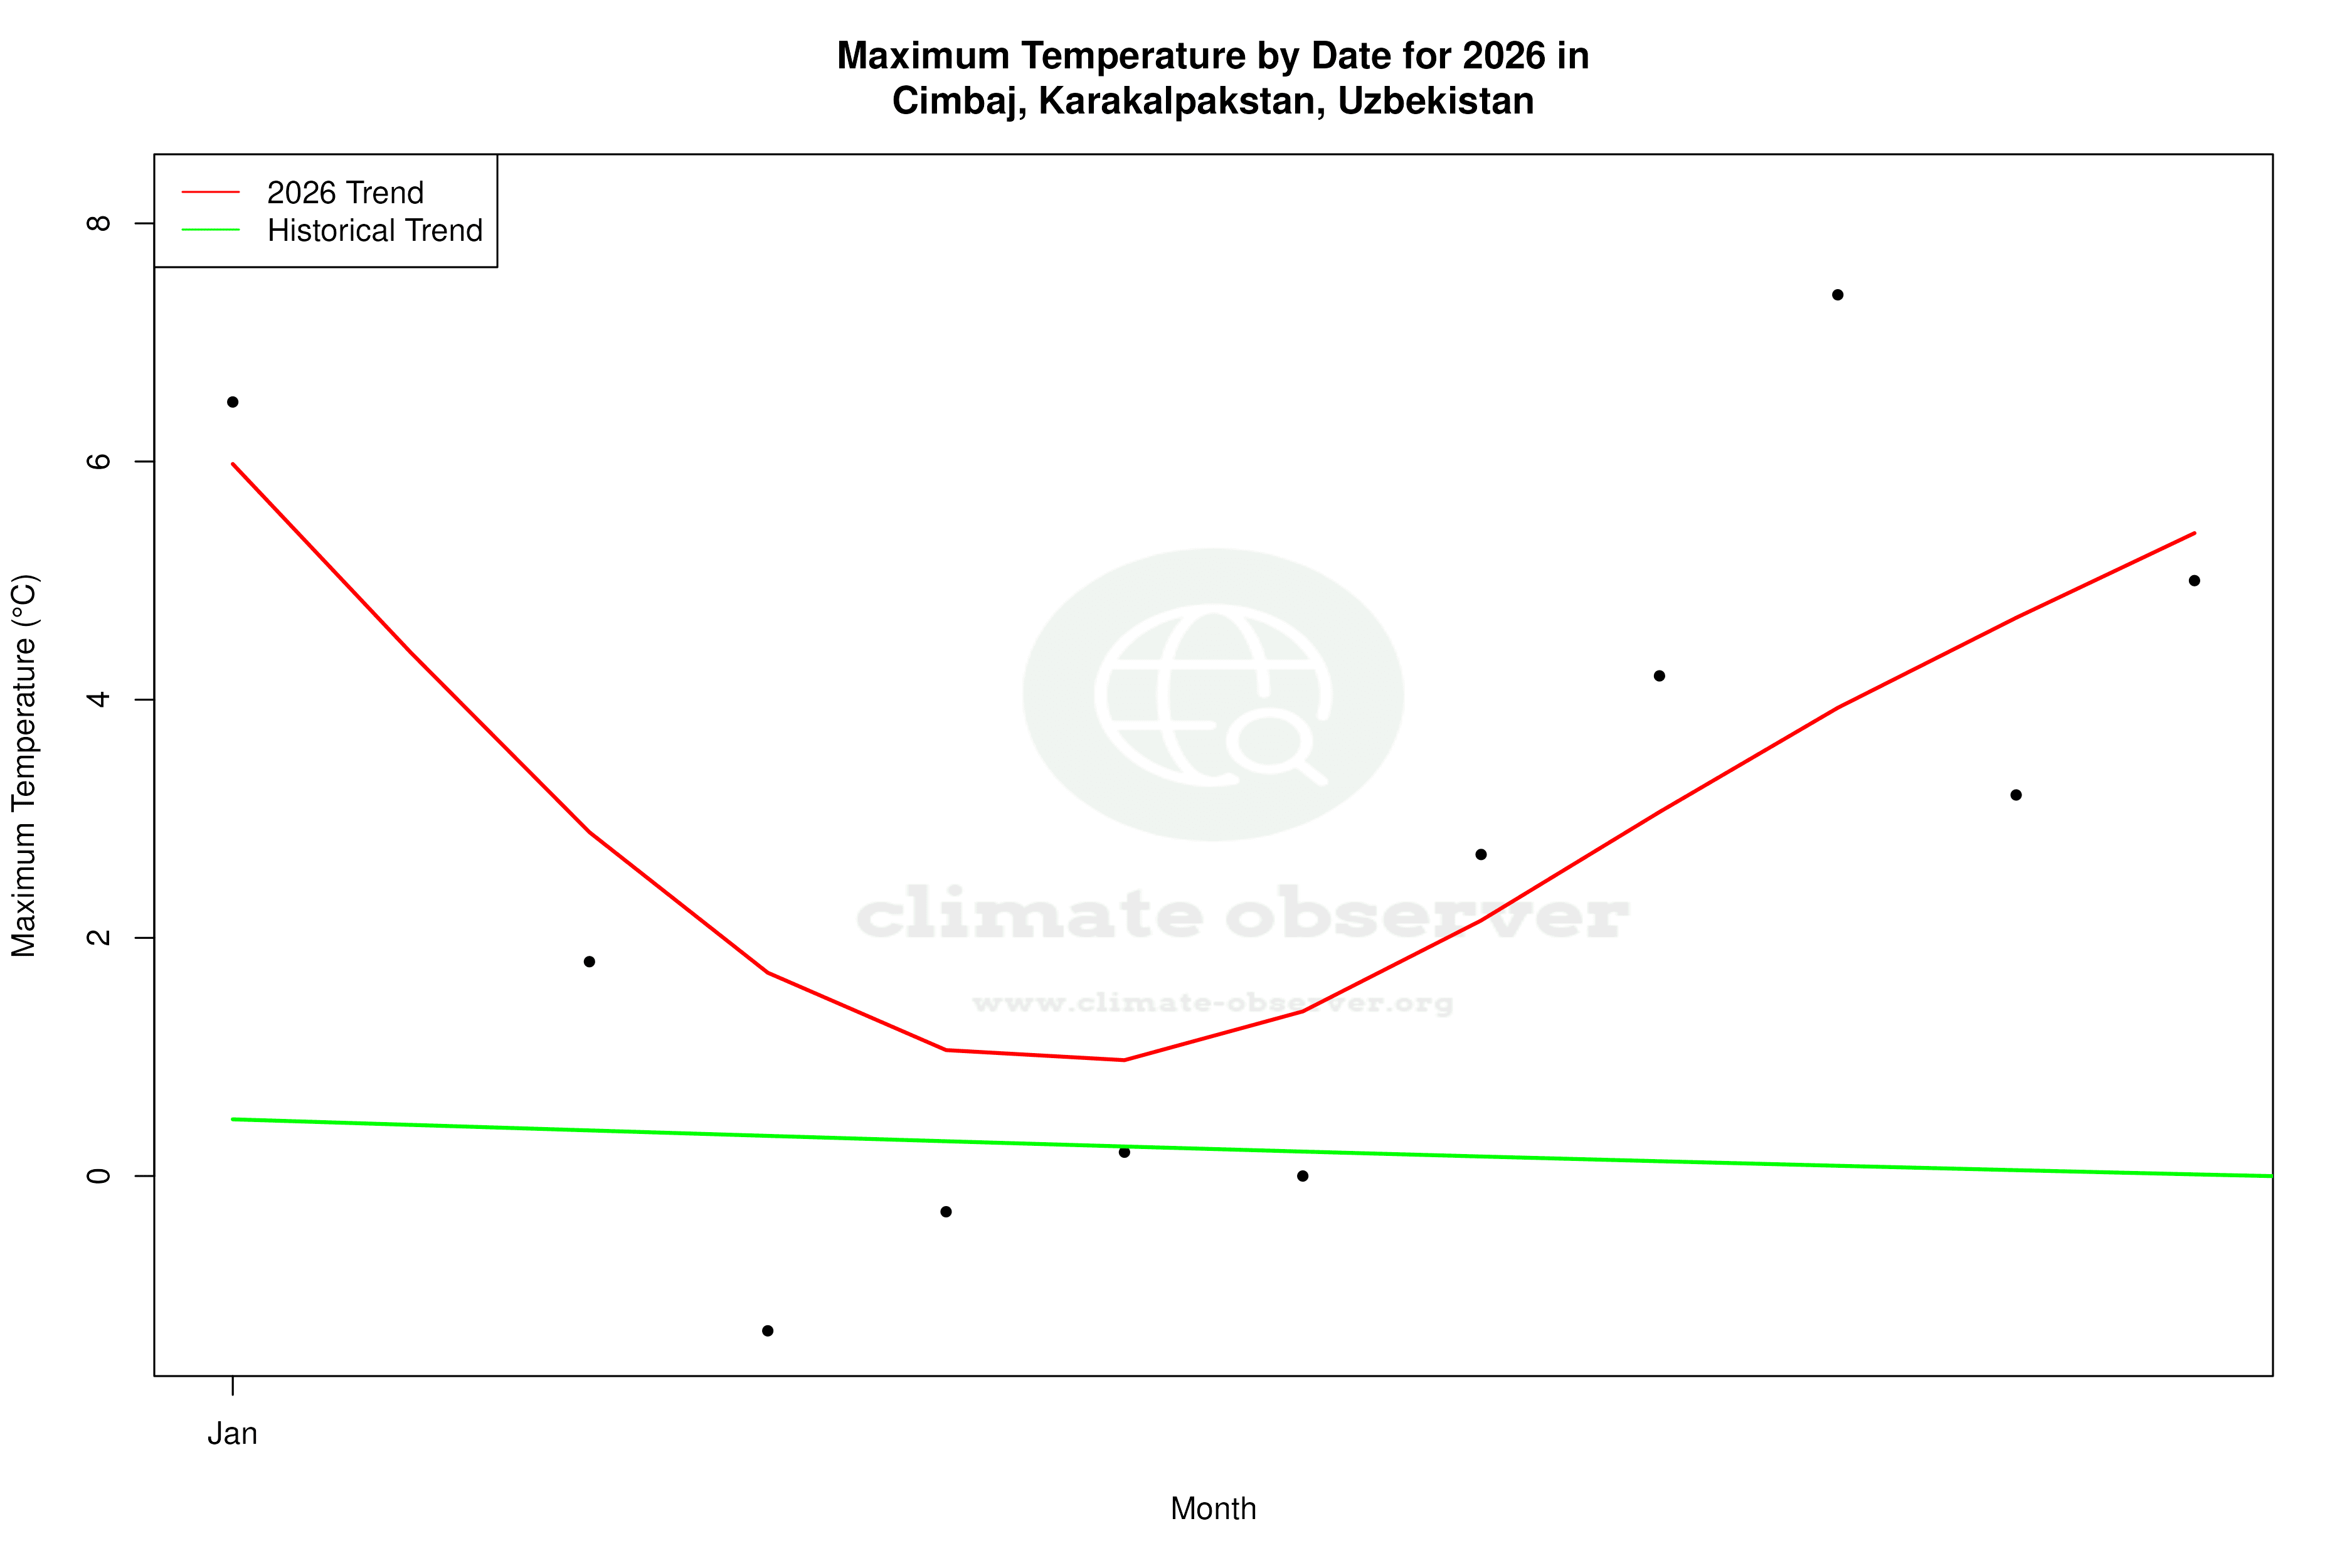


Max Temperature this Year | 1 of 6
Climate 12-Month Moving Averages


Max Temperature 12-Month MA | 1 of 6
Daily Data Points and Averages Throughout the Year
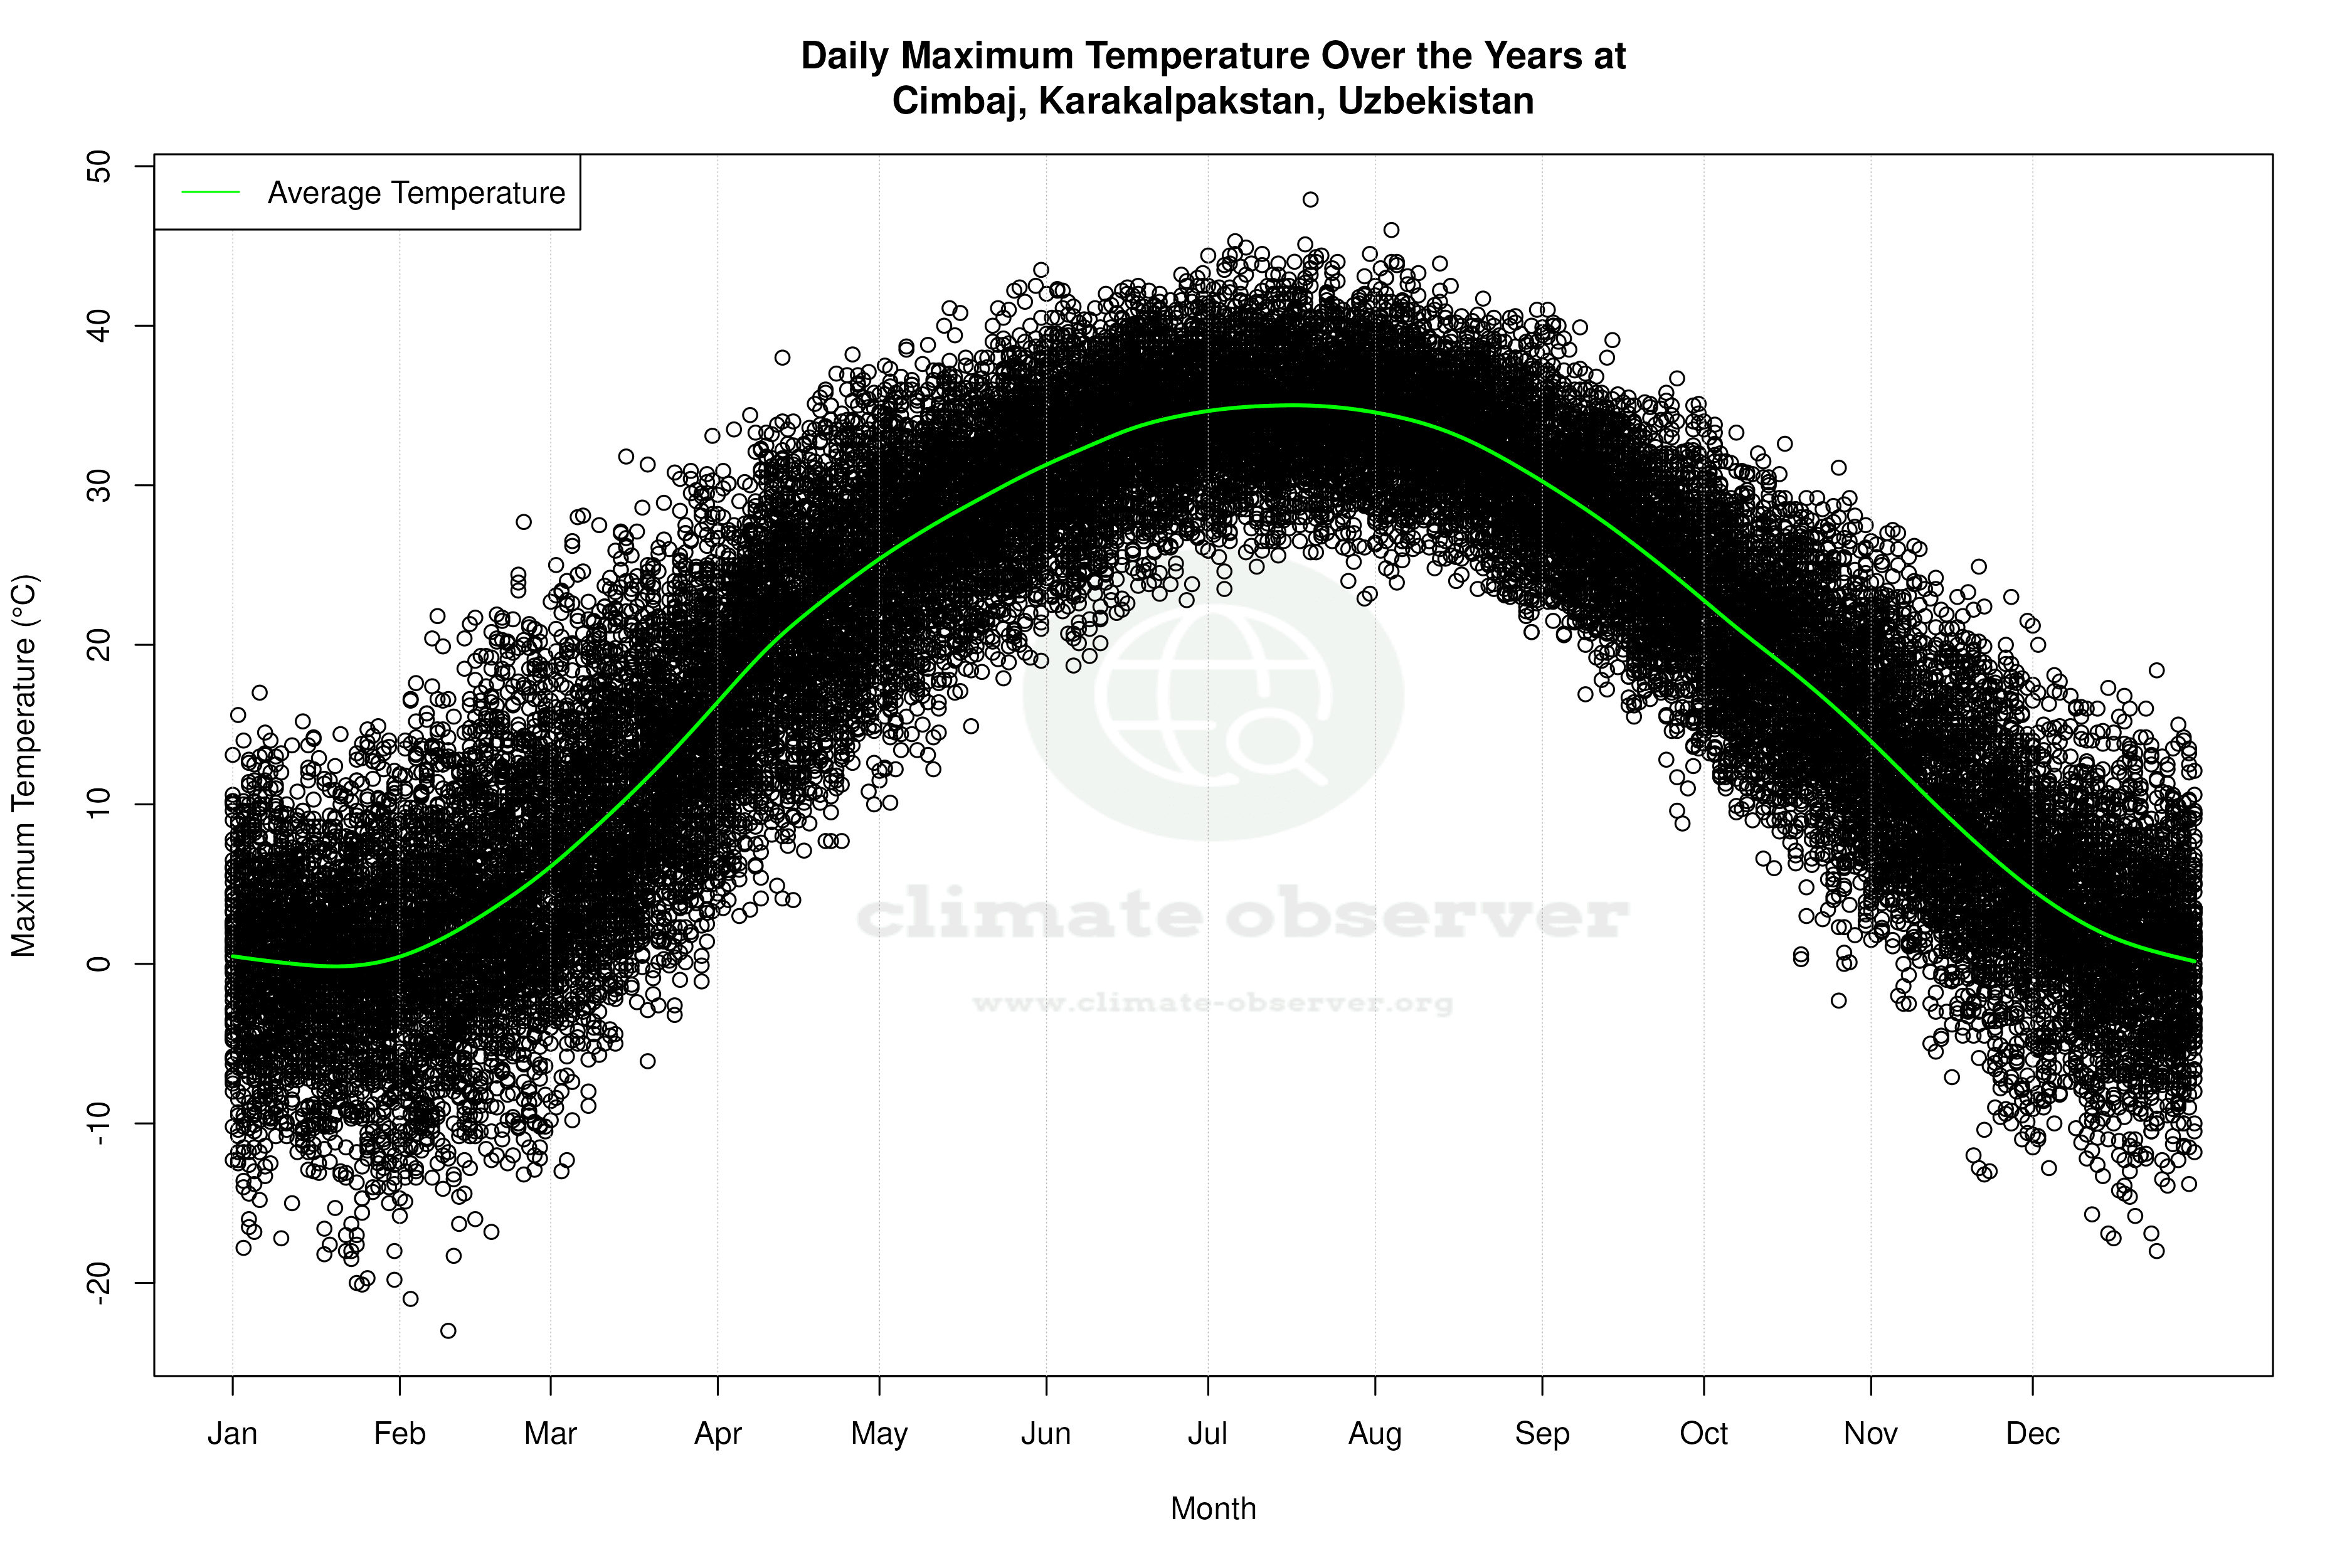

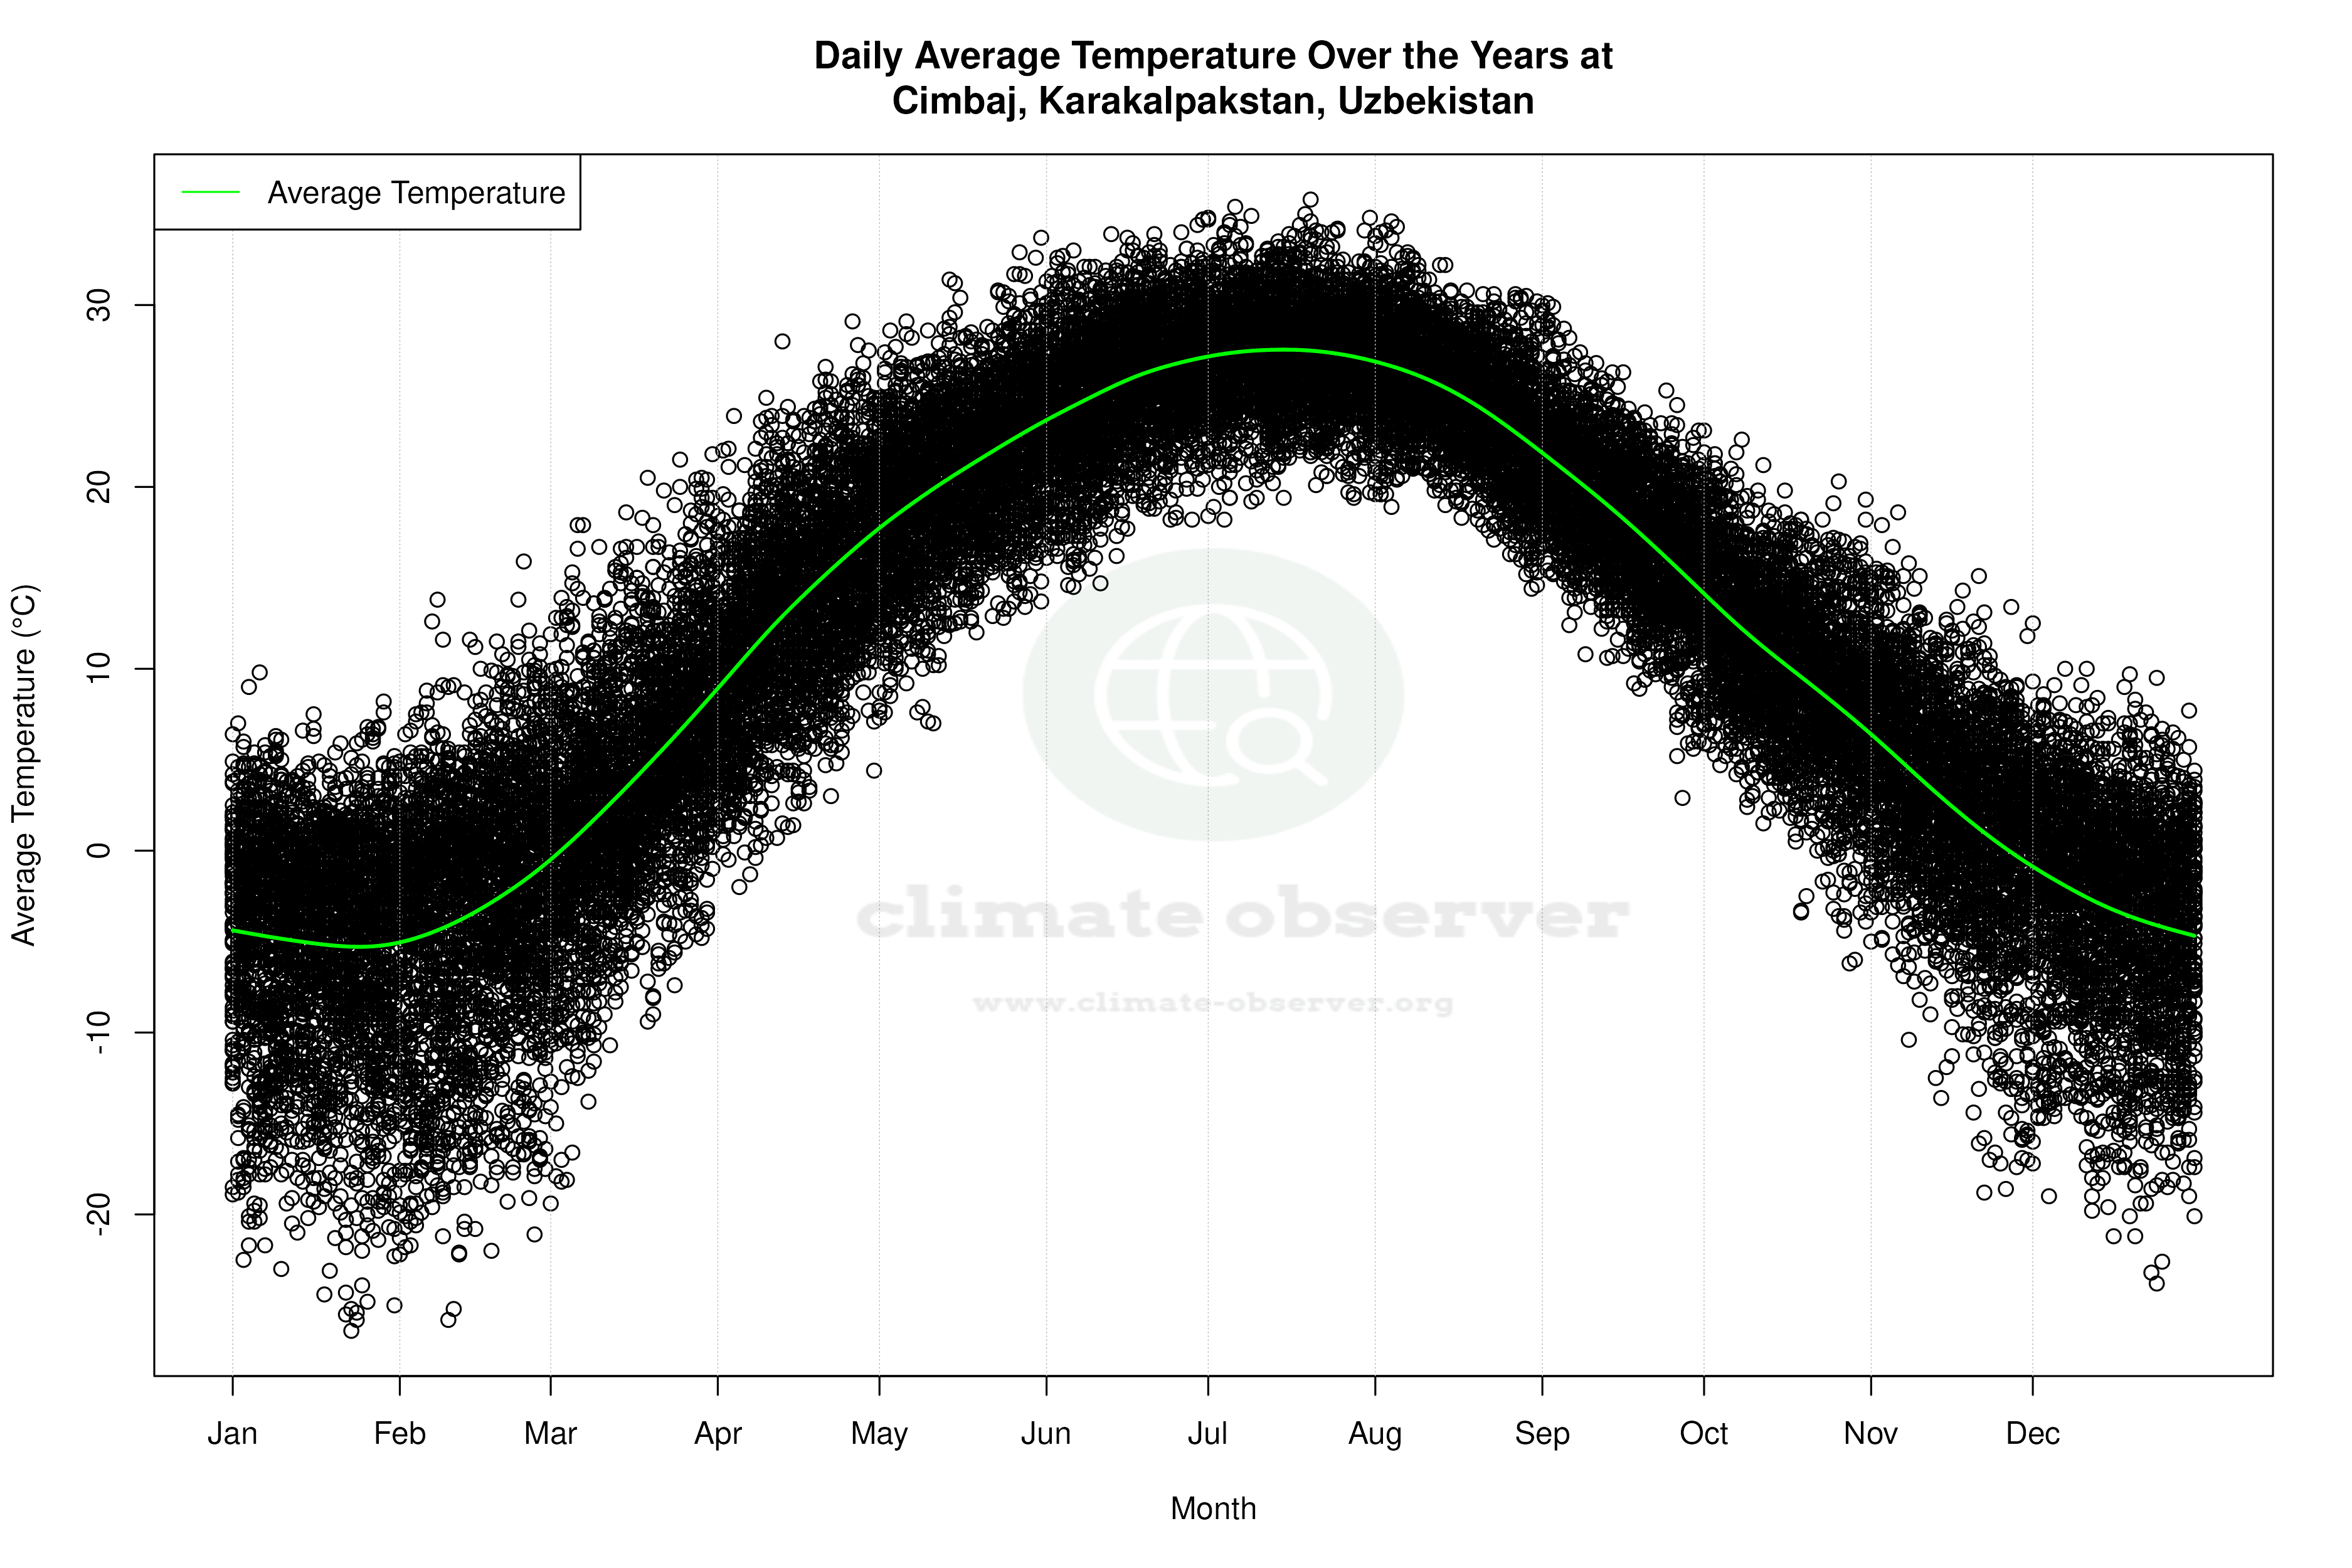


Average Max Temperature Throughout Year | 1 of 5
