Climate for Station: Ca Mau, Vietnam
Loading live weather...
Climate Analysis & Overview
Ca Mau, located in Vietnam's southernmost region, is experiencing a distinct climatic shift. Over the past decade, the area has seen a cooling trend in high temperatures but a warming trend in lows, indicating a narrowing of the temperature range. Meanwhile, precipitation has become more evenly distributed, suggesting a shift towards a more stable rainfall pattern.
Tropical Climate Dynamics
Ca Mau is classified under the Köppen climate classification as a tropical monsoon climate. This region is influenced by its proximity to the Gulf of Thailand and the South China Sea, which contribute to its humid and warm conditions. The all-time temperature trends reveal a cooling of high temperatures by 0.02°C (0.04°F), while low temperatures have shown a warming of 0.25°C (0.45°F). This indicates a slight narrowing of the temperature range over time, suggesting a subtle shift in the local climate dynamics.
Decadal Temperature Shifts
In the past decade, high temperatures in Ca Mau have decreased by 0.12°C (0.22°F), contrasting with a rise in low temperatures by 0.44°C (0.79°F). This recent data highlights a more pronounced change in the temperature profile, with cooler days and warmer nights becoming more common. Such trends could have implications for local agriculture and energy consumption, as the demand for cooling during the day might decrease while the need for heating at night could rise.
Precipitation Patterns and Distribution
The Precipitation Concentration Index (PCI) for Ca Mau has decreased from a baseline of 14.67 to a current value of 11.87. This shift indicates that rainfall is now more evenly distributed throughout the year, reducing the risk of extreme weather events such as floods and droughts. For a region that relies heavily on agriculture, this change could mean more predictable growing seasons and potentially higher crop yields.
Temperature Extremes
Ca Mau has recorded an absolute maximum temperature of 39.9°C (103.8°F) and a minimum of 15.0°C (59.0°F). These extremes underscore the variability inherent in a tropical climate, where high humidity and warm temperatures are the norm. Understanding these extremes is crucial for developing strategies to mitigate heat-related health risks and optimise agricultural practices.
Regional Climate Considerations
Vietnam has been actively pursuing climate adaptation strategies, aiming to mitigate the impacts of climate change on its vulnerable coastal regions. The observed trends in Ca Mau, with its cooling highs and warming lows, align with broader regional efforts to adapt to changing climatic conditions. These efforts include enhancing water management systems and developing resilient agricultural practices to cope with the evolving climate landscape.
Station Statistics
10-Year Trend
High: -0.23 °F/decade
Low: +1.07 °F/decade
Rain: +0.046 in/decade
25-Year Trend
High: -0.30 °F/decade
Low: +0.59 °F/decade
Rain: +0.012 in/decade
50-Year Trend
High: -0.05 °F/decade
Low: +0.47 °F/decade
Rain: +0.035 in/decade
All-Time Trend
High: -0.05 °F/decade
Low: +0.47 °F/decade
Rain: +0.035 in/decade
Percentage Above-Average Days
Last 12 Months: 38.1%
This Year: 42.8%
Precipitation Concentration Index (PCI) ℹ️
Last 12 Months: 12.0
Historical Average: 15.9
Percentile Rank of Last 12 Months ℹ️
High: 2nd percentile
Low: 99th percentile
Rain: 80th percentile
Change in Variance ℹ️
High: -4.0%
Low: -21.2%
Intraday: -8.3%
Data Coverage
77.1%
First Year of Data
1957
Station Location
Historical Weather Records
| Max High | Avg High | Min High | Max Avg | Avg Avg | Min Avg | Max Low | Avg Low | Min Low | Max Precipitation | Avg Precipitation | Max Snow | Avg Snow | |
|---|---|---|---|---|---|---|---|---|---|---|---|---|---|
| Record | 103.82 °F | — | 73.40 °F | 91.04 °F | — | 67.64 °F | 87.62 °F | — | 59.00 °F | 7.80 in | — | — | — |
| January | 95.54 °F | 86.94 °F | 76.28 °F | 85.46 °F | 78.99 °F | 67.82 °F | 80.96 °F | 73.71 °F | 59.00 °F | 1.42 in | 0.02 in | — | — |
| February | 97.21 °F | 88.93 °F | 79.16 °F | 88.34 °F | 80.02 °F | 69.62 °F | 80.60 °F | 74.51 °F | 64.04 °F | 1.69 in | 0.01 in | — | — |
| March | 99.86 °F | 91.33 °F | 83.84 °F | 88.45 °F | 82.14 °F | 74.84 °F | 82.89 °F | 76.40 °F | 59.18 °F | 1.62 in | 0.02 in | — | — |
| April | 99.77 °F | 92.92 °F | 82.40 °F | 91.04 °F | 84.09 °F | 76.10 °F | 84.65 °F | 78.63 °F | 66.02 °F | 3.30 in | 0.10 in | — | — |
| May | 103.82 °F | 91.60 °F | 78.08 °F | 89.96 °F | 83.56 °F | 75.74 °F | 87.62 °F | 79.32 °F | 69.44 °F | 4.48 in | 0.25 in | — | — |
| June | 98.24 °F | 88.85 °F | 78.62 °F | 90.14 °F | 82.39 °F | 75.02 °F | 86.36 °F | 78.36 °F | 68.90 °F | 3.98 in | 0.34 in | — | — |
| July | 102.20 °F | 87.83 °F | 78.26 °F | 87.80 °F | 81.76 °F | 74.30 °F | 84.20 °F | 77.73 °F | 69.08 °F | 5.51 in | 0.36 in | — | — |
| August | 103.46 °F | 87.64 °F | 77.54 °F | 88.34 °F | 81.57 °F | 74.48 °F | 84.38 °F | 77.62 °F | 68.90 °F | 7.32 in | 0.36 in | — | — |
| September | 93.92 °F | 87.22 °F | 77.00 °F | 87.98 °F | 81.24 °F | 72.50 °F | 85.28 °F | 77.46 °F | 64.40 °F | 7.36 in | 0.42 in | — | — |
| October | 100.40 °F | 87.25 °F | 76.46 °F | 88.16 °F | 81.05 °F | 71.96 °F | 84.38 °F | 77.29 °F | 71.06 °F | 7.80 in | 0.39 in | — | — |
| November | 98.60 °F | 86.81 °F | 77.36 °F | 86.00 °F | 80.78 °F | 71.42 °F | 83.66 °F | 76.64 °F | 68.00 °F | 4.25 in | 0.21 in | — | — |
| December | 93.92 °F | 86.14 °F | 73.40 °F | 85.10 °F | 79.40 °F | 67.64 °F | 82.40 °F | 74.69 °F | 62.60 °F | 2.62 in | 0.06 in | — | — |
Data Visualisations
Remove WatermarksCurrent Year Climate Trends vs Historical


Max Temperature this Year | 1 of 6
Climate 12-Month Moving Averages


Max Temperature 12-Month MA | 1 of 6
Daily Data Points and Averages Throughout the Year


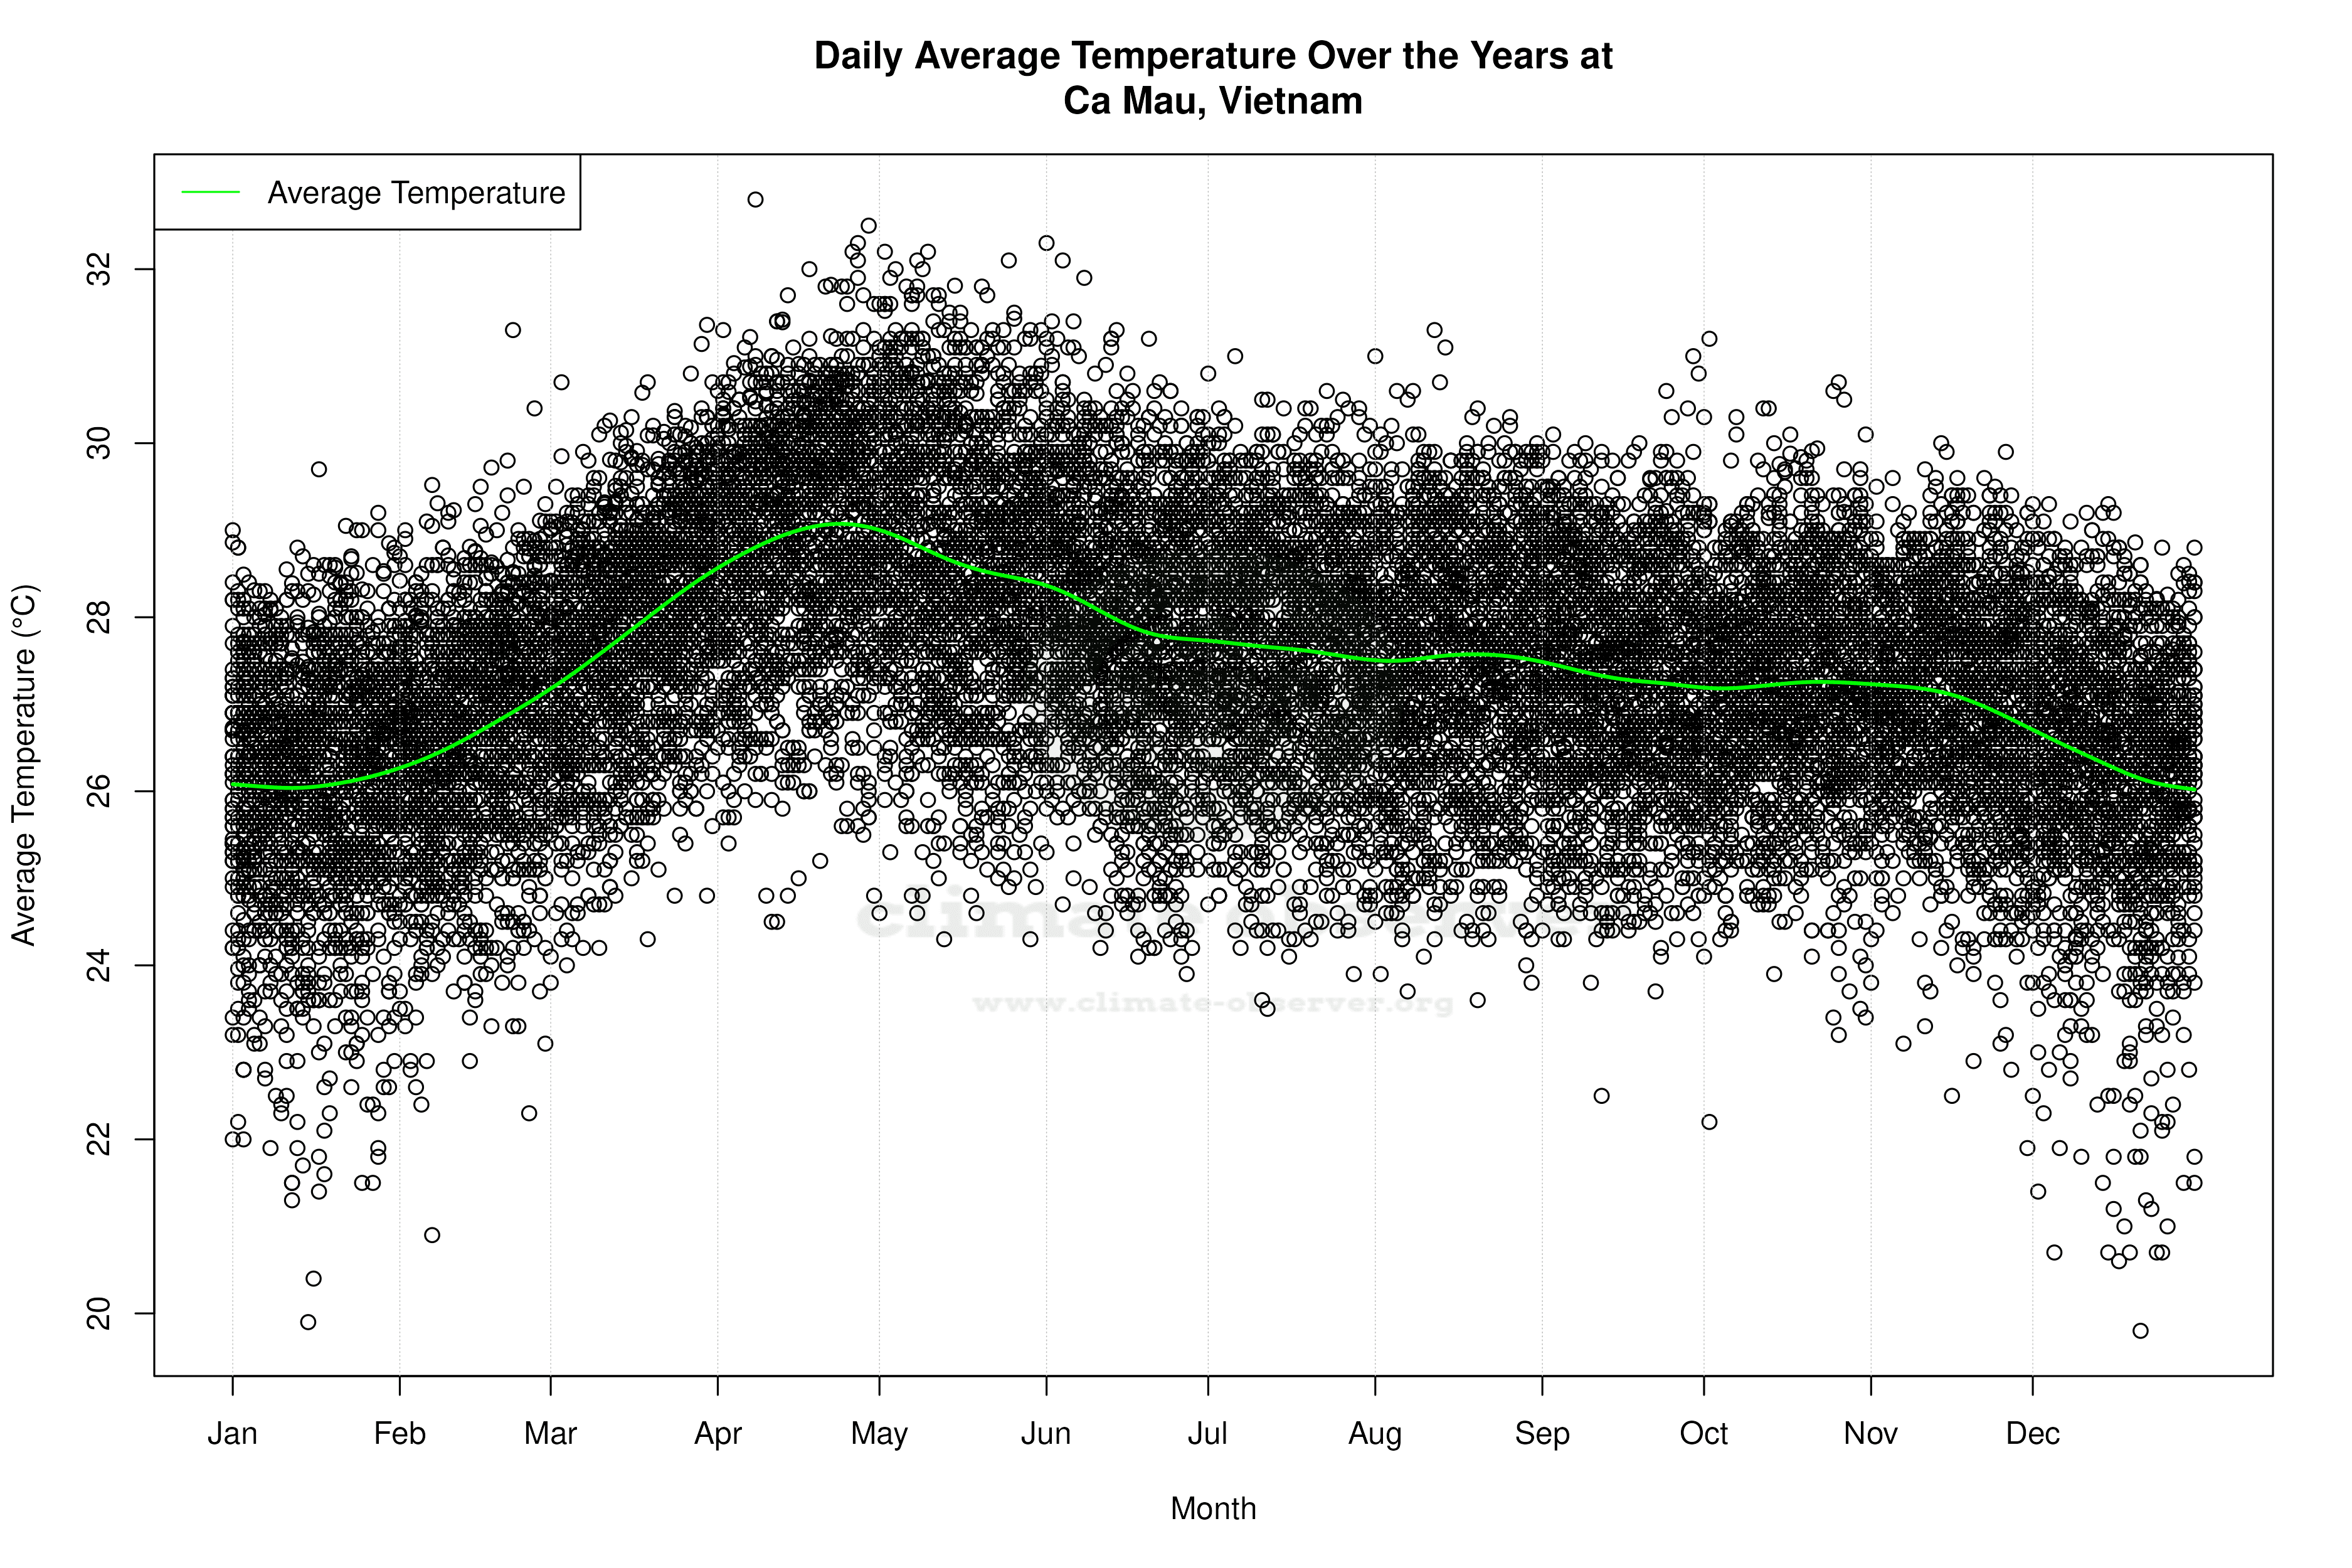


Average Max Temperature Throughout Year | 1 of 5
