Climate for Station: Windhoek, Khomas, Namibia
Loading live weather...
Climate Analysis & Overview
Windhoek's climate profile reveals a complex interplay of warming and cooling trends. While all-time data indicates a 0.56°C (1.01°F) rise in high temperatures, recent 10-year trends show a cooling of 0.65°C (1.17°F) in highs. Meanwhile, low temperatures have consistently risen, reflecting a 0.41°C (0.74°F) increase over the past decade. Precipitation patterns have shifted slightly towards more even distribution, with the PCI decreasing from 23.74 to 20.79.
Desert Climate Dynamics
Windhoek, located at the coordinates -22.567, 17.1, is nestled in the Khomas Region of Namibia, characterised by a BSh climate under the Köppen classification—indicating a semi-arid, hot desert climate. The city's geographical setting, surrounded by the Khomas Highland plateau, influences its climate by moderating extreme temperatures and contributing to its dry conditions. The all-time temperature trends show a warming of 0.56°C (1.01°F) in high temperatures, a pattern consistent with global climate change impacts. However, the region's unique topography tempers these shifts, creating a microclimate that can diverge from broader trends.
Temperature Trends: A Tale of Two Scales
The dichotomy between long-term and recent temperature trends in Windhoek is striking. Over the past decade, high temperatures have experienced a cooling of 0.65°C (1.17°F), contrasting with the all-time warming trend. This suggests a short-term anomaly possibly influenced by regional climatic variations or localised weather events. Conversely, low temperatures have risen by 0.41°C (0.74°F) over the same period, aligning with the all-time increase of 0.10°C (0.18°F). This consistent rise in lows could indicate a narrowing of the diurnal temperature range, a phenomenon often linked to increased cloud cover or urban heat effects.
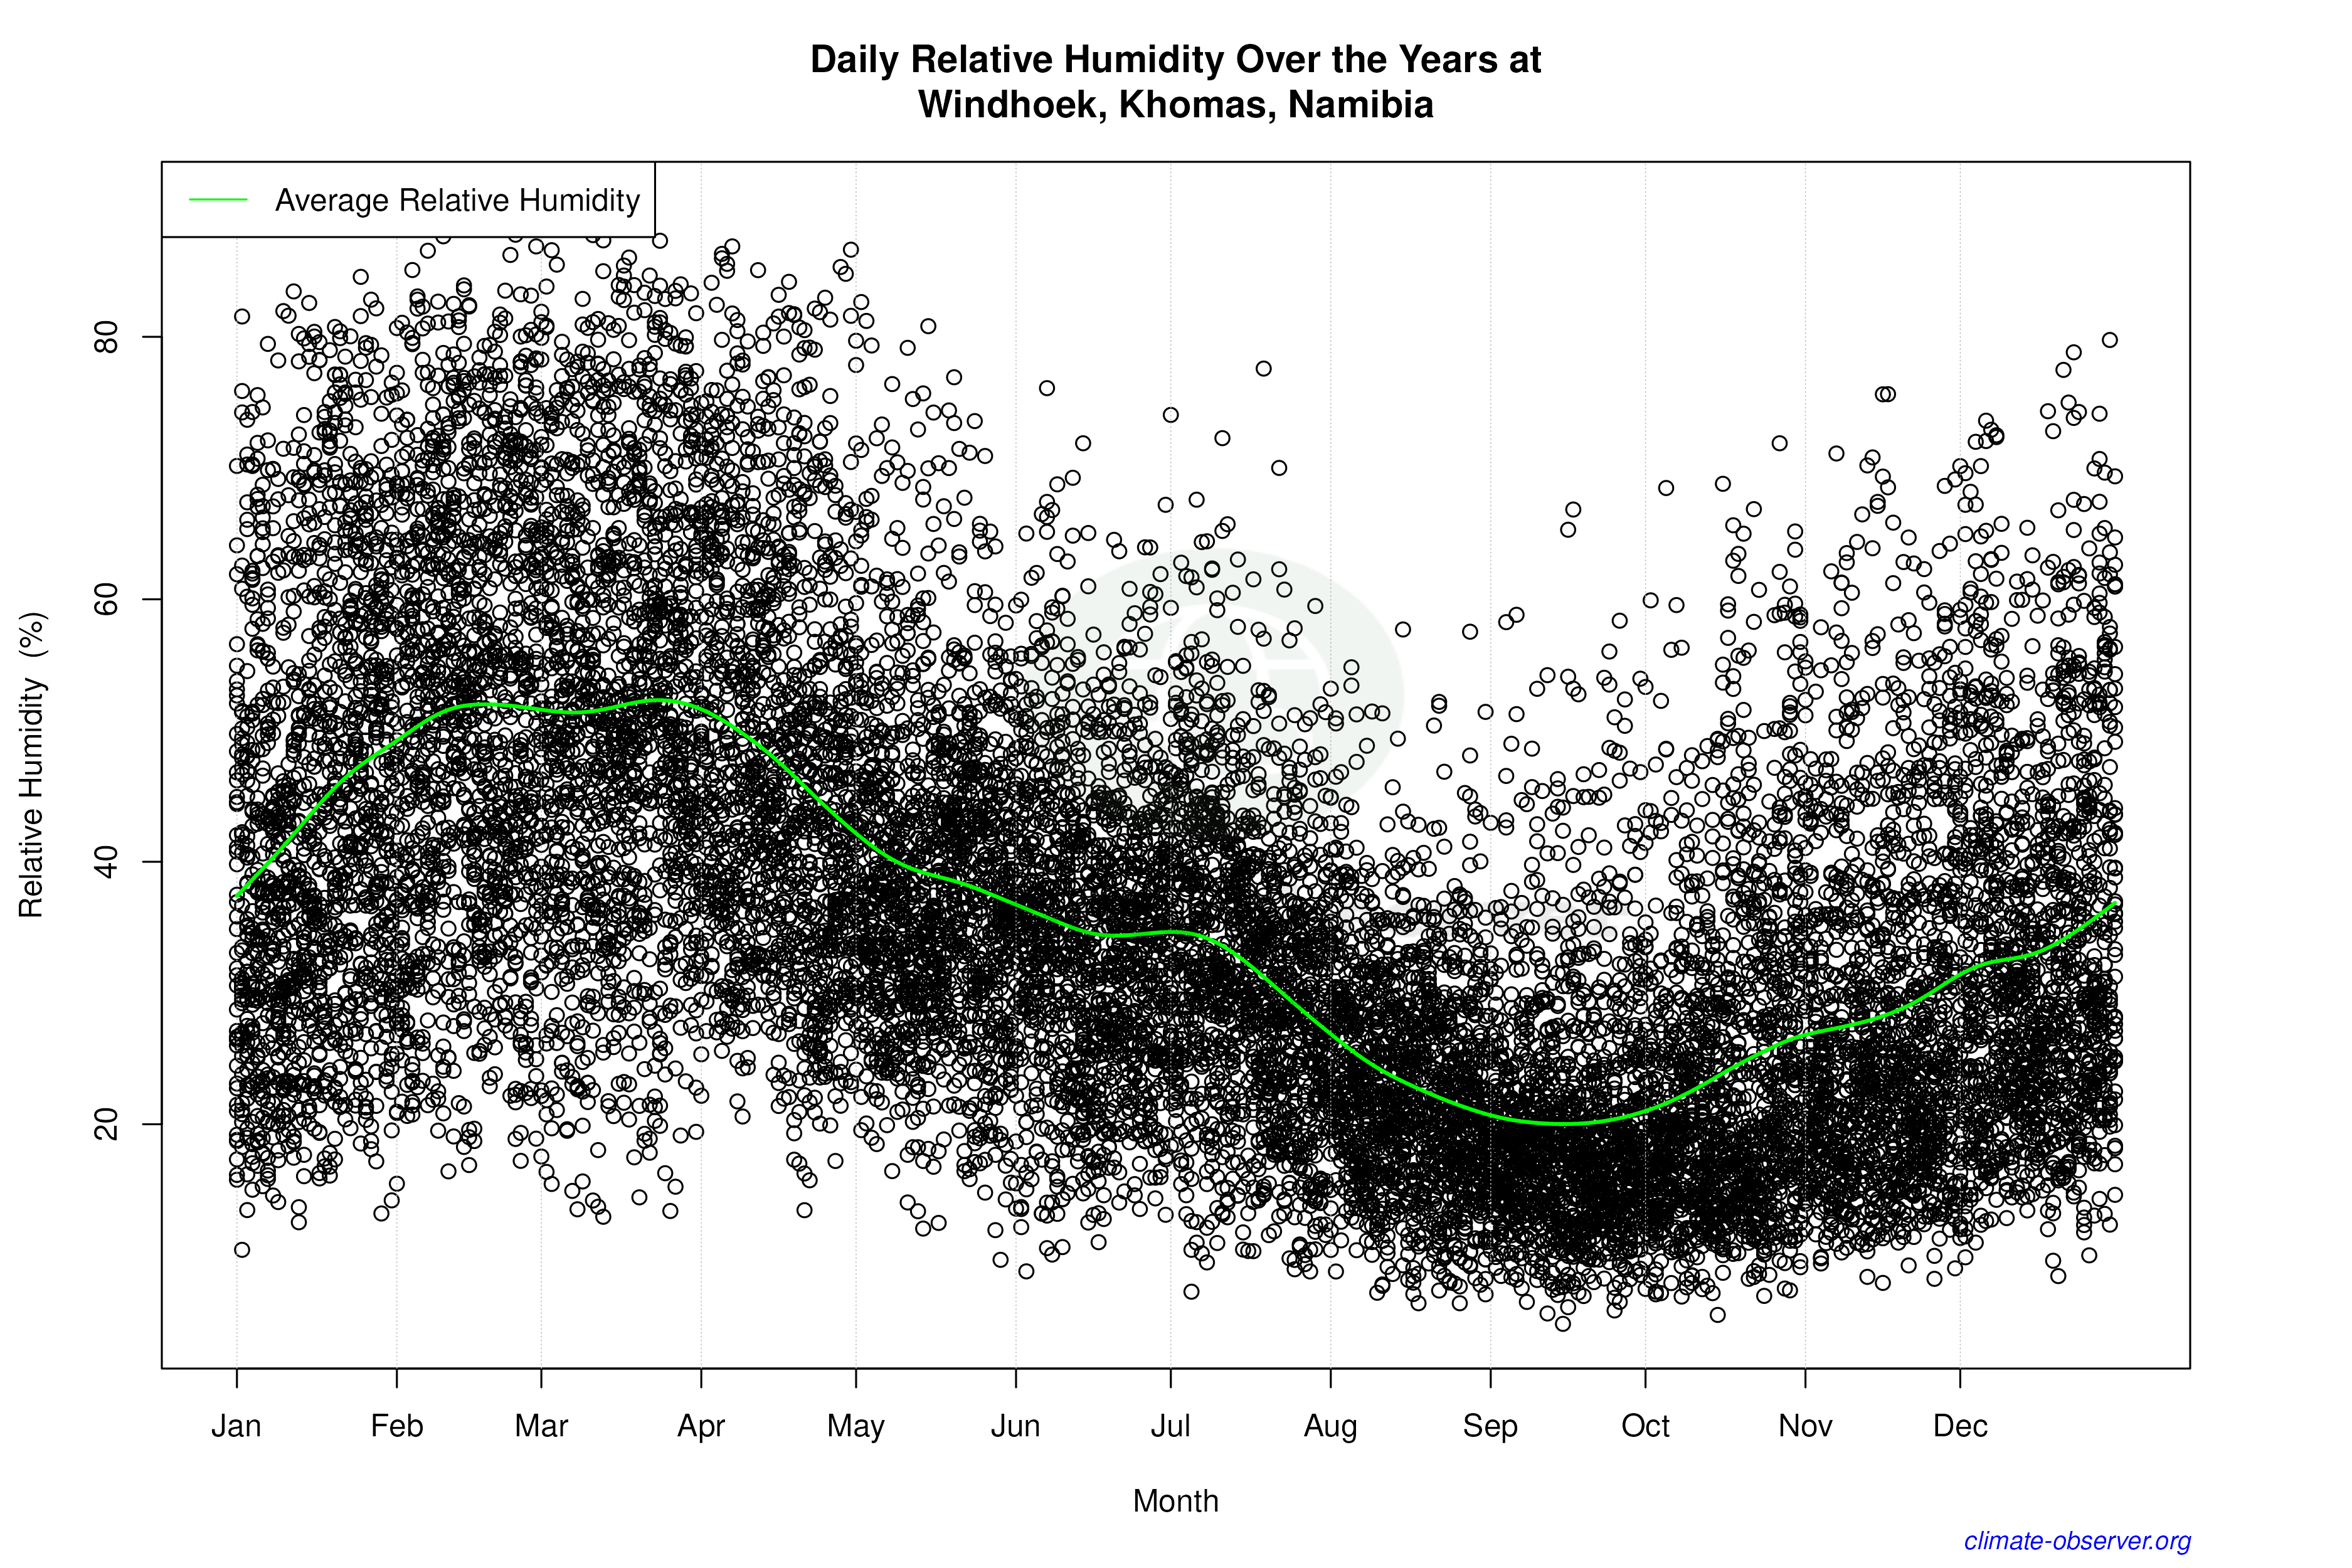
Precipitation Patterns: A Subtle Shift
Windhoek's precipitation patterns, as measured by the Precipitation Concentration Index (PCI), have shown a slight shift towards more evenly distributed rainfall. The PCI has decreased from 23.74 to 20.79, suggesting that rainfall events are becoming less concentrated and more spread out over time. This subtle change may be beneficial for agriculture and water resource management, as it reduces the risk of flooding and soil erosion associated with intense, concentrated rainfall events. However, the overall PCI remains high, indicating that precipitation is still relatively concentrated compared to more temperate regions.
Regional Implications and Climate Goals
Namibia's climate goals emphasise resilience and adaptation, particularly in semi-arid regions like Windhoek. The observed trends in temperature and precipitation align with these objectives, highlighting the need for adaptive strategies to cope with both warming and cooling phases. Recent weather events, such as droughts and heatwaves, underscore the importance of understanding these trends for future planning. The city's climate profile serves as a critical input for policymakers aiming to balance economic development with environmental sustainability in a changing climate landscape.
Station Statistics
10-Year Trend
High: -1.66 °F/decade
Low: +0.62 °F/decade
Rain: -0.009 in/decade
25-Year Trend
High: +1.05 °F/decade
Low: +0.86 °F/decade
Rain: +0.000 in/decade
50-Year Trend
High: +1.17 °F/decade
Low: +0.22 °F/decade
Rain: +0.003 in/decade
All-Time Trend
High: +0.99 °F/decade
Low: +0.19 °F/decade
Rain: +0.001 in/decade
Percentage Above-Average Days
Last 12 Months: 52.8%
This Year: 43.6%
Precipitation Concentration Index (PCI) ℹ️
Last 12 Months: 22.8
Historical Average: 25.7
Percentile Rank of Last 12 Months ℹ️
High: 64th percentile
Low: 91st percentile
Rain: 84th percentile
Change in Variance ℹ️
High: -8.3%
Low: -6.2%
Intraday: -16.2%
Data Coverage
65.3%
First Year of Data
1913
Station Location
Historical Weather Records
| Max High | Avg High | Min High | Max Avg | Avg Avg | Min Avg | Max Low | Avg Low | Min Low | Max Precipitation | Avg Precipitation | Max Snow | Avg Snow | |
|---|---|---|---|---|---|---|---|---|---|---|---|---|---|
| Record | 106.16 °F | — | 48.92 °F | 92.12 °F | — | 39.25 °F | 77.00 °F | — | 23.18 °F | 3.73 in | — | — | — |
| January | 103.10 °F | 88.23 °F | 66.92 °F | 92.12 °F | 74.98 °F | 56.37 °F | 77.00 °F | 63.44 °F | 41.25 °F | 3.39 in | 0.10 in | — | — |
| February | 100.76 °F | 85.72 °F | 61.70 °F | 86.18 °F | 73.24 °F | 58.82 °F | 76.10 °F | 62.53 °F | 46.58 °F | 3.31 in | 0.12 in | — | — |
| March | 99.50 °F | 83.74 °F | 65.30 °F | 89.96 °F | 71.43 °F | 57.09 °F | 75.02 °F | 60.53 °F | 44.60 °F | 3.31 in | 0.10 in | — | — |
| April | 95.00 °F | 80.29 °F | 61.16 °F | 82.22 °F | 67.86 °F | 52.79 °F | 69.26 °F | 55.72 °F | 38.46 °F | 2.99 in | 0.05 in | — | — |
| May | 91.40 °F | 76.05 °F | 54.43 °F | 81.14 °F | 63.30 °F | 40.75 °F | 73.22 °F | 50.04 °F | 32.72 °F | 2.32 in | 0.01 in | — | — |
| June | 85.82 °F | 71.26 °F | 48.92 °F | 74.12 °F | 57.74 °F | 39.38 °F | 59.00 °F | 44.67 °F | 24.44 °F | 0.87 in | 0.00 in | — | — |
| July | 91.22 °F | 71.47 °F | 49.05 °F | 73.04 °F | 57.61 °F | 39.25 °F | 61.16 °F | 44.43 °F | 23.18 °F | 0.43 in | 0.00 in | — | — |
| August | 91.40 °F | 76.53 °F | 55.65 °F | 77.54 °F | 62.45 °F | 42.87 °F | 62.96 °F | 48.44 °F | 24.98 °F | 0.35 in | 0.00 in | — | — |
| September | 106.16 °F | 83.33 °F | 59.38 °F | 85.64 °F | 69.57 °F | 47.03 °F | 71.60 °F | 55.02 °F | 30.02 °F | 1.69 in | 0.00 in | — | — |
| October | 100.58 °F | 87.02 °F | 61.88 °F | 87.98 °F | 73.52 °F | 52.88 °F | 75.02 °F | 59.29 °F | 33.62 °F | 3.73 in | 0.02 in | — | — |
| November | 101.66 °F | 88.23 °F | 63.50 °F | 88.34 °F | 75.00 °F | 55.58 °F | 76.64 °F | 61.27 °F | 39.74 °F | 2.44 in | 0.04 in | — | — |
| December | 105.26 °F | 89.73 °F | 67.10 °F | 91.58 °F | 76.07 °F | 59.61 °F | 75.92 °F | 63.01 °F | 41.72 °F | 1.73 in | 0.06 in | — | — |
Data Visualisations
Remove WatermarksCurrent Year Climate Trends vs Historical

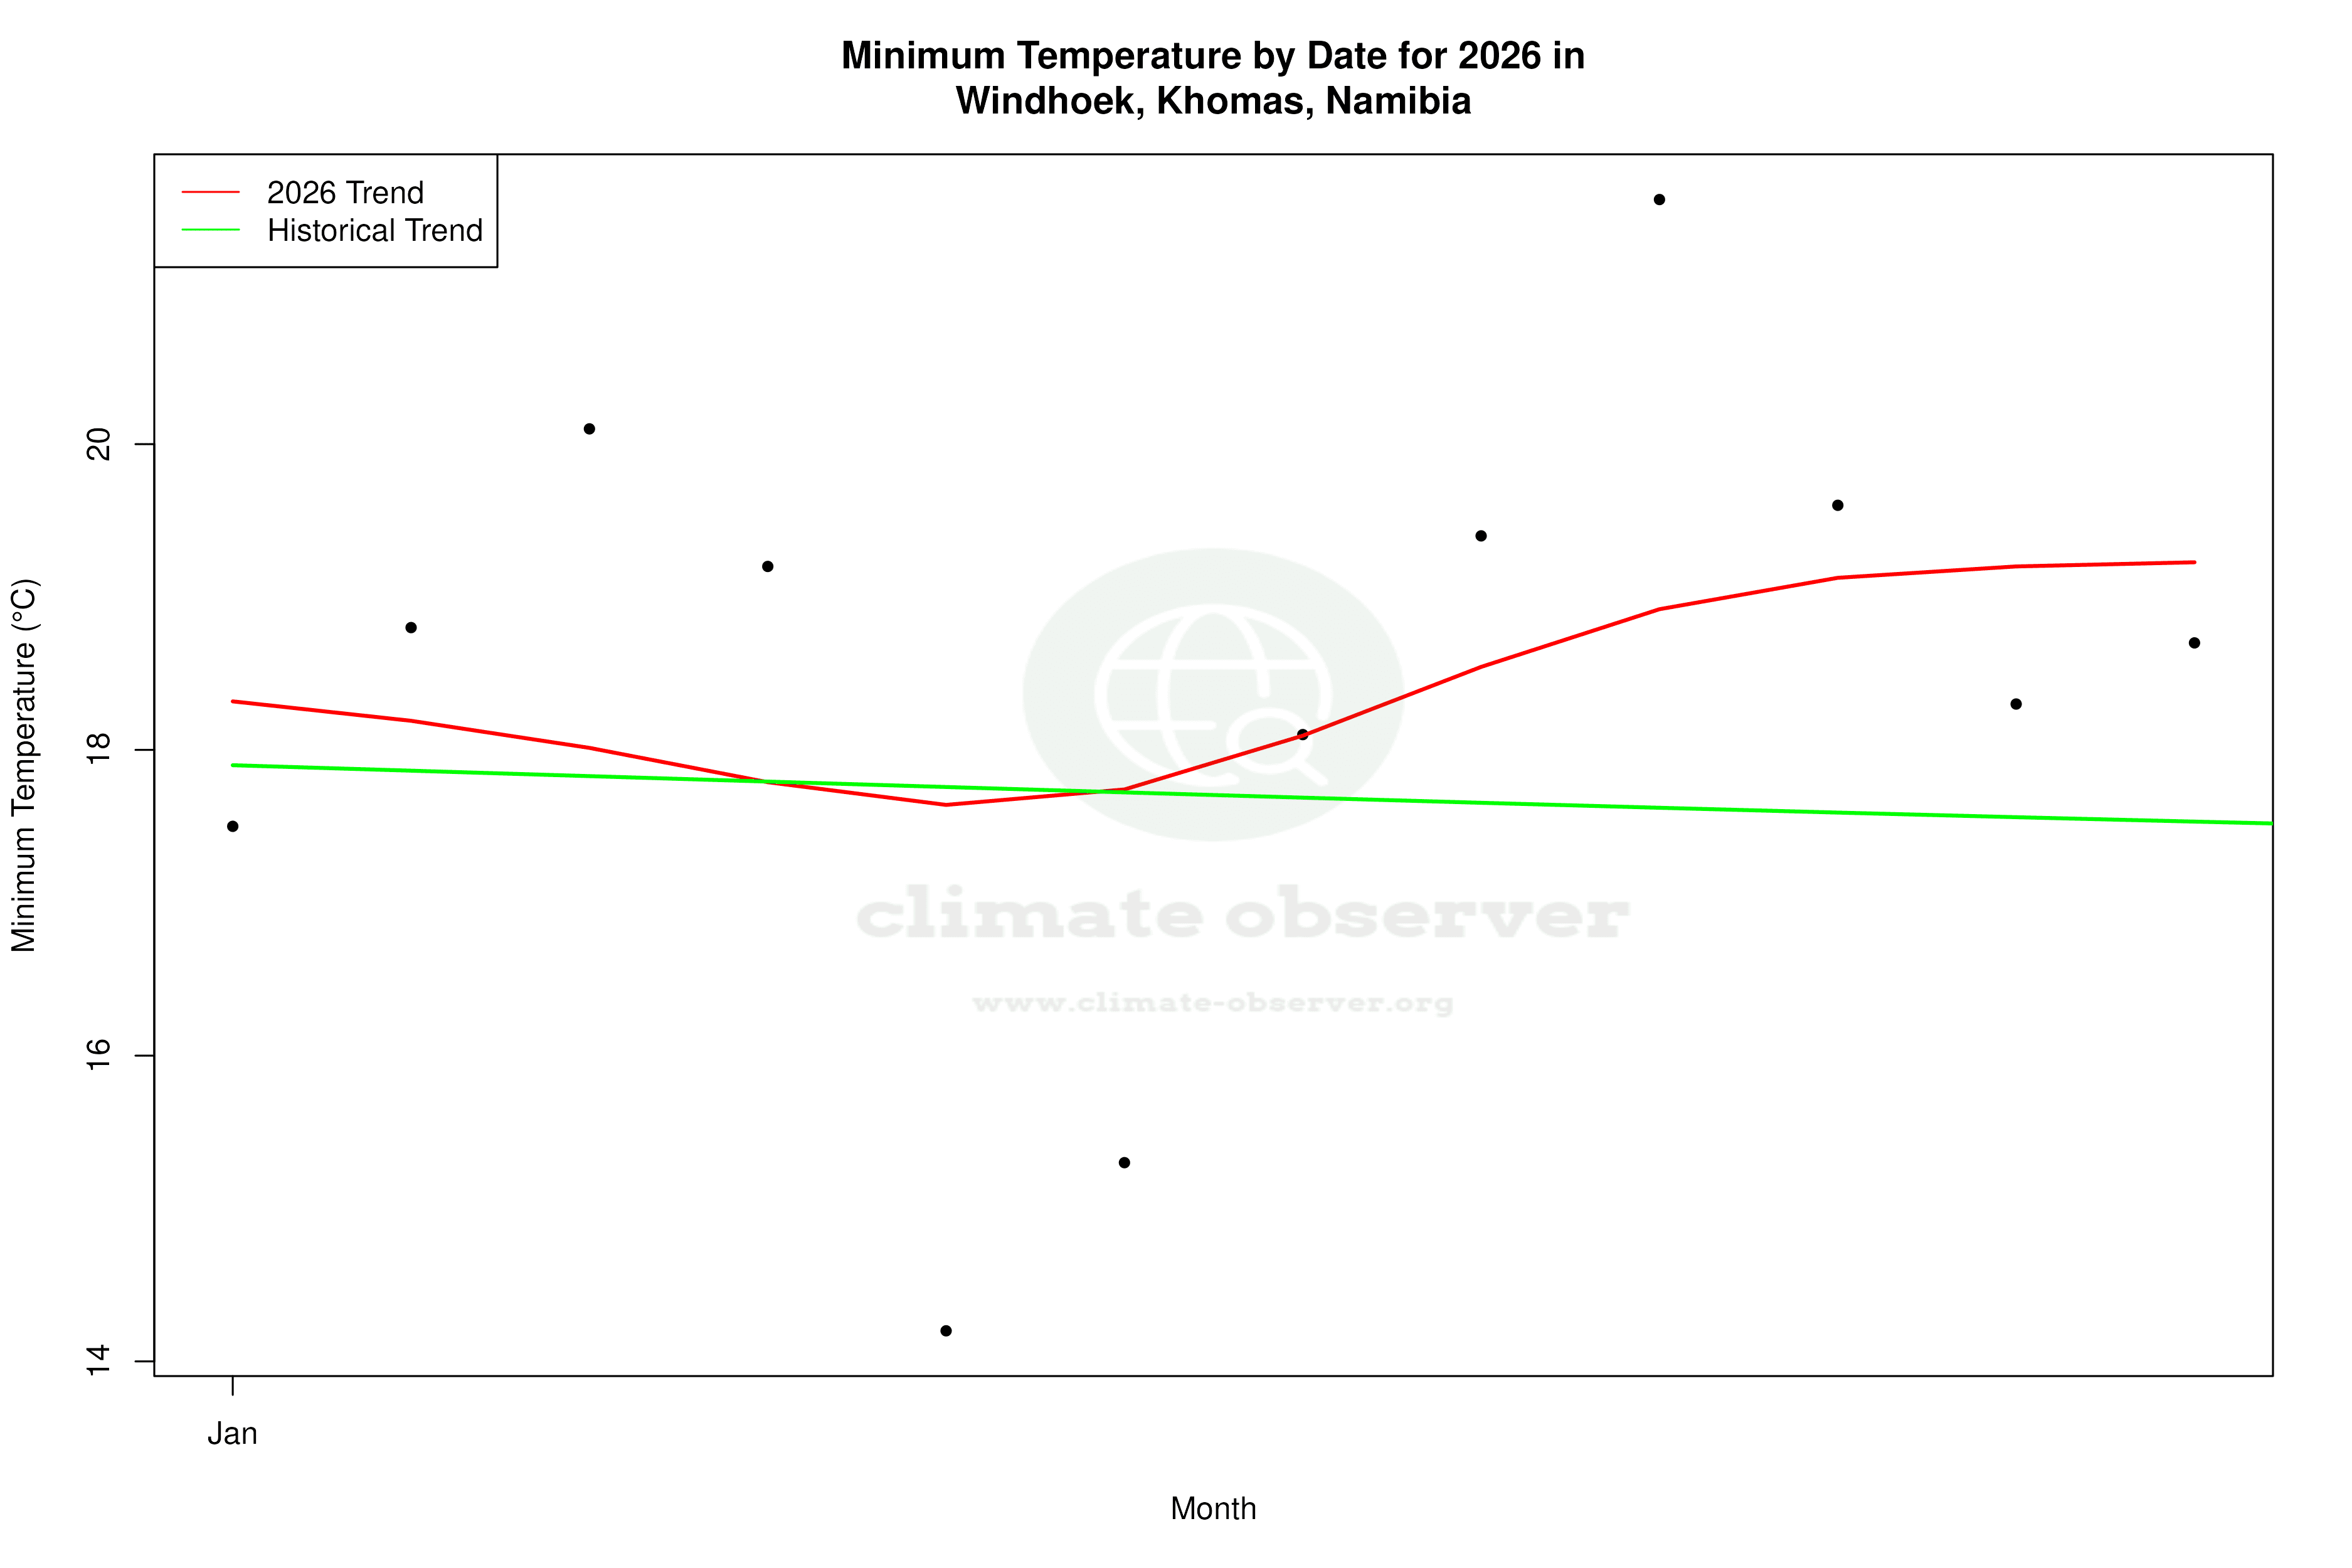


Max Temperature this Year | 1 of 6
Climate 12-Month Moving Averages


Max Temperature 12-Month MA | 1 of 6
Daily Data Points and Averages Throughout the Year


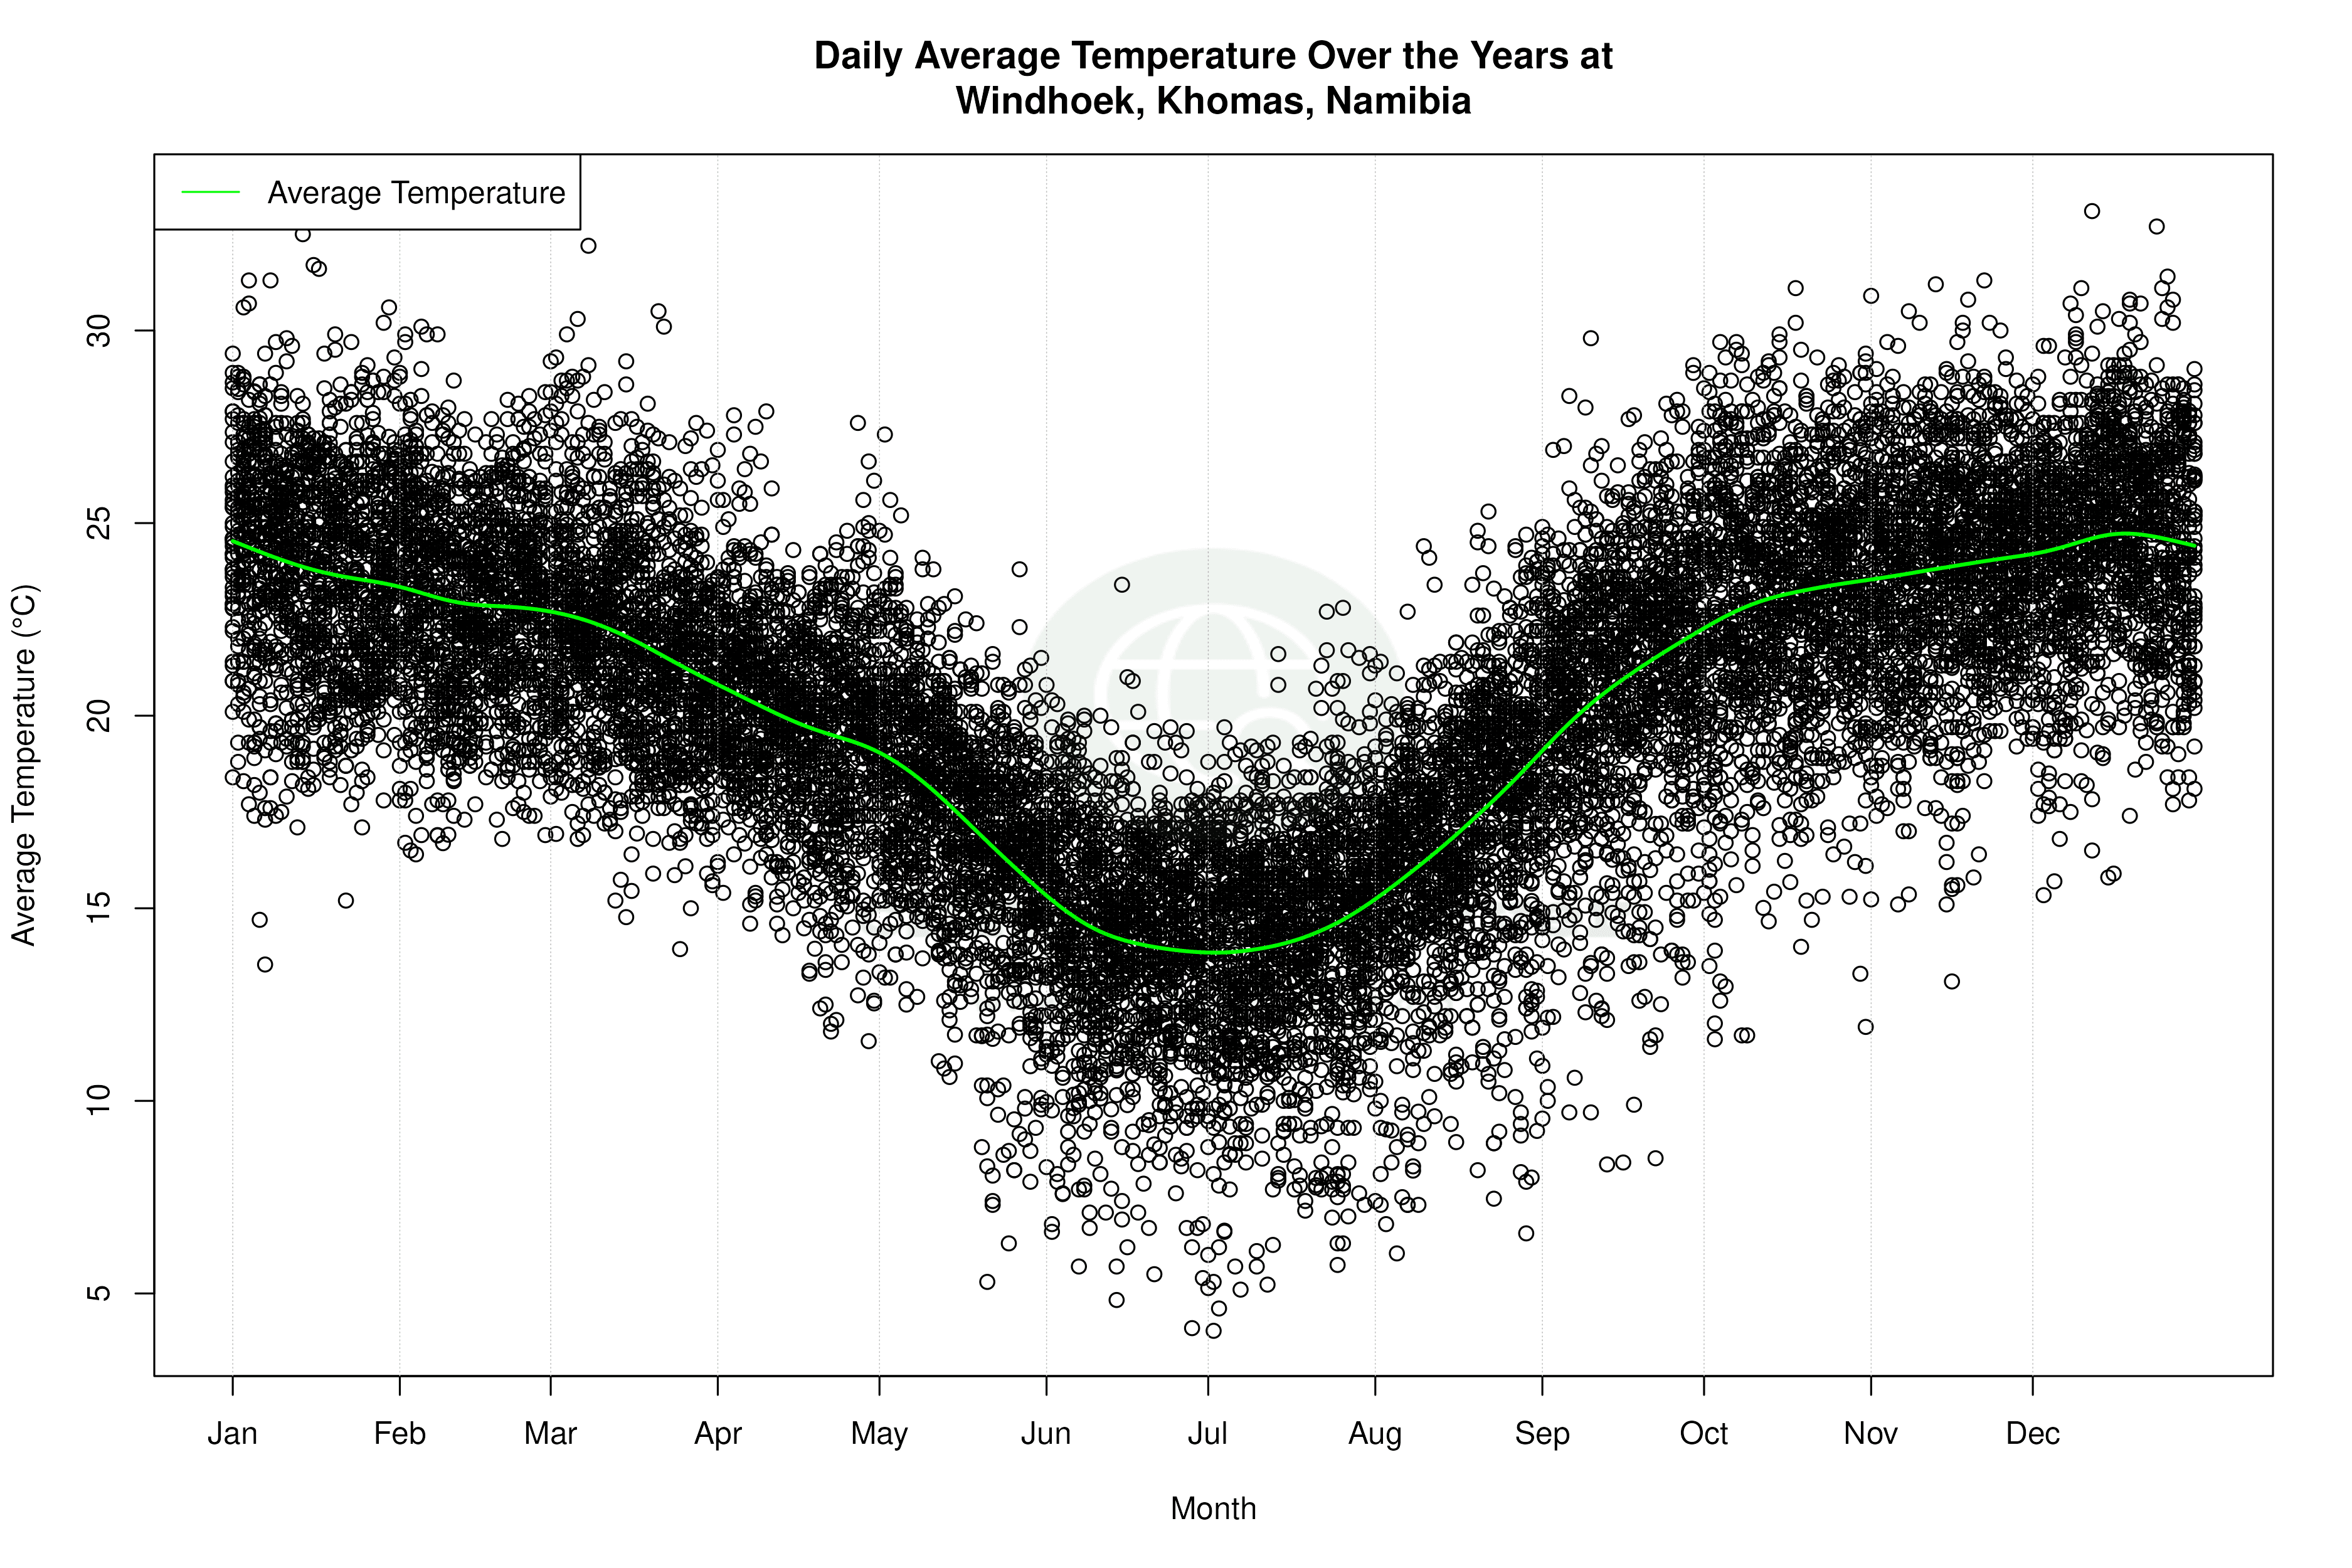

Average Max Temperature Throughout Year | 1 of 5
