Climate for Station: Wake Island, Wake Island [United States]
Loading live weather...
Climate Analysis & Overview
Wake Island's climate has experienced contrasting thermal trends over the past decade, with significant warming in high temperatures and a cooling trend in lows. Meanwhile, an all-time cooling trend for highs and a warming trend for lows suggest a complex climate narrative. Precipitation has become more evenly distributed, reflecting changes in atmospheric patterns.
Tropical Climate Dynamics
Wake Island, classified under the Köppen climate system as having a tropical savanna climate, is situated in the central Pacific Ocean. Its geographical position, surrounded by vast oceanic expanses, significantly influences its climatic conditions. The island's climate is predominantly moderated by the ocean, which stabilises temperatures but also subjects it to tropical cyclones. Over the past decade, Wake Island has experienced a notable warming in high temperatures, with a 3.29°C (5.92°F) increase, while low temperatures have shown a cooling trend of 1.36°C (2.44°F). This duality indicates a possible alteration in daily temperature ranges, perhaps influenced by changing oceanic currents or atmospheric conditions.
Long-term Temperature Trends
Examining the all-time temperature trends, Wake Island reveals a cooling trend in high temperatures, with a decrease of 0.13°C (0.23°F), while low temperatures have increased by 0.35°C (0.63°F). This suggests a narrowing of the temperature range over the long term, which could be indicative of broader climatic shifts in the region. These trends are essential for understanding the island's climate resilience and potential impacts on local ecosystems.
Precipitation Patterns and Distribution
The Precipitation Concentration Index (PCI) for Wake Island has shown a significant shift, decreasing from a baseline of 18.08 to a current value of 10.75. This indicates that precipitation events have become more evenly distributed throughout the year, reducing the concentration of rainfall in fewer, intense events. Such a change could be beneficial in mitigating flood risks and promoting more stable water resources, crucial for an island environment.
Temperature Extremes
Wake Island's recorded temperature extremes highlight its tropical climate characteristics. The maximum temperature has reached 36.1°C (97.0°F), while the minimum has dropped to 16.7°C (62.1°F). These records underscore the island's capacity to experience significant temperature fluctuations, despite its tropical savanna classification. Understanding these extremes is vital for preparing for potential heatwaves or cold spells, which can have profound impacts on both human and natural systems.
Implications for Climate Strategy
In the context of regional climate goals, Wake Island's mixed temperature trends and more evenly distributed precipitation patterns provide both challenges and opportunities. The warming of high temperatures over the past decade could impact energy demands and infrastructure resilience, while the cooling trend in lows may affect agricultural practices. The shift in precipitation distribution offers a chance to enhance water management strategies, aligning with broader climate adaptation efforts.
Station Statistics
10-Year Trend
High: +5.52 °F/decade
Low: -2.08 °F/decade
Rain: +0.044 in/decade
25-Year Trend
High: +0.70 °F/decade
Low: +0.21 °F/decade
Rain: +0.011 in/decade
50-Year Trend
High: -0.73 °F/decade
Low: +0.83 °F/decade
Rain: +0.001 in/decade
All-Time Trend
High: -0.22 °F/decade
Low: +0.63 °F/decade
Rain: -0.004 in/decade
Percentage Above-Average Days
Last 12 Months: 51.8%
This Year: 35.3%
Precipitation Concentration Index (PCI) ℹ️
Last 12 Months: 12.1
Historical Average: 16.9
Percentile Rank of Last 12 Months ℹ️
High: 85th percentile
Low: 82nd percentile
Rain: 77th percentile
Change in Variance ℹ️
High: +3.4%
Low: -19.3%
Intraday: +9.3%
Data Coverage
88.4%
First Year of Data
1945
Station Location
Historical Weather Records
| Max High | Avg High | Min High | Max Avg | Avg Avg | Min Avg | Max Low | Avg Low | Min Low | Max Precipitation | Avg Precipitation | Max Snow | Avg Snow | |
|---|---|---|---|---|---|---|---|---|---|---|---|---|---|
| Record | 96.98 °F | — | 71.96 °F | 89.42 °F | — | 68.00 °F | 86.00 °F | — | 62.06 °F | 6.24 in | — | 0.00 in | — |
| January | 89.06 °F | 81.89 °F | 73.94 °F | 83.84 °F | 77.83 °F | 70.88 °F | 84.02 °F | 74.09 °F | 62.96 °F | 2.28 in | 0.03 in | 0.00 in | 0.00 in |
| February | 93.38 °F | 81.59 °F | 71.96 °F | 82.76 °F | 77.14 °F | 70.34 °F | 80.24 °F | 73.35 °F | 62.96 °F | 2.20 in | 0.04 in | 0.00 in | 0.00 in |
| March | 92.12 °F | 82.24 °F | 73.74 °F | 84.74 °F | 77.70 °F | 68.00 °F | 82.04 °F | 73.95 °F | 62.06 °F | 2.31 in | 0.05 in | 0.00 in | 0.00 in |
| April | 93.56 °F | 83.22 °F | 75.02 °F | 84.02 °F | 78.79 °F | 70.34 °F | 81.50 °F | 74.80 °F | 62.06 °F | 3.39 in | 0.06 in | 0.00 in | 0.00 in |
| May | 92.84 °F | 84.66 °F | 77.00 °F | 87.62 °F | 80.21 °F | 70.70 °F | 82.94 °F | 76.30 °F | 64.04 °F | 2.58 in | 0.04 in | 0.00 in | 0.00 in |
| June | 93.92 °F | 86.53 °F | 78.51 °F | 87.98 °F | 82.04 °F | 76.10 °F | 86.00 °F | 78.02 °F | 69.98 °F | 2.71 in | 0.05 in | 0.00 in | 0.00 in |
| July | 95.00 °F | 87.06 °F | 80.06 °F | 88.16 °F | 82.53 °F | 76.82 °F | 83.97 °F | 78.44 °F | 66.02 °F | 4.20 in | 0.12 in | 0.00 in | 0.00 in |
| August | 96.98 °F | 87.30 °F | 78.08 °F | 89.42 °F | 82.85 °F | 76.28 °F | 84.92 °F | 78.67 °F | 64.94 °F | 5.25 in | 0.17 in | 0.00 in | 0.00 in |
| September | 95.54 °F | 87.17 °F | 78.98 °F | 89.24 °F | 82.90 °F | 75.92 °F | 85.03 °F | 78.88 °F | 64.04 °F | 6.24 in | 0.17 in | 0.00 in | 0.00 in |
| October | 92.30 °F | 86.53 °F | 78.08 °F | 89.06 °F | 82.37 °F | 76.28 °F | 84.83 °F | 78.26 °F | 66.02 °F | 3.19 in | 0.13 in | 0.00 in | 0.00 in |
| November | 89.96 °F | 84.79 °F | 75.92 °F | 87.26 °F | 80.98 °F | 72.68 °F | 82.98 °F | 77.25 °F | 64.94 °F | 4.34 in | 0.07 in | 0.00 in | 0.00 in |
| December | 91.04 °F | 82.95 °F | 75.02 °F | 83.66 °F | 79.24 °F | 71.96 °F | 82.94 °F | 75.64 °F | 64.04 °F | 2.63 in | 0.04 in | 0.00 in | 0.00 in |
Data Visualisations
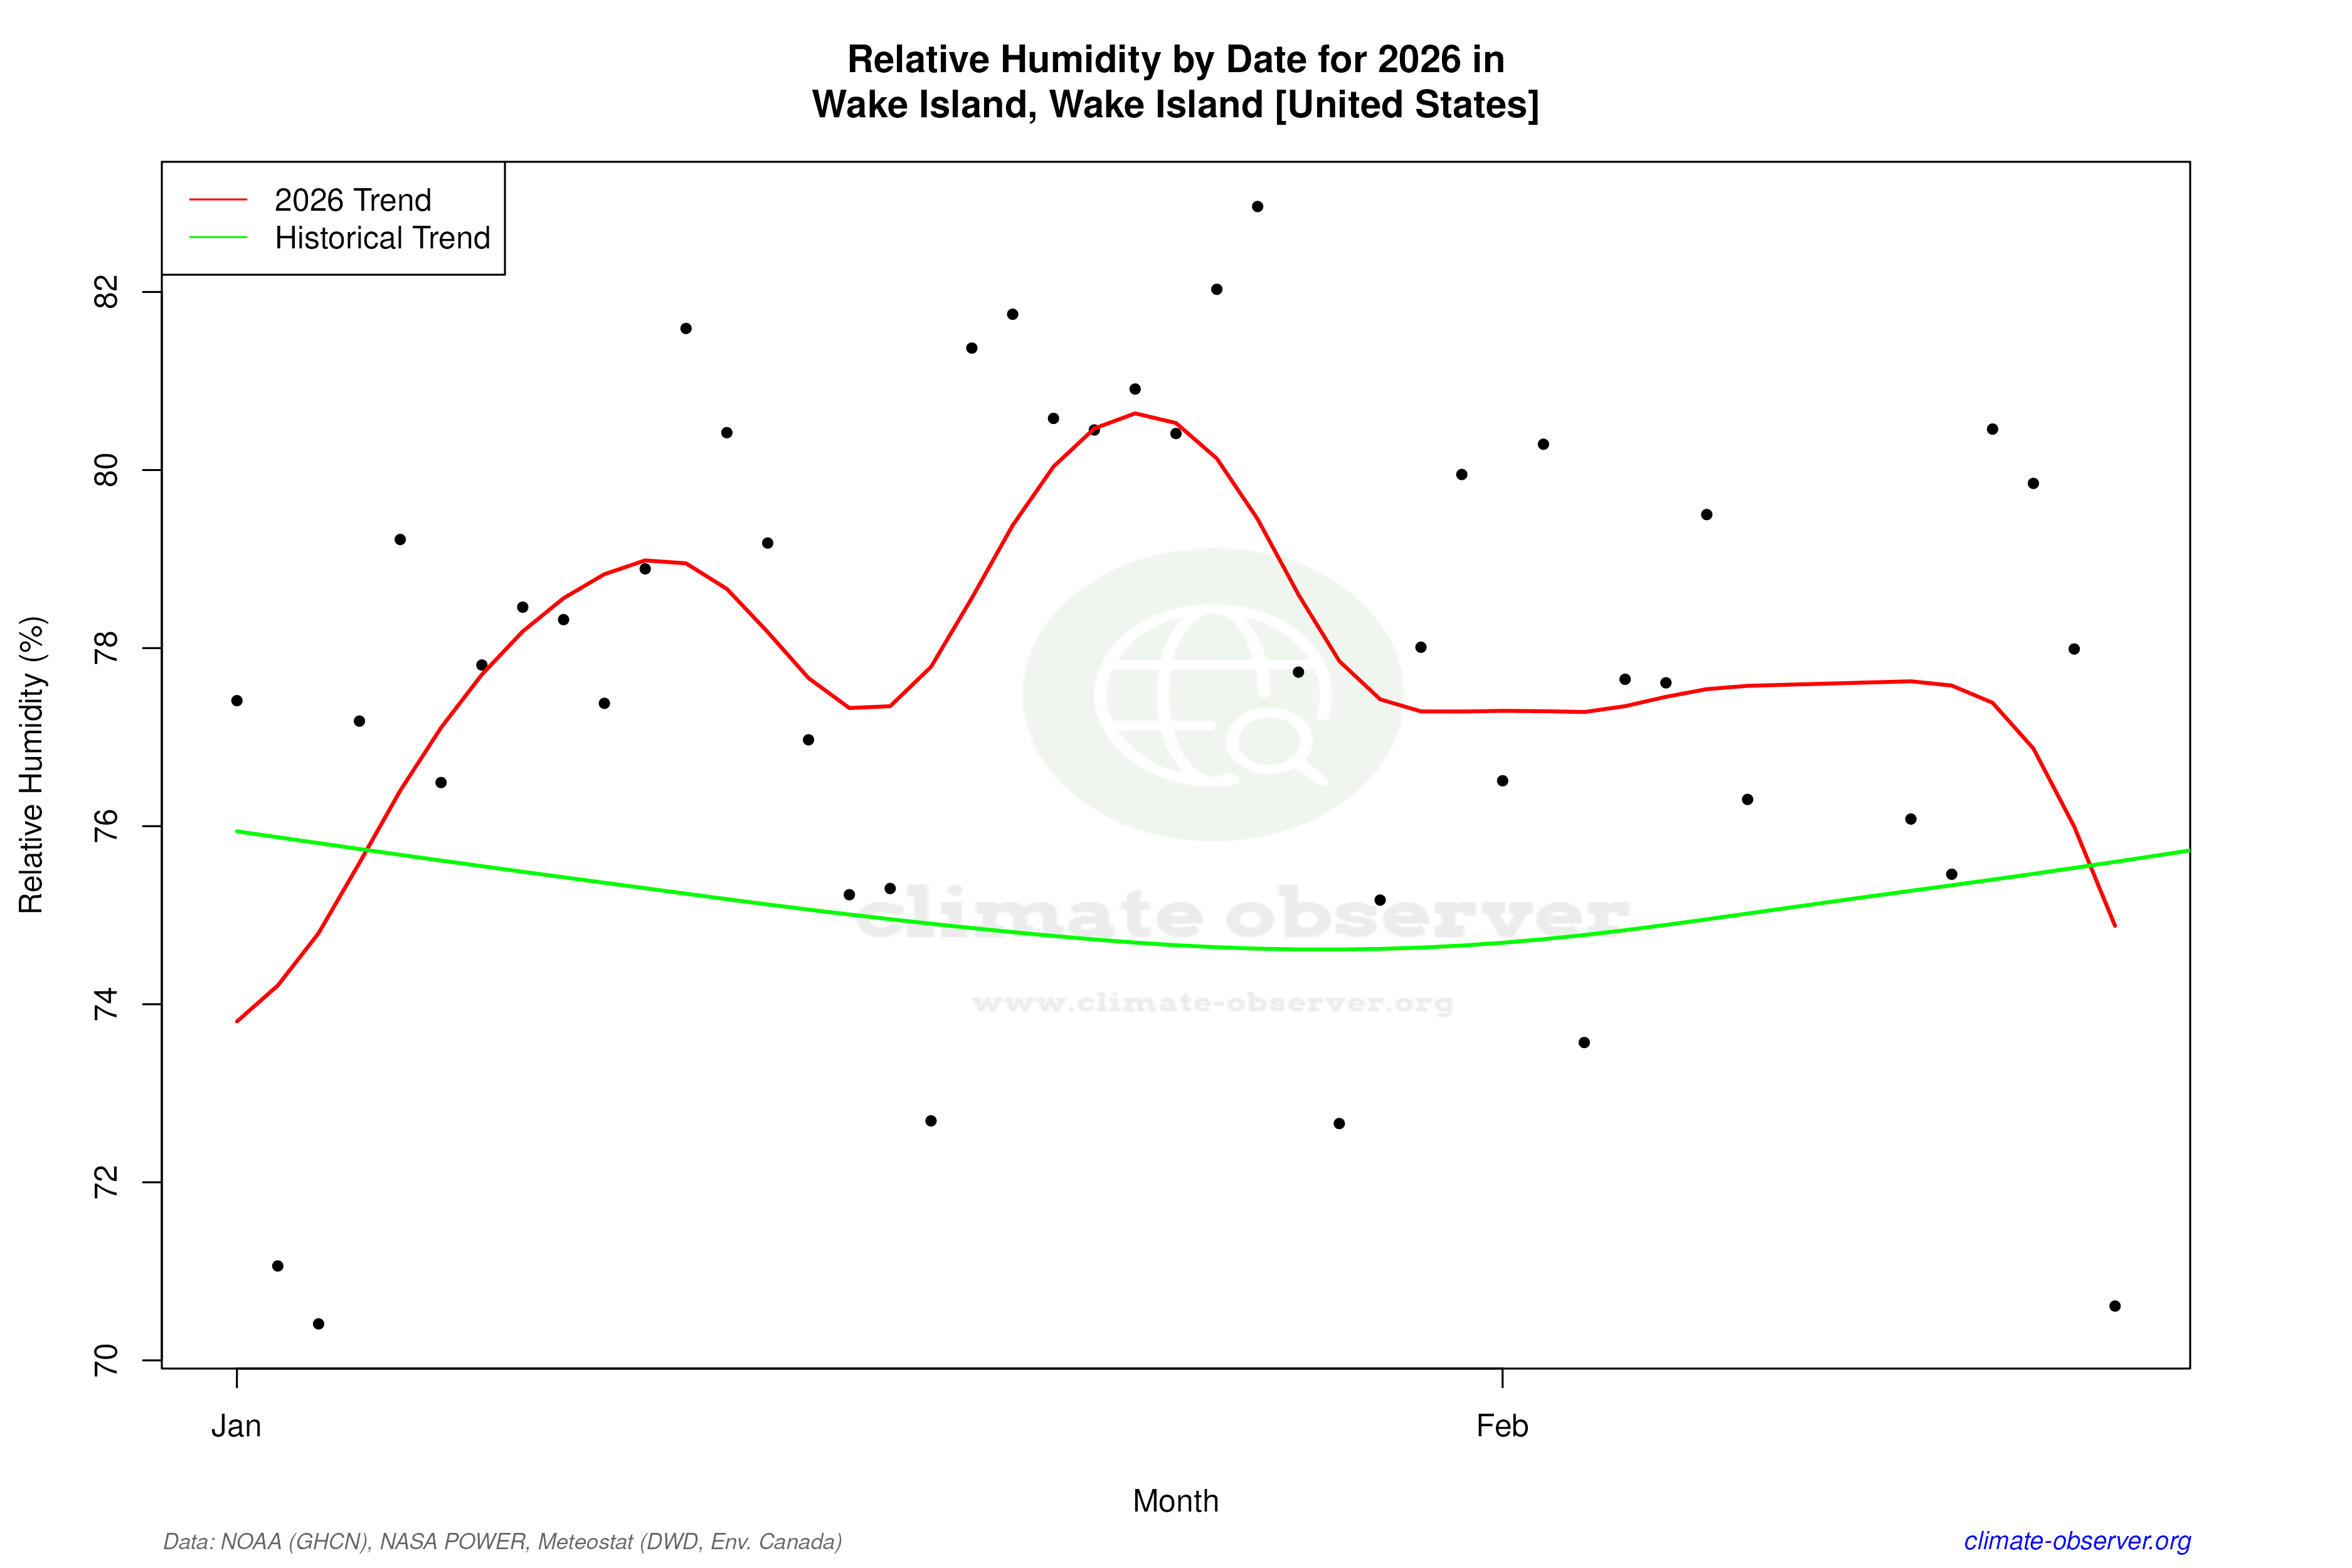
Remove WatermarksCurrent Year Climate Trends vs Historical


Max Temperature this Year | 1 of 6
Climate 12-Month Moving Averages


Max Temperature 12-Month MA | 1 of 6
Daily Data Points and Averages Throughout the Year


Average Max Temperature Throughout Year | 1 of 5