Climate for Station: Ndola, Copperbelt, Zambia
Loading live weather...
Climate Analysis & Overview
Ndola, situated in Zambia's Copperbelt Province, is experiencing a warming trend with significant increases in both high and low temperatures over the past decade. The precipitation pattern has become more evenly distributed, suggesting a shift in rainfall dynamics. These changes align with Zambia's regional climate goals to adapt to evolving weather patterns.
Warming Trends in Ndola
Ndola, located at -13.0, 28.65, falls within the Köppen climate classification of Cwa, which is characterised by a humid subtropical climate with dry winters. The region's geography, with its proximity to the Copperbelt's mineral-rich plateau, influences its climatic conditions. Over the past decade, Ndola has experienced a notable warming trend, with high temperatures increasing by 0.24°C (0.43°F). More prominently, low temperatures have risen by 2.07°C (3.73°F). This suggests that nighttime temperatures are climbing more rapidly than daytime highs, which could impact local ecosystems and agriculture.
Long-term Temperature Dynamics
When examining the all-time trends, the data reveals a consistent warming pattern, albeit at a slower pace. High temperatures have increased by 0.21°C (0.38°F), while low temperatures have risen by 0.55°C (0.99°F). This long-term rise in temperatures indicates a gradual shift in Ndola's climate, possibly linked to broader regional and global climate changes. The record temperatures for the area stand at a maximum of 39.18°C (102.52°F) and a minimum of 3.96°C (39.13°F), highlighting the extremes that the region can experience.
Shifts in Precipitation Patterns
The Precipitation Concentration Index (PCI) provides insight into how rainfall is distributed throughout the year. Ndola's PCI has decreased from a baseline of 23.34 to a current value of 19.40. This shift indicates that rainfall is becoming more evenly distributed over the year, moving away from highly concentrated events. Such a change can reduce the risk of flooding and improve water availability for agriculture, aligning with Zambia's goals to enhance climate resilience.
Regional Climate Implications
The climatic shifts in Ndola are part of a larger pattern observed across Zambia, where efforts are underway to adapt to changing weather conditions. The increase in temperature, particularly the significant rise in low temperatures, could affect energy consumption, water resources, and agricultural practices. Meanwhile, the more evenly distributed rainfall may offer opportunities for improved agricultural planning and water management, crucial for a region heavily reliant on mining and agriculture.
Ndola's evolving climate profile underscores the importance of continued monitoring and adaptation strategies to mitigate the impacts of climate change. As Zambia works towards its climate goals, understanding these localised trends is vital for informed decision-making and sustainable development in the region.
Station Statistics
10-Year Trend
High: +0.44 °F/decade
Low: +3.29 °F/decade
Rain: +0.021 in/decade
25-Year Trend
High: -0.11 °F/decade
Low: +1.93 °F/decade
Rain: +0.011 in/decade
50-Year Trend
High: +0.36 °F/decade
Low: +0.98 °F/decade
Rain: -0.003 in/decade
All-Time Trend
High: +0.36 °F/decade
Low: +0.98 °F/decade
Rain: -0.003 in/decade
Percentage Above-Average Days
Last 12 Months: 32.6%
This Year: 56.4%
Precipitation Concentration Index (PCI) ℹ️
Last 12 Months: 19.6
Historical Average: 22.7
Percentile Rank of Last 12 Months ℹ️
High: 43rd percentile
Low: 89th percentile
Rain: 55th percentile
Change in Variance ℹ️
High: -35.7%
Low: +5.9%
Intraday: -3.0%
Data Coverage
69.3%
First Year of Data
1950
Station Location
Historical Weather Records
| Max High | Avg High | Min High | Max Avg | Avg Avg | Min Avg | Max Low | Avg Low | Min Low | Max Precipitation | Avg Precipitation | Max Snow | Avg Snow | |
|---|---|---|---|---|---|---|---|---|---|---|---|---|---|
| Record | 102.52 °F | — | 62.51 °F | 86.50 °F | — | 50.43 °F | 76.82 °F | — | 39.13 °F | 6.93 in | — | — | — |
| January | 91.15 °F | 77.97 °F | 68.04 °F | 78.80 °F | 70.28 °F | 64.09 °F | 71.60 °F | 63.61 °F | 55.13 °F | 6.23 in | 0.38 in | — | — |
| February | 92.73 °F | 78.14 °F | 69.08 °F | 80.78 °F | 70.34 °F | 64.60 °F | 74.12 °F | 63.56 °F | 53.51 °F | 4.91 in | 0.31 in | — | — |
| March | 96.08 °F | 79.05 °F | 70.27 °F | 79.23 °F | 70.31 °F | 63.61 °F | 71.60 °F | 62.81 °F | 51.76 °F | 3.32 in | 0.15 in | — | — |
| April | 97.09 °F | 79.45 °F | 69.76 °F | 80.15 °F | 68.39 °F | 59.07 °F | 70.68 °F | 59.05 °F | 47.62 °F | 2.92 in | 0.03 in | — | — |
| May | 95.02 °F | 78.55 °F | 62.51 °F | 76.03 °F | 65.23 °F | 55.27 °F | 66.92 °F | 53.88 °F | 43.12 °F | 0.44 in | 0.00 in | — | — |
| June | 88.11 °F | 76.89 °F | 63.84 °F | 71.96 °F | 62.10 °F | 50.43 °F | 59.79 °F | 49.49 °F | 39.58 °F | 0.45 in | 0.00 in | — | — |
| July | 88.21 °F | 77.57 °F | 65.57 °F | 72.32 °F | 62.12 °F | 52.25 °F | 60.33 °F | 48.82 °F | 39.13 °F | 0.15 in | 0.00 in | — | — |
| August | 93.56 °F | 83.23 °F | 70.14 °F | 78.44 °F | 67.30 °F | 55.65 °F | 66.74 °F | 53.06 °F | 41.22 °F | 0.60 in | 0.00 in | — | — |
| September | 99.79 °F | 89.57 °F | 73.20 °F | 82.94 °F | 74.05 °F | 59.38 °F | 72.68 °F | 59.52 °F | 45.90 °F | 0.70 in | 0.00 in | — | — |
| October | 101.25 °F | 92.27 °F | 73.89 °F | 86.04 °F | 78.32 °F | 66.61 °F | 74.12 °F | 64.81 °F | 53.49 °F | 2.85 in | 0.06 in | — | — |
| November | 102.52 °F | 87.87 °F | 73.08 °F | 86.50 °F | 76.38 °F | 66.20 °F | 76.82 °F | 65.74 °F | 54.09 °F | 4.17 in | 0.22 in | — | — |
| December | 97.41 °F | 80.64 °F | 69.15 °F | 82.22 °F | 71.97 °F | 65.77 °F | 75.20 °F | 64.31 °F | 55.33 °F | 6.93 in | 0.35 in | — | — |
Data Visualisations
Remove WatermarksCurrent Year Climate Trends vs Historical


Max Temperature this Year | 1 of 6
Climate 12-Month Moving Averages


Max Temperature 12-Month MA | 1 of 6
Daily Data Points and Averages Throughout the Year


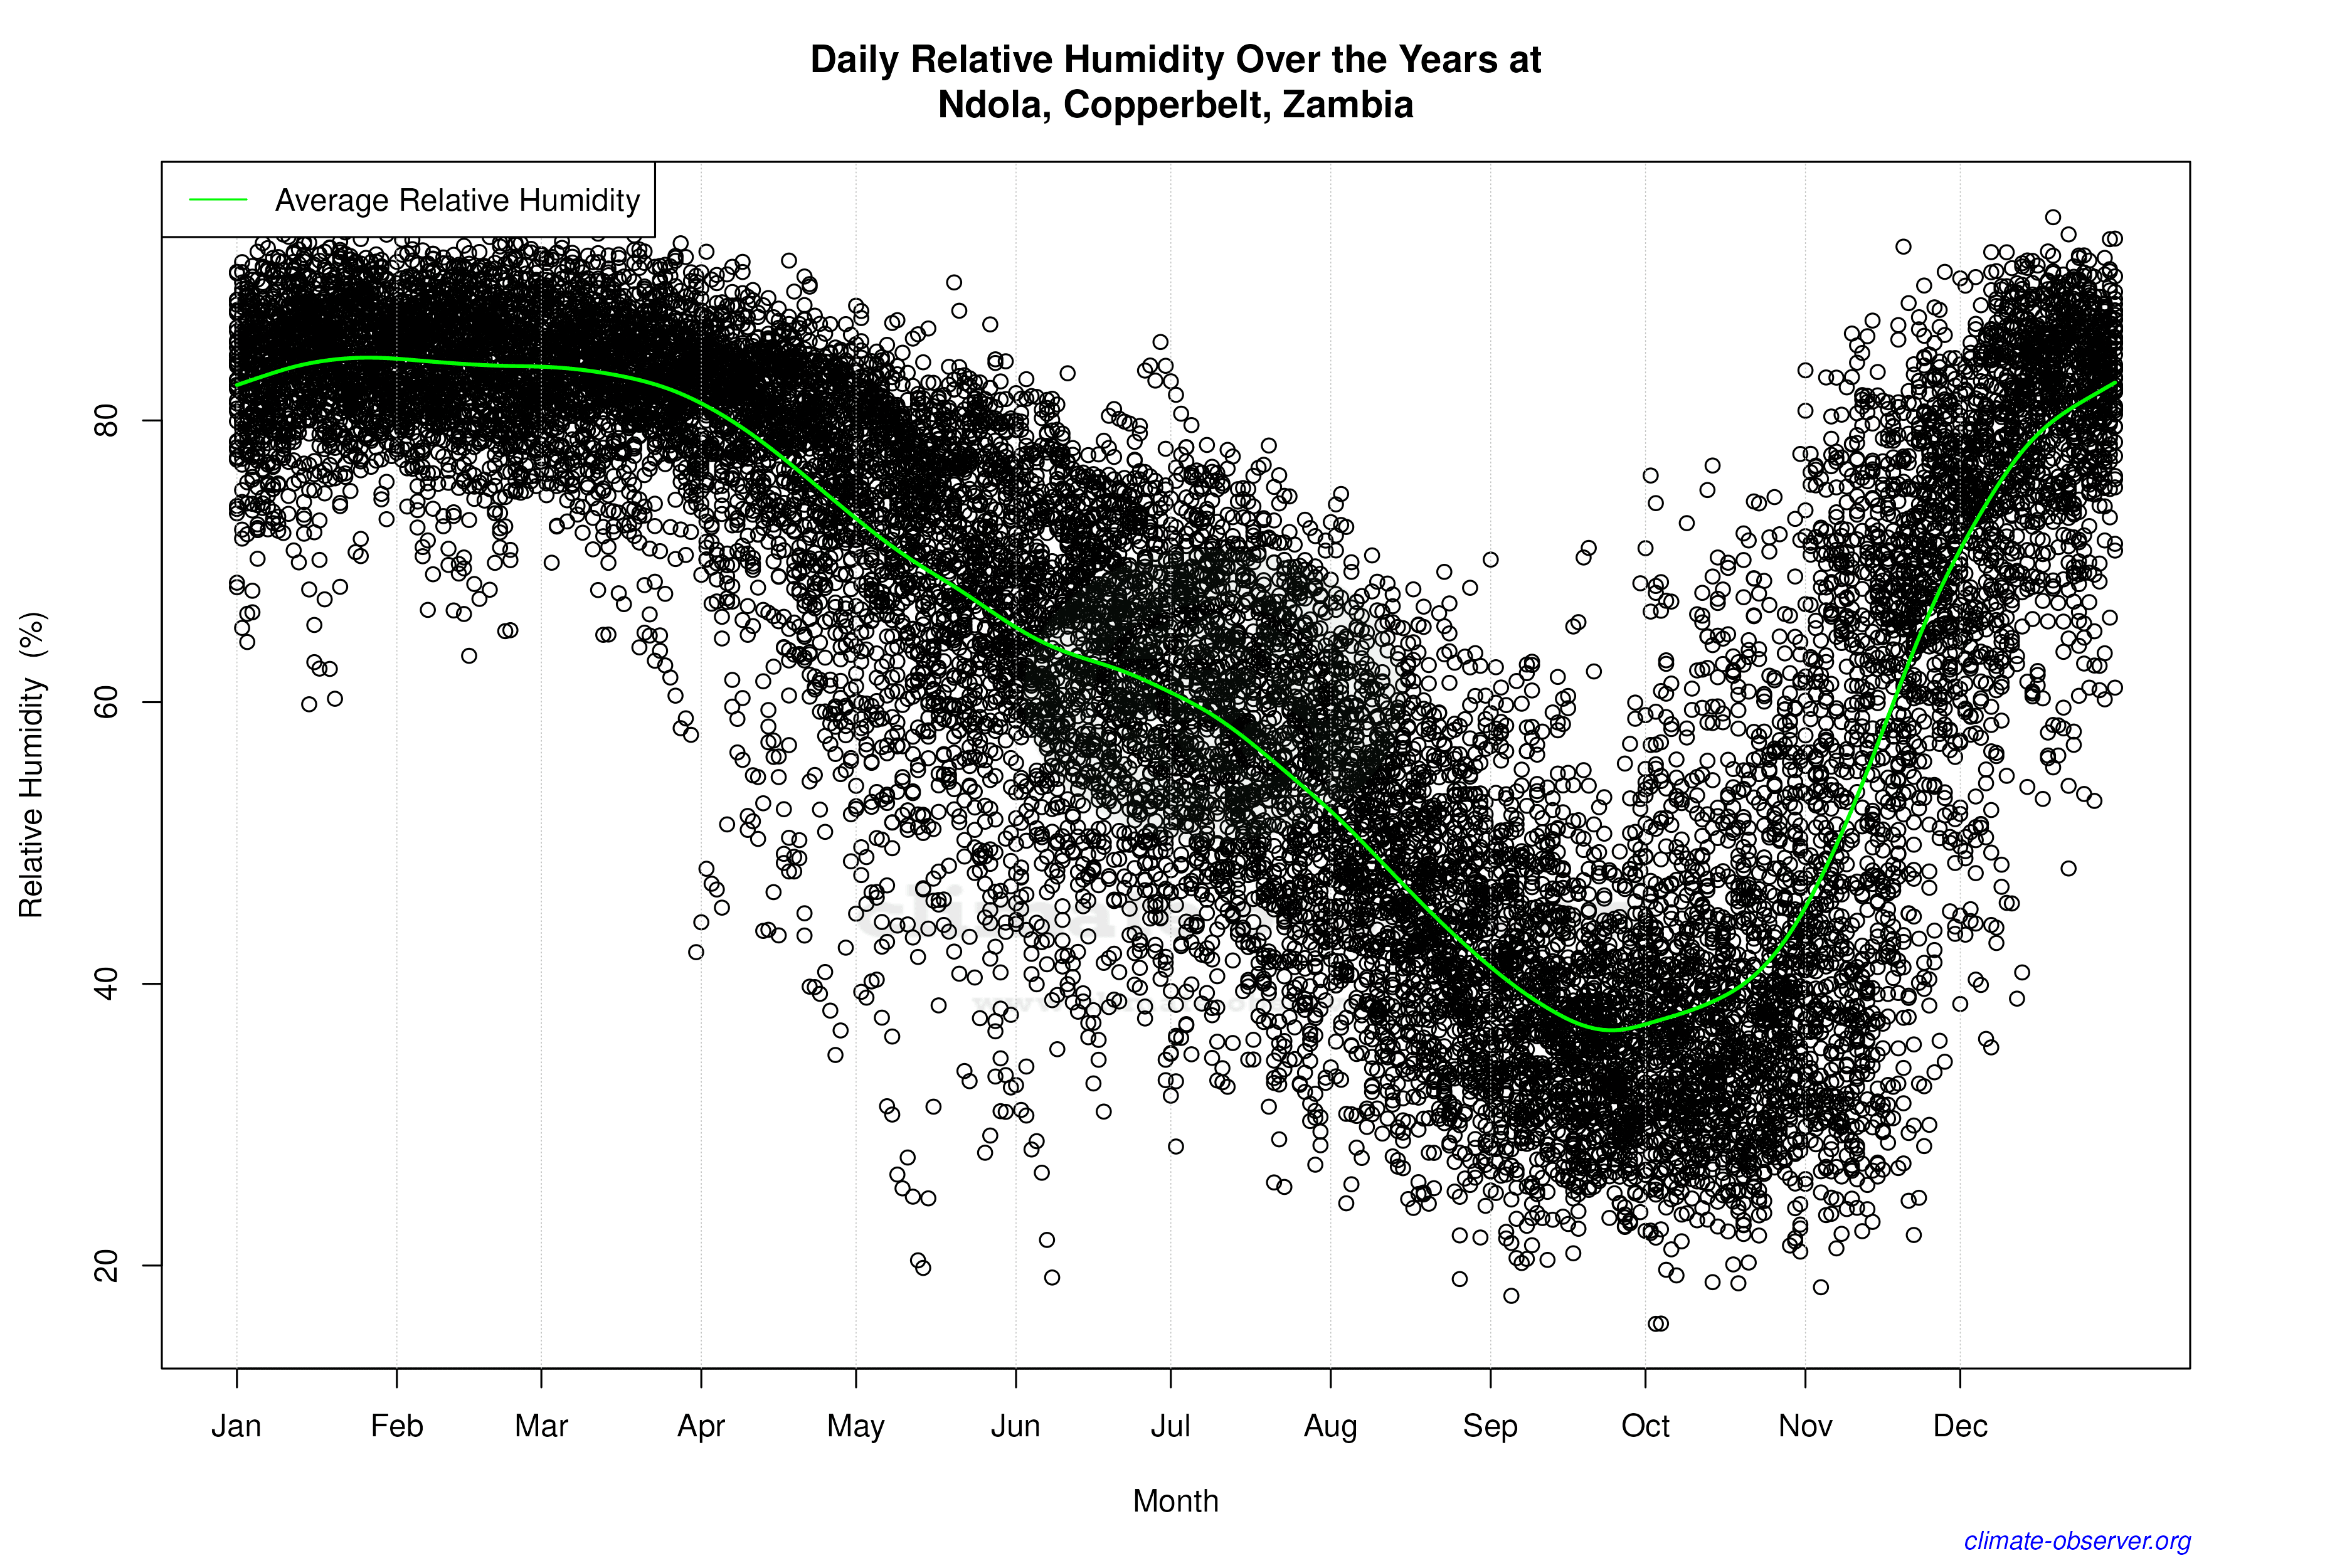

Average Max Temperature Throughout Year | 1 of 5
