Climate for Station: Chipata, Eastern, Zambia
Loading live weather...
Climate Analysis & Overview
Chipata's climate is marked by a complex interplay of warming and cooling trends. Over the last decade, the region has experienced a notable cooling of high temperatures, contrasting with a long-term warming trend. Meanwhile, the distribution of precipitation has become more even, indicating a shift towards more consistent rainfall patterns.
Warming and Cooling Dynamics in Chipata
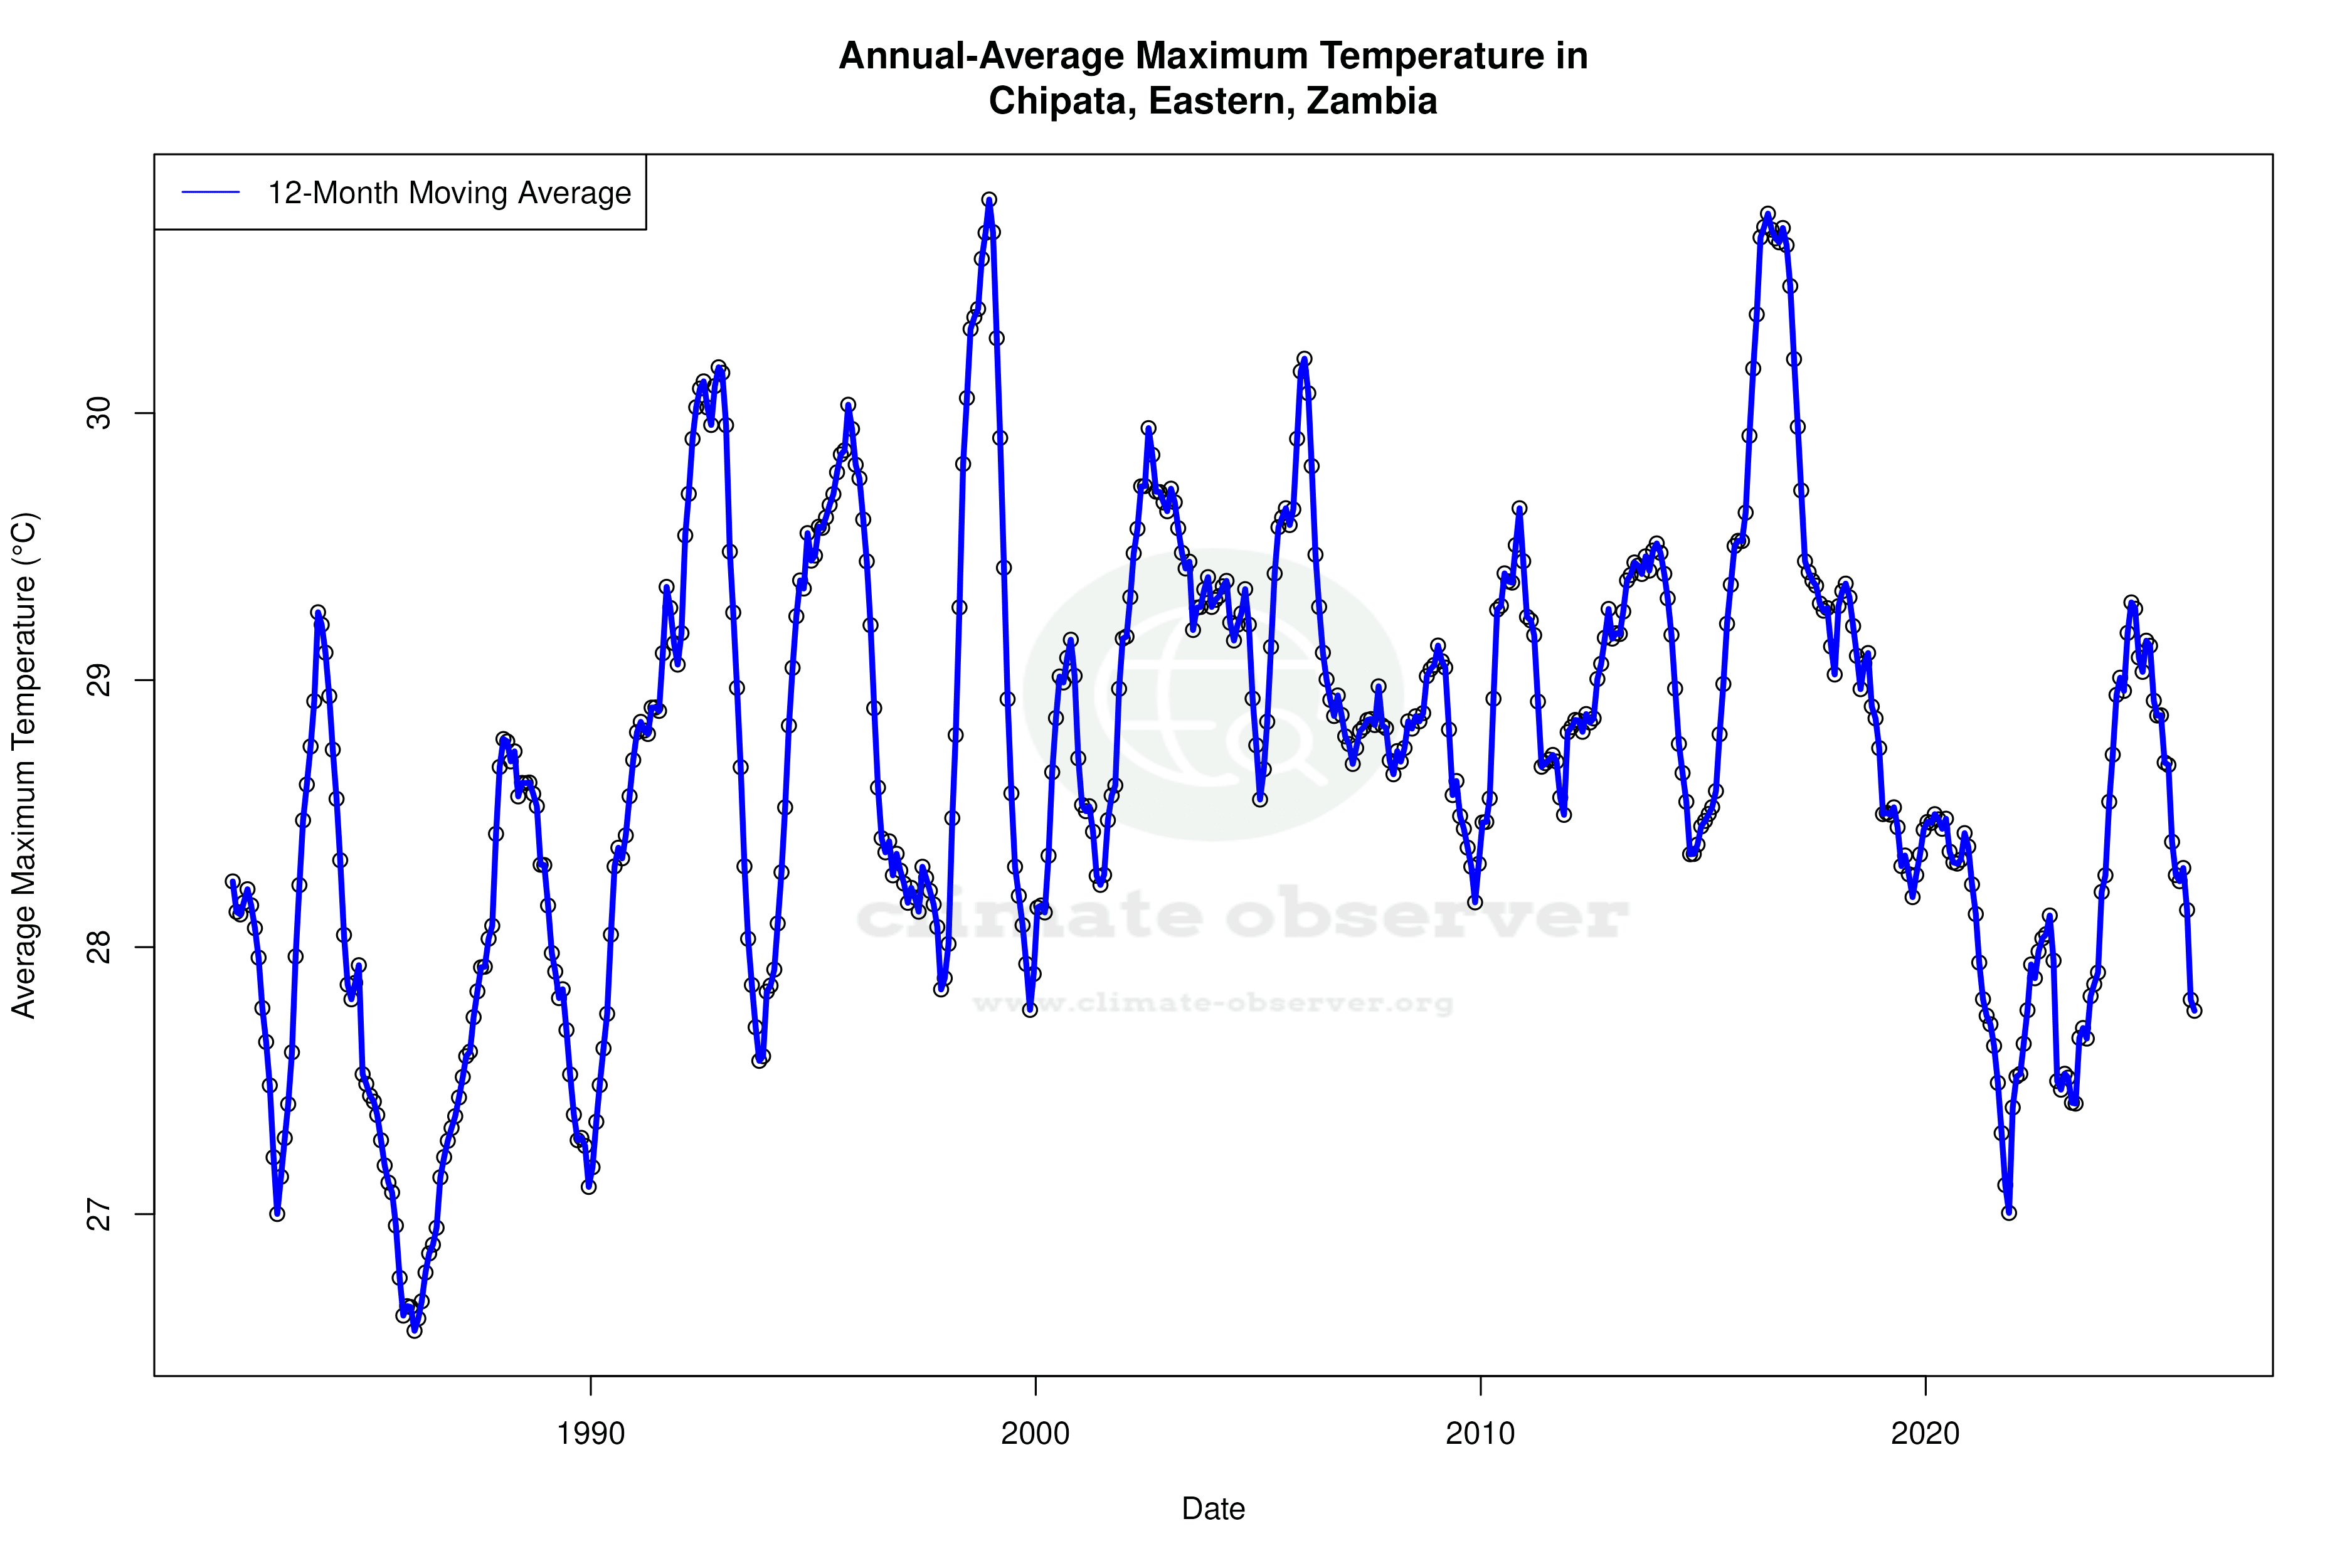
Chipata, located in the Eastern Province of Zambia, is characterised by a subtropical highland climate, classified as Cwa under the Köppen system. This classification indicates a climate with a dry winter and a hot summer. Over the past decade, Chipata has experienced a cooling trend in high temperatures, with a decrease of 1.84°C (3.31°F). This is a significant deviation from the all-time trend, which shows a slight warming of 0.14°C (0.25°F) in high temperatures. Conversely, the low temperatures have increased by 1.08°C (1.94°F) over the past ten years, aligning with the all-time warming trend of 0.26°C (0.47°F). These contrasting trends highlight the region's complex thermal dynamics, influenced by its elevation and proximity to the Luangwa River, which can moderate temperature extremes.
Precipitation Patterns: A Shift Towards Even Distribution
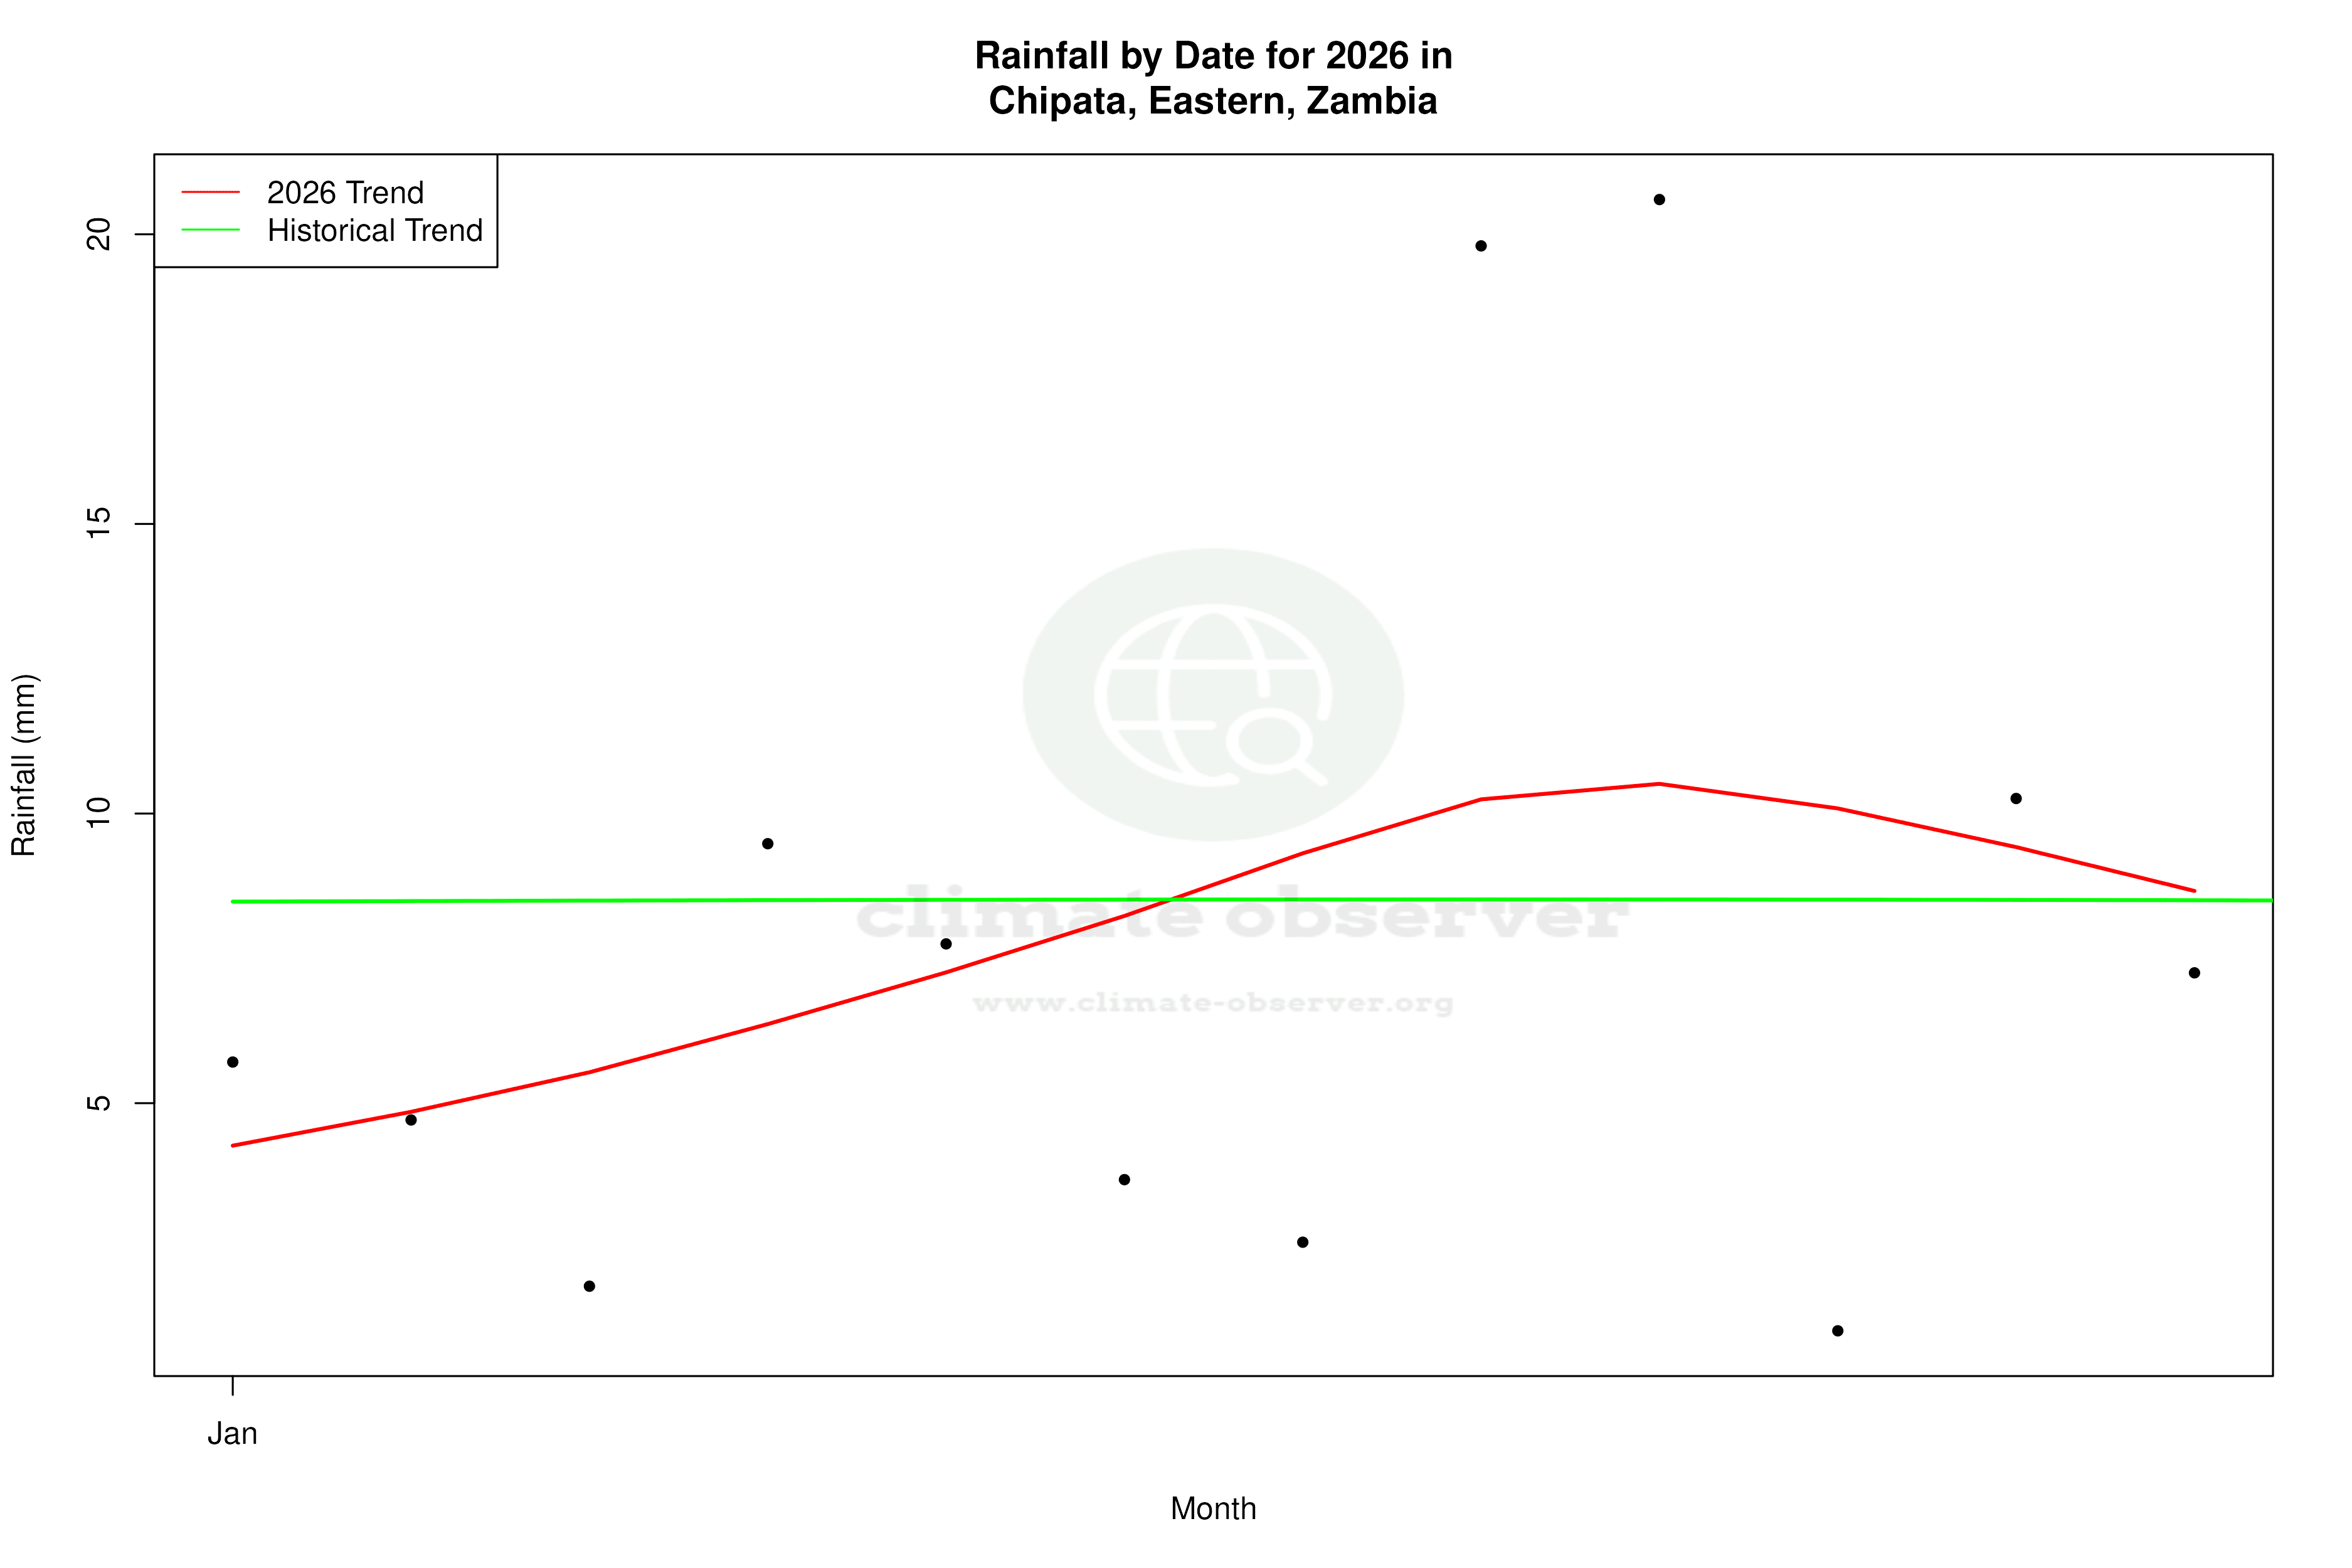
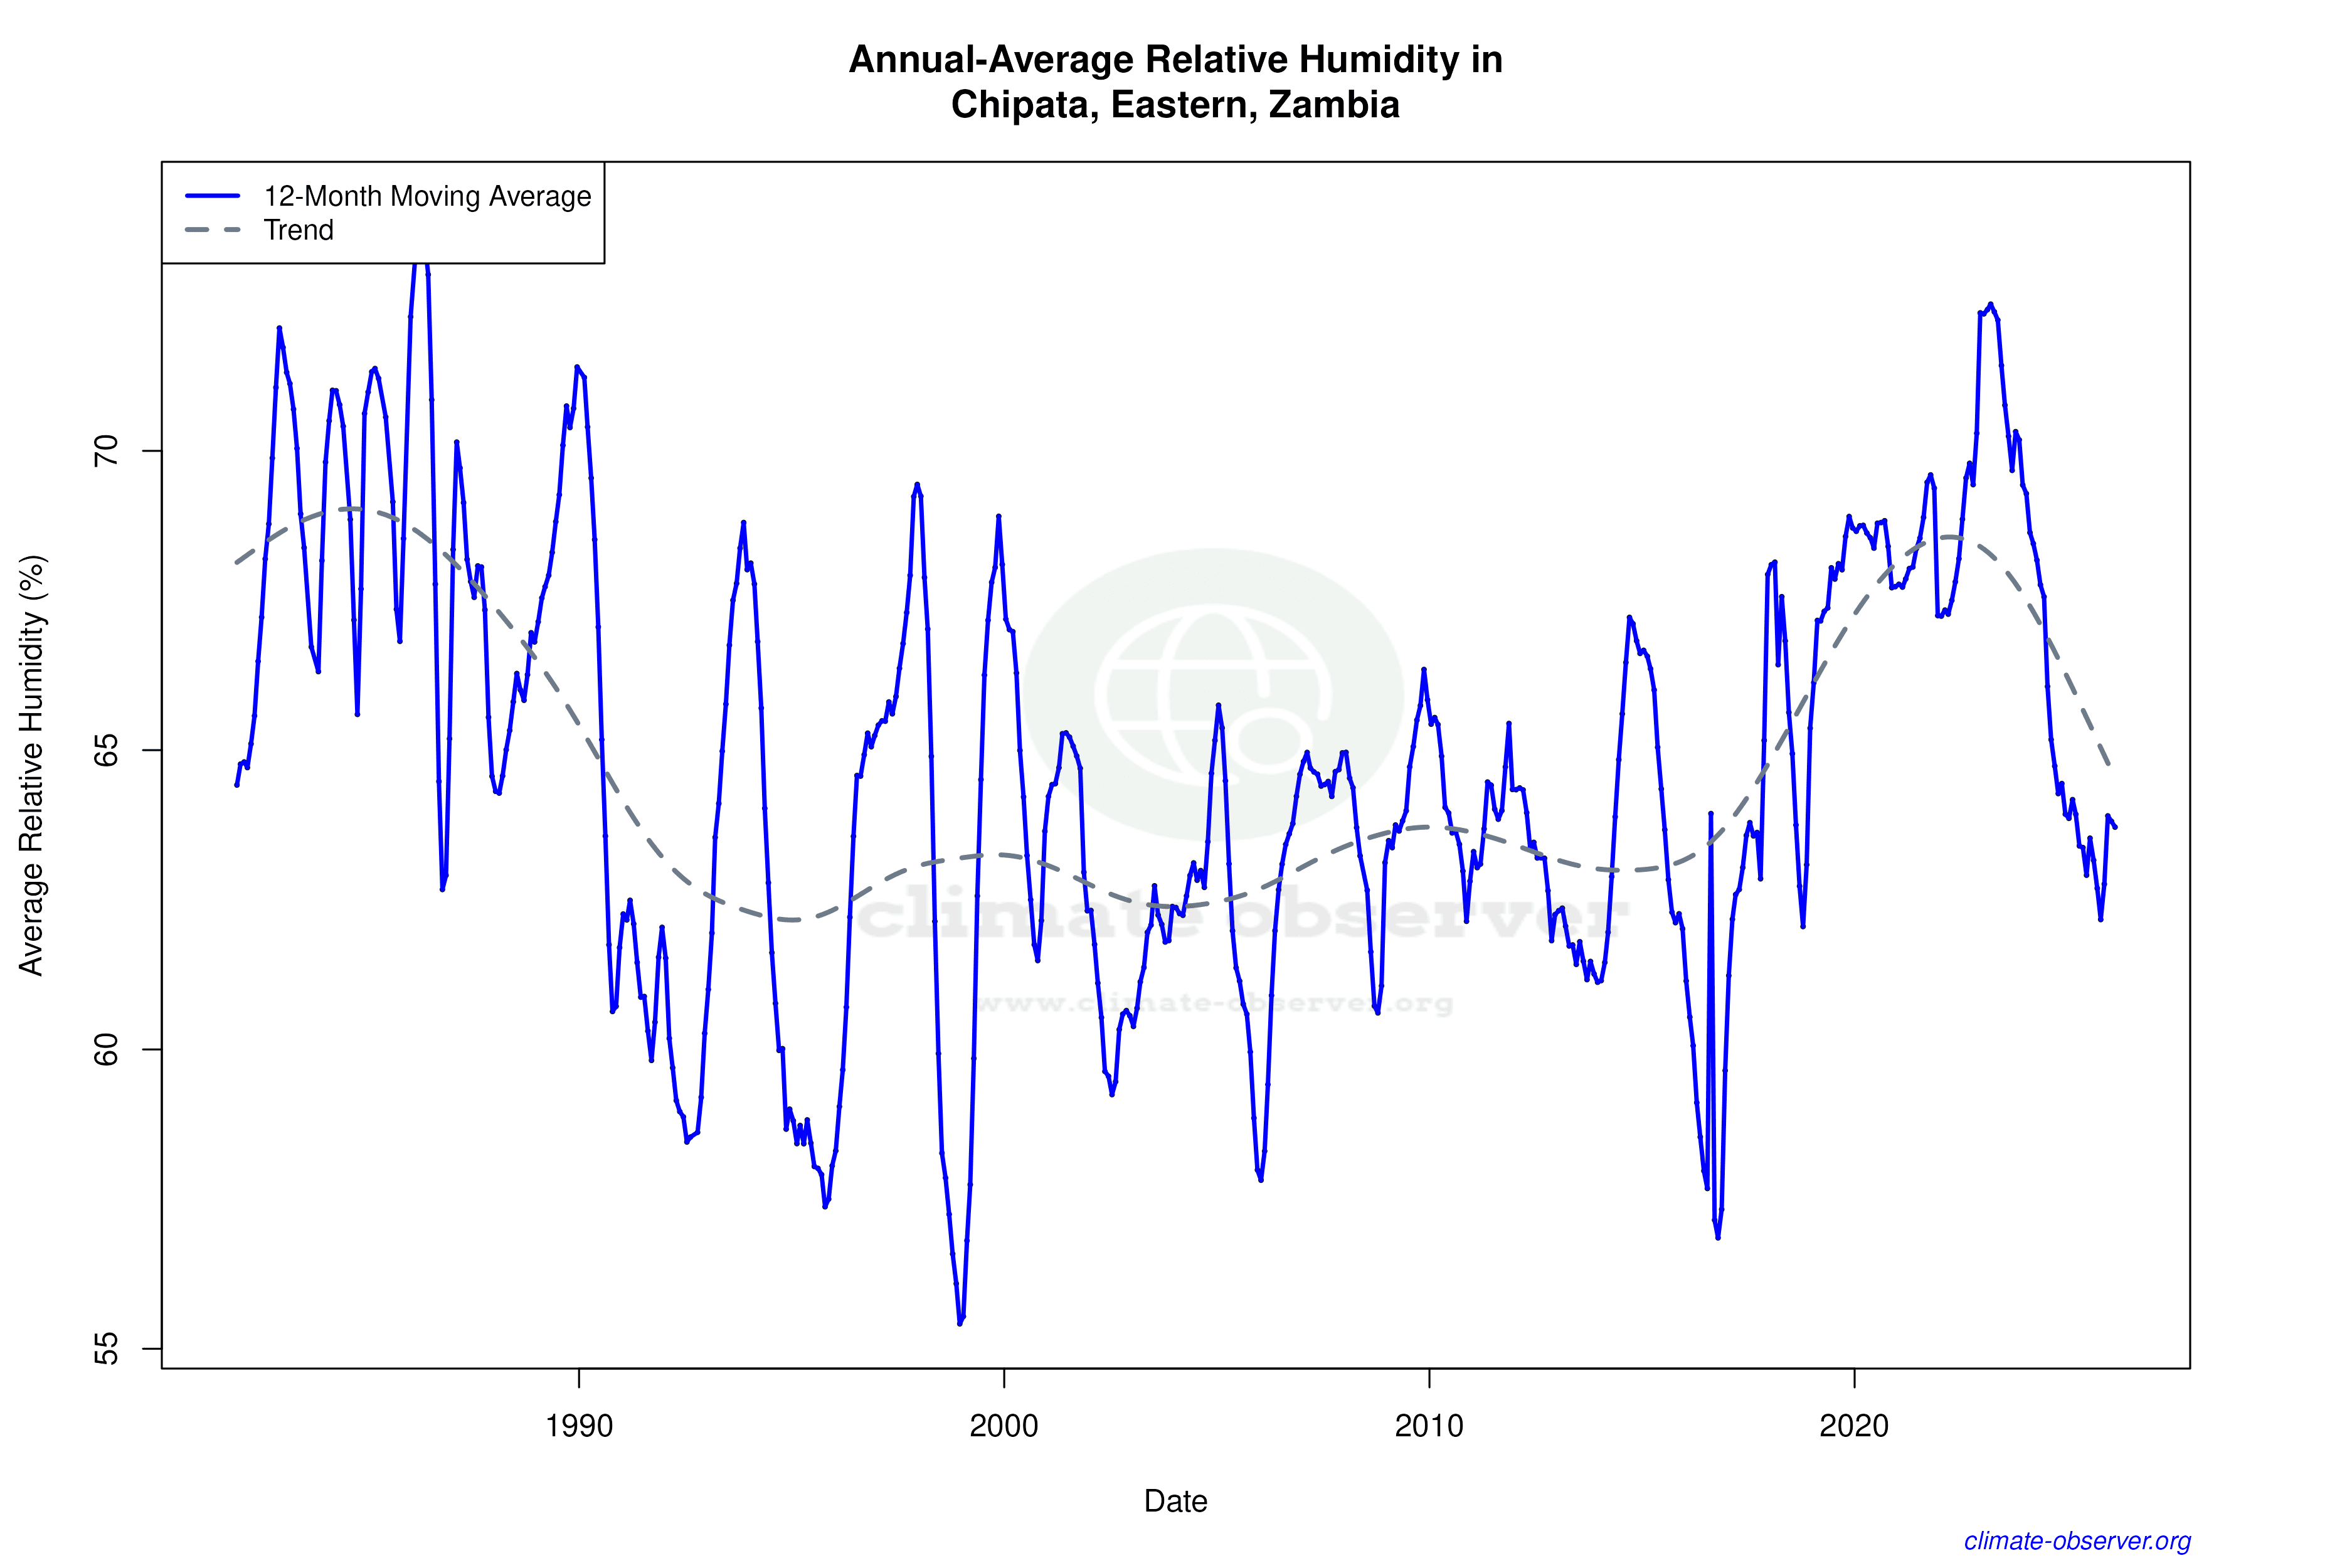
The Precipitation Concentration Index (PCI) for Chipata has shown a significant decrease from a baseline of 22.5 to a current value of 17.9. The PCI measures how rainfall is distributed over time, with higher values indicating more concentrated rainfall events. This decrease suggests that precipitation in Chipata is now more evenly distributed throughout the year, reducing the risk of droughts and floods associated with concentrated rainfall. This shift towards a more consistent rainfall pattern is crucial for agriculture, which is a significant part of the local economy.
Temperature Extremes: Record Highs and Lows
Chipata's climate extremes are marked by a record high of 40.17°C (104.31°F) and a record low of 3.4°C (38.12°F). These extremes underscore the variability in the region's climate, which can impact local agriculture and water resources. The record high temperatures are indicative of the potential for heatwaves, while the low temperatures highlight the risk of cold spells, both of which require adaptive strategies for local communities.
Regional Climate Goals and Adaptation
Zambia has been actively pursuing climate resilience strategies, focusing on sustainable agriculture and water management. The observed trends in Chipata's climate data, particularly the more even distribution of rainfall, align with these national goals. The shift towards more consistent precipitation patterns can support Zambia's efforts to enhance food security and manage water resources effectively. Recent weather events, such as the increased frequency of heatwaves, further emphasise the need for adaptive measures to mitigate the impacts of climate variability in the region.
Station Statistics
10-Year Trend
High: -3.05 °F/decade
Low: +1.96 °F/decade
Rain: -0.018 in/decade
25-Year Trend
High: -0.84 °F/decade
Low: +0.79 °F/decade
Rain: +0.003 in/decade
50-Year Trend
High: +0.23 °F/decade
Low: +0.47 °F/decade
Rain: -0.003 in/decade
All-Time Trend
High: +0.23 °F/decade
Low: +0.47 °F/decade
Rain: -0.002 in/decade
Percentage Above-Average Days
Last 12 Months: 29.3%
This Year: 42.3%
Precipitation Concentration Index (PCI) ℹ️
Last 12 Months: 17.9
Historical Average: 22.3
Percentile Rank of Last 12 Months ℹ️
High: 21st percentile
Low: 95th percentile
Rain: 24th percentile
Change in Variance ℹ️
High: -0.2%
Low: -15.6%
Intraday: -15.2%
Data Coverage
69.6%
First Year of Data
1950
Station Location
Historical Weather Records
| Max High | Avg High | Min High | Max Avg | Avg Avg | Min Avg | Max Low | Avg Low | Min Low | Max Precipitation | Avg Precipitation | Max Snow | Avg Snow | |
|---|---|---|---|---|---|---|---|---|---|---|---|---|---|
| Record | 104.31 °F | — | 63.50 °F | 91.22 °F | — | 54.45 °F | 81.14 °F | — | 38.12 °F | 5.50 in | — | — | — |
| January | 96.15 °F | 80.45 °F | 67.46 °F | 83.30 °F | 72.52 °F | 66.56 °F | 71.80 °F | 65.75 °F | 58.51 °F | 3.66 in | 0.33 in | — | — |
| February | 96.58 °F | 80.32 °F | 68.72 °F | 83.12 °F | 72.30 °F | 66.87 °F | 70.30 °F | 65.29 °F | 54.84 °F | 3.81 in | 0.28 in | — | — |
| March | 93.00 °F | 80.94 °F | 68.90 °F | 83.84 °F | 72.20 °F | 66.06 °F | 70.88 °F | 64.48 °F | 55.04 °F | 5.50 in | 0.16 in | — | — |
| April | 95.81 °F | 81.37 °F | 67.26 °F | 83.66 °F | 70.98 °F | 60.62 °F | 70.25 °F | 61.58 °F | 50.36 °F | 1.74 in | 0.04 in | — | — |
| May | 96.53 °F | 80.34 °F | 64.15 °F | 81.86 °F | 68.33 °F | 56.95 °F | 68.72 °F | 57.46 °F | 47.84 °F | 0.67 in | 0.00 in | — | — |
| June | 98.60 °F | 78.20 °F | 66.90 °F | 84.38 °F | 65.41 °F | 55.51 °F | 68.36 °F | 53.74 °F | 40.64 °F | 0.18 in | 0.00 in | — | — |
| July | 89.80 °F | 78.60 °F | 64.94 °F | 79.52 °F | 65.09 °F | 54.45 °F | 65.30 °F | 52.95 °F | 38.12 °F | 0.08 in | 0.00 in | — | — |
| August | 94.59 °F | 83.61 °F | 63.50 °F | 85.82 °F | 69.56 °F | 58.64 °F | 72.86 °F | 56.68 °F | 42.08 °F | 0.18 in | 0.00 in | — | — |
| September | 100.76 °F | 89.69 °F | 73.40 °F | 88.88 °F | 75.71 °F | 61.88 °F | 73.22 °F | 62.40 °F | 48.56 °F | 0.51 in | 0.00 in | — | — |
| October | 104.31 °F | 93.02 °F | 71.08 °F | 91.22 °F | 79.70 °F | 63.68 °F | 81.14 °F | 67.01 °F | 43.88 °F | 2.05 in | 0.03 in | — | — |
| November | 103.77 °F | 91.85 °F | 73.22 °F | 91.04 °F | 79.73 °F | 68.18 °F | 78.26 °F | 68.61 °F | 51.80 °F | 3.18 in | 0.14 in | — | — |
| December | 102.61 °F | 84.88 °F | 70.79 °F | 90.86 °F | 75.26 °F | 66.20 °F | 76.10 °F | 66.99 °F | 58.10 °F | 5.46 in | 0.28 in | — | — |
Data Visualisations
Remove WatermarksCurrent Year Climate Trends vs Historical

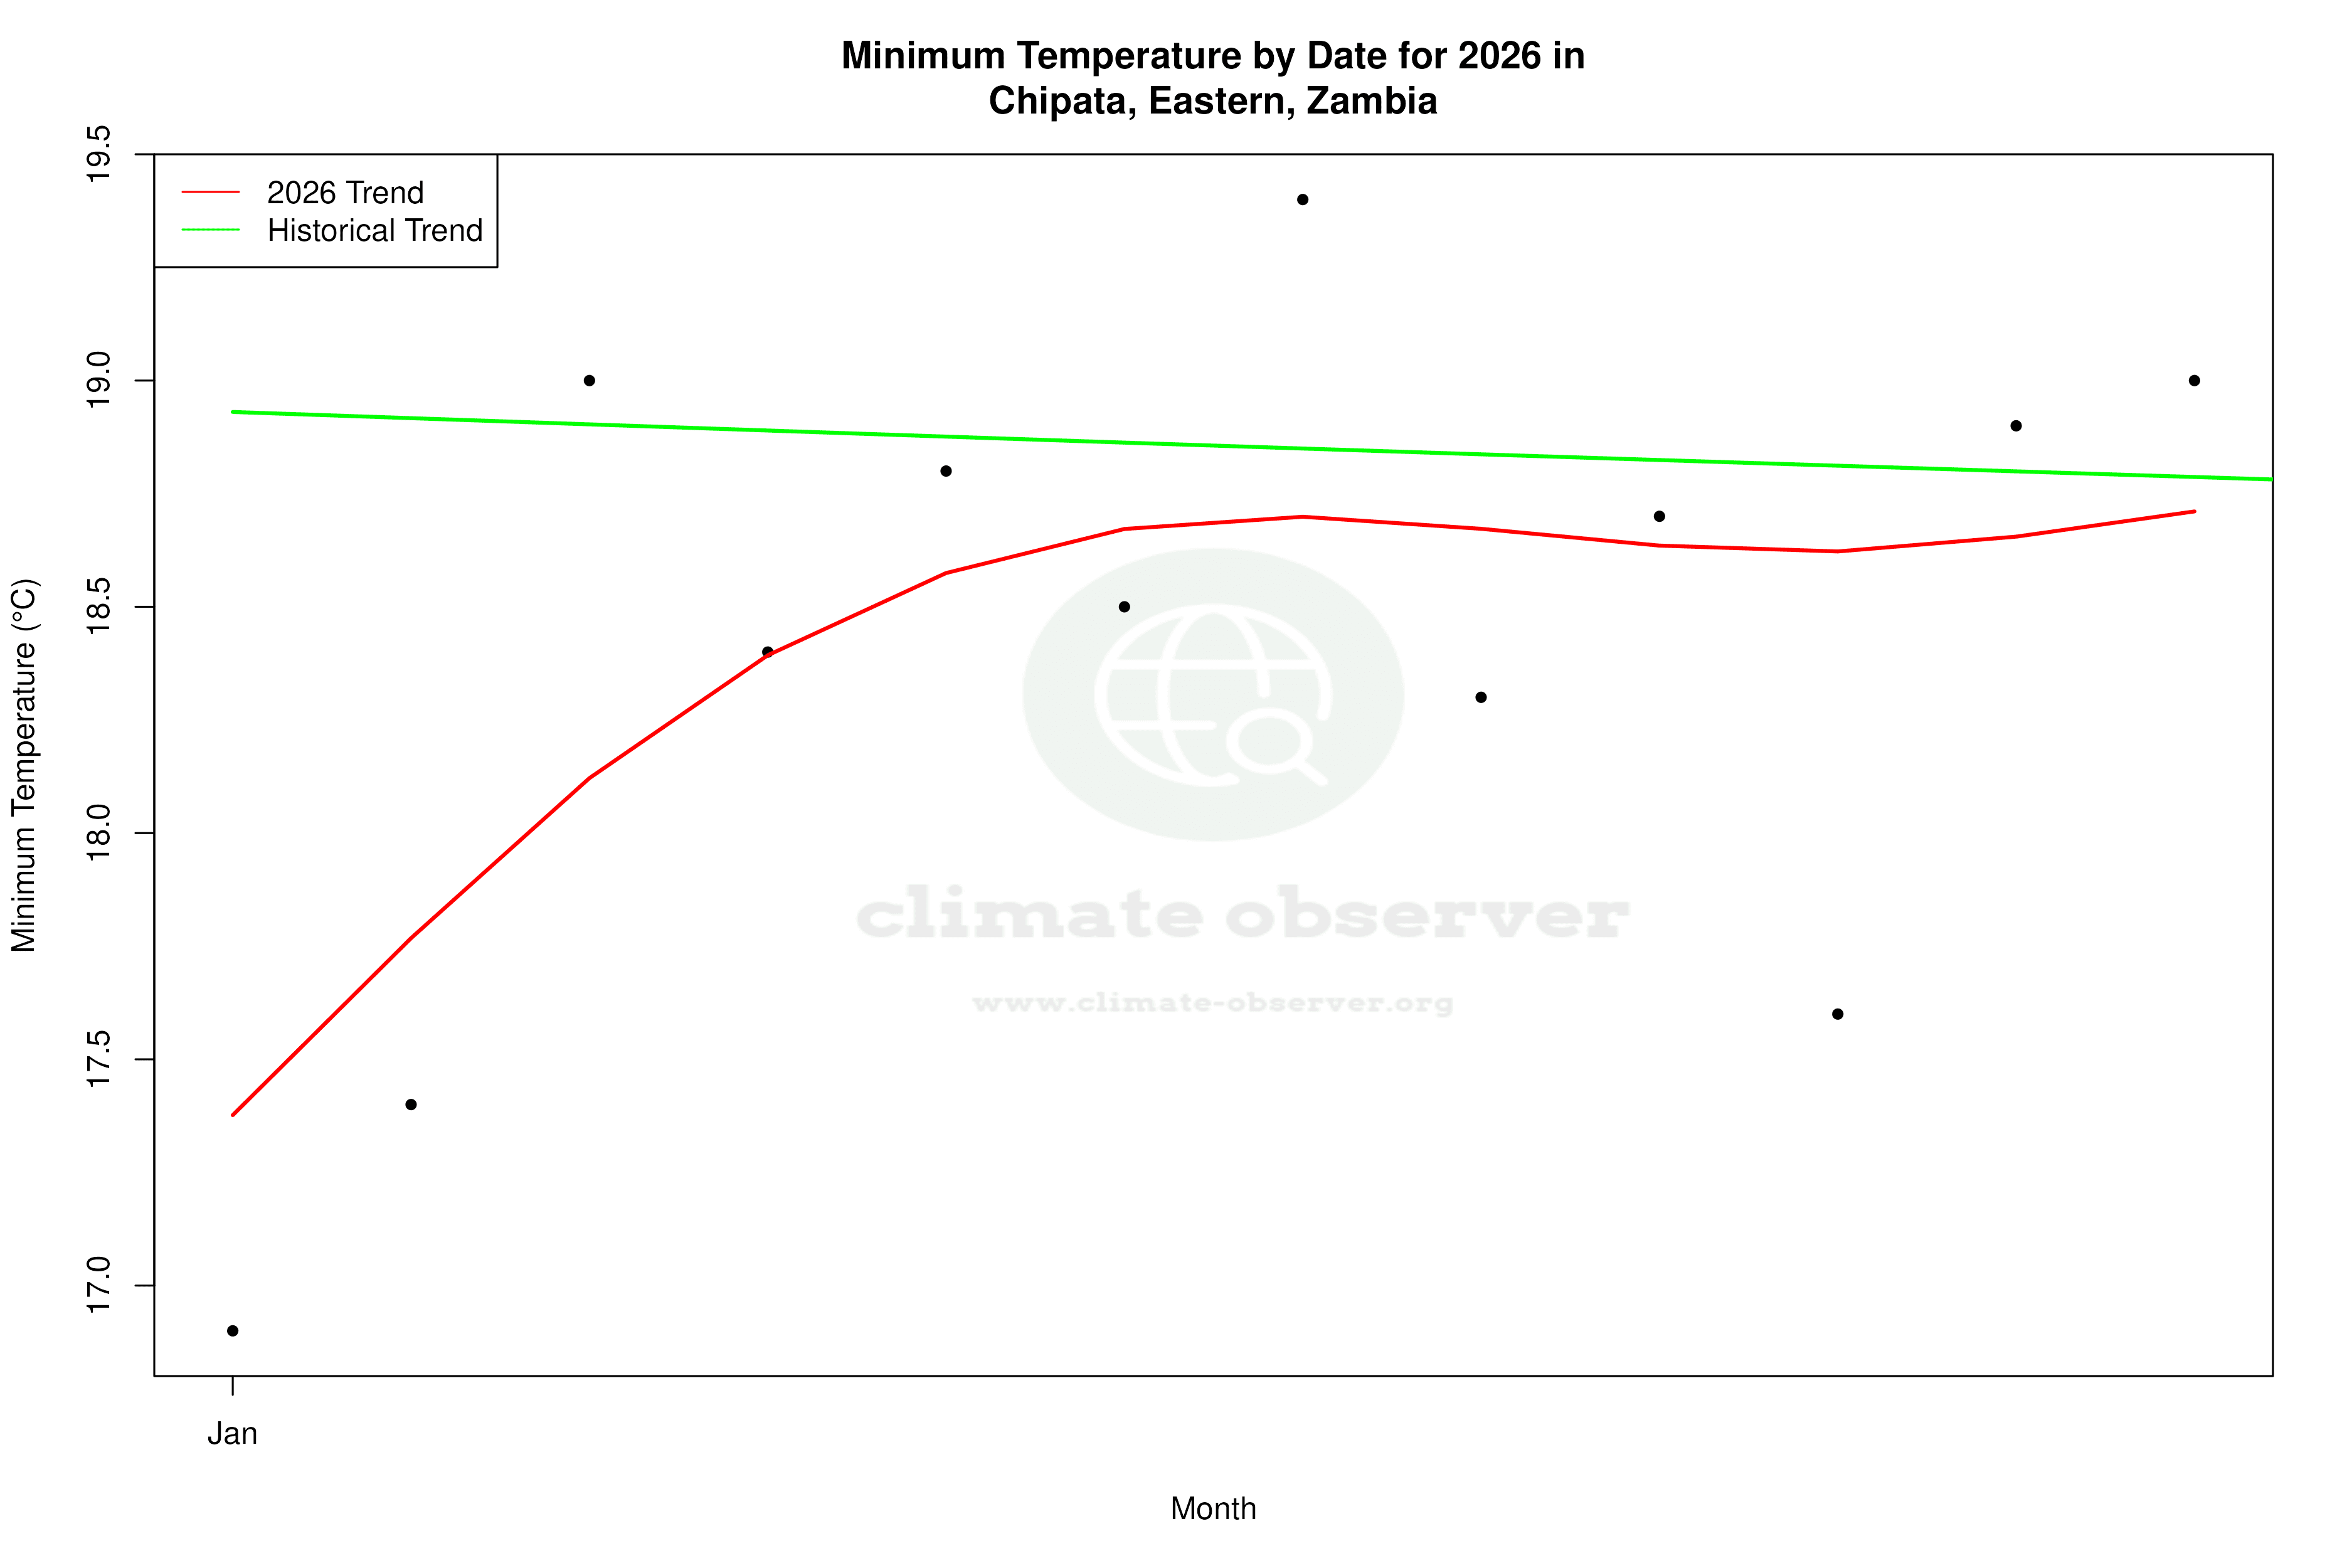


Max Temperature this Year | 1 of 6
Climate 12-Month Moving Averages
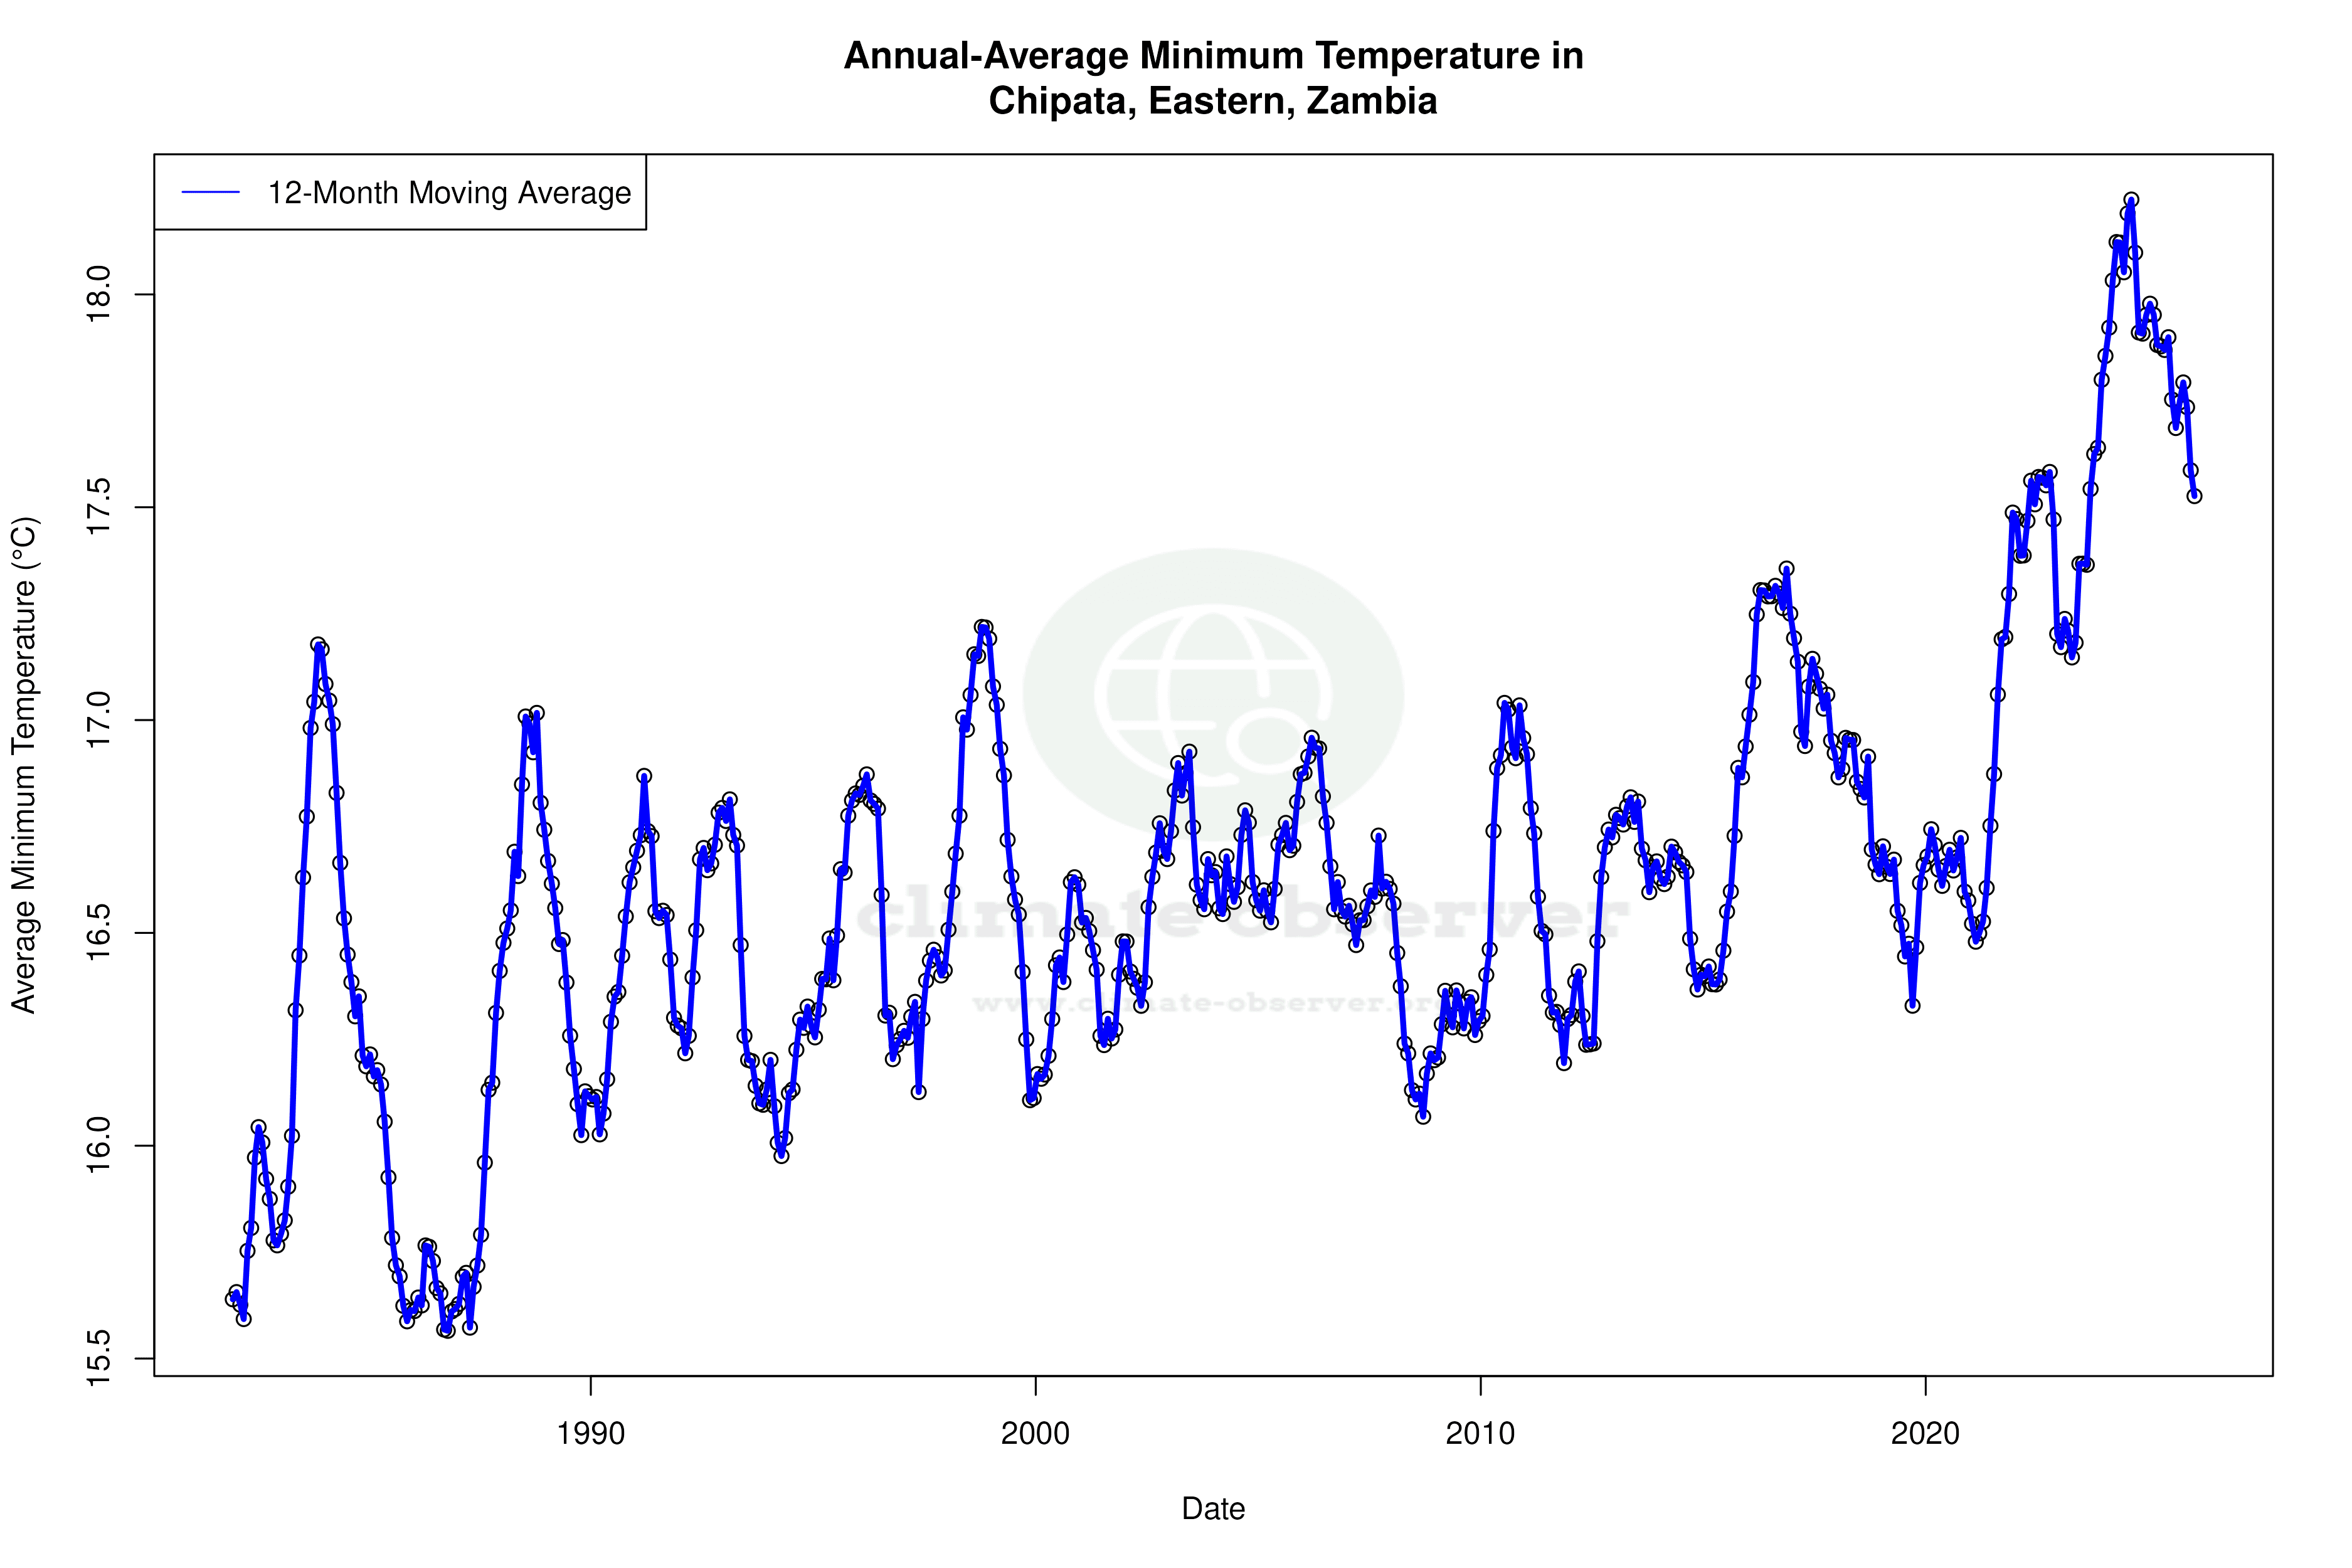
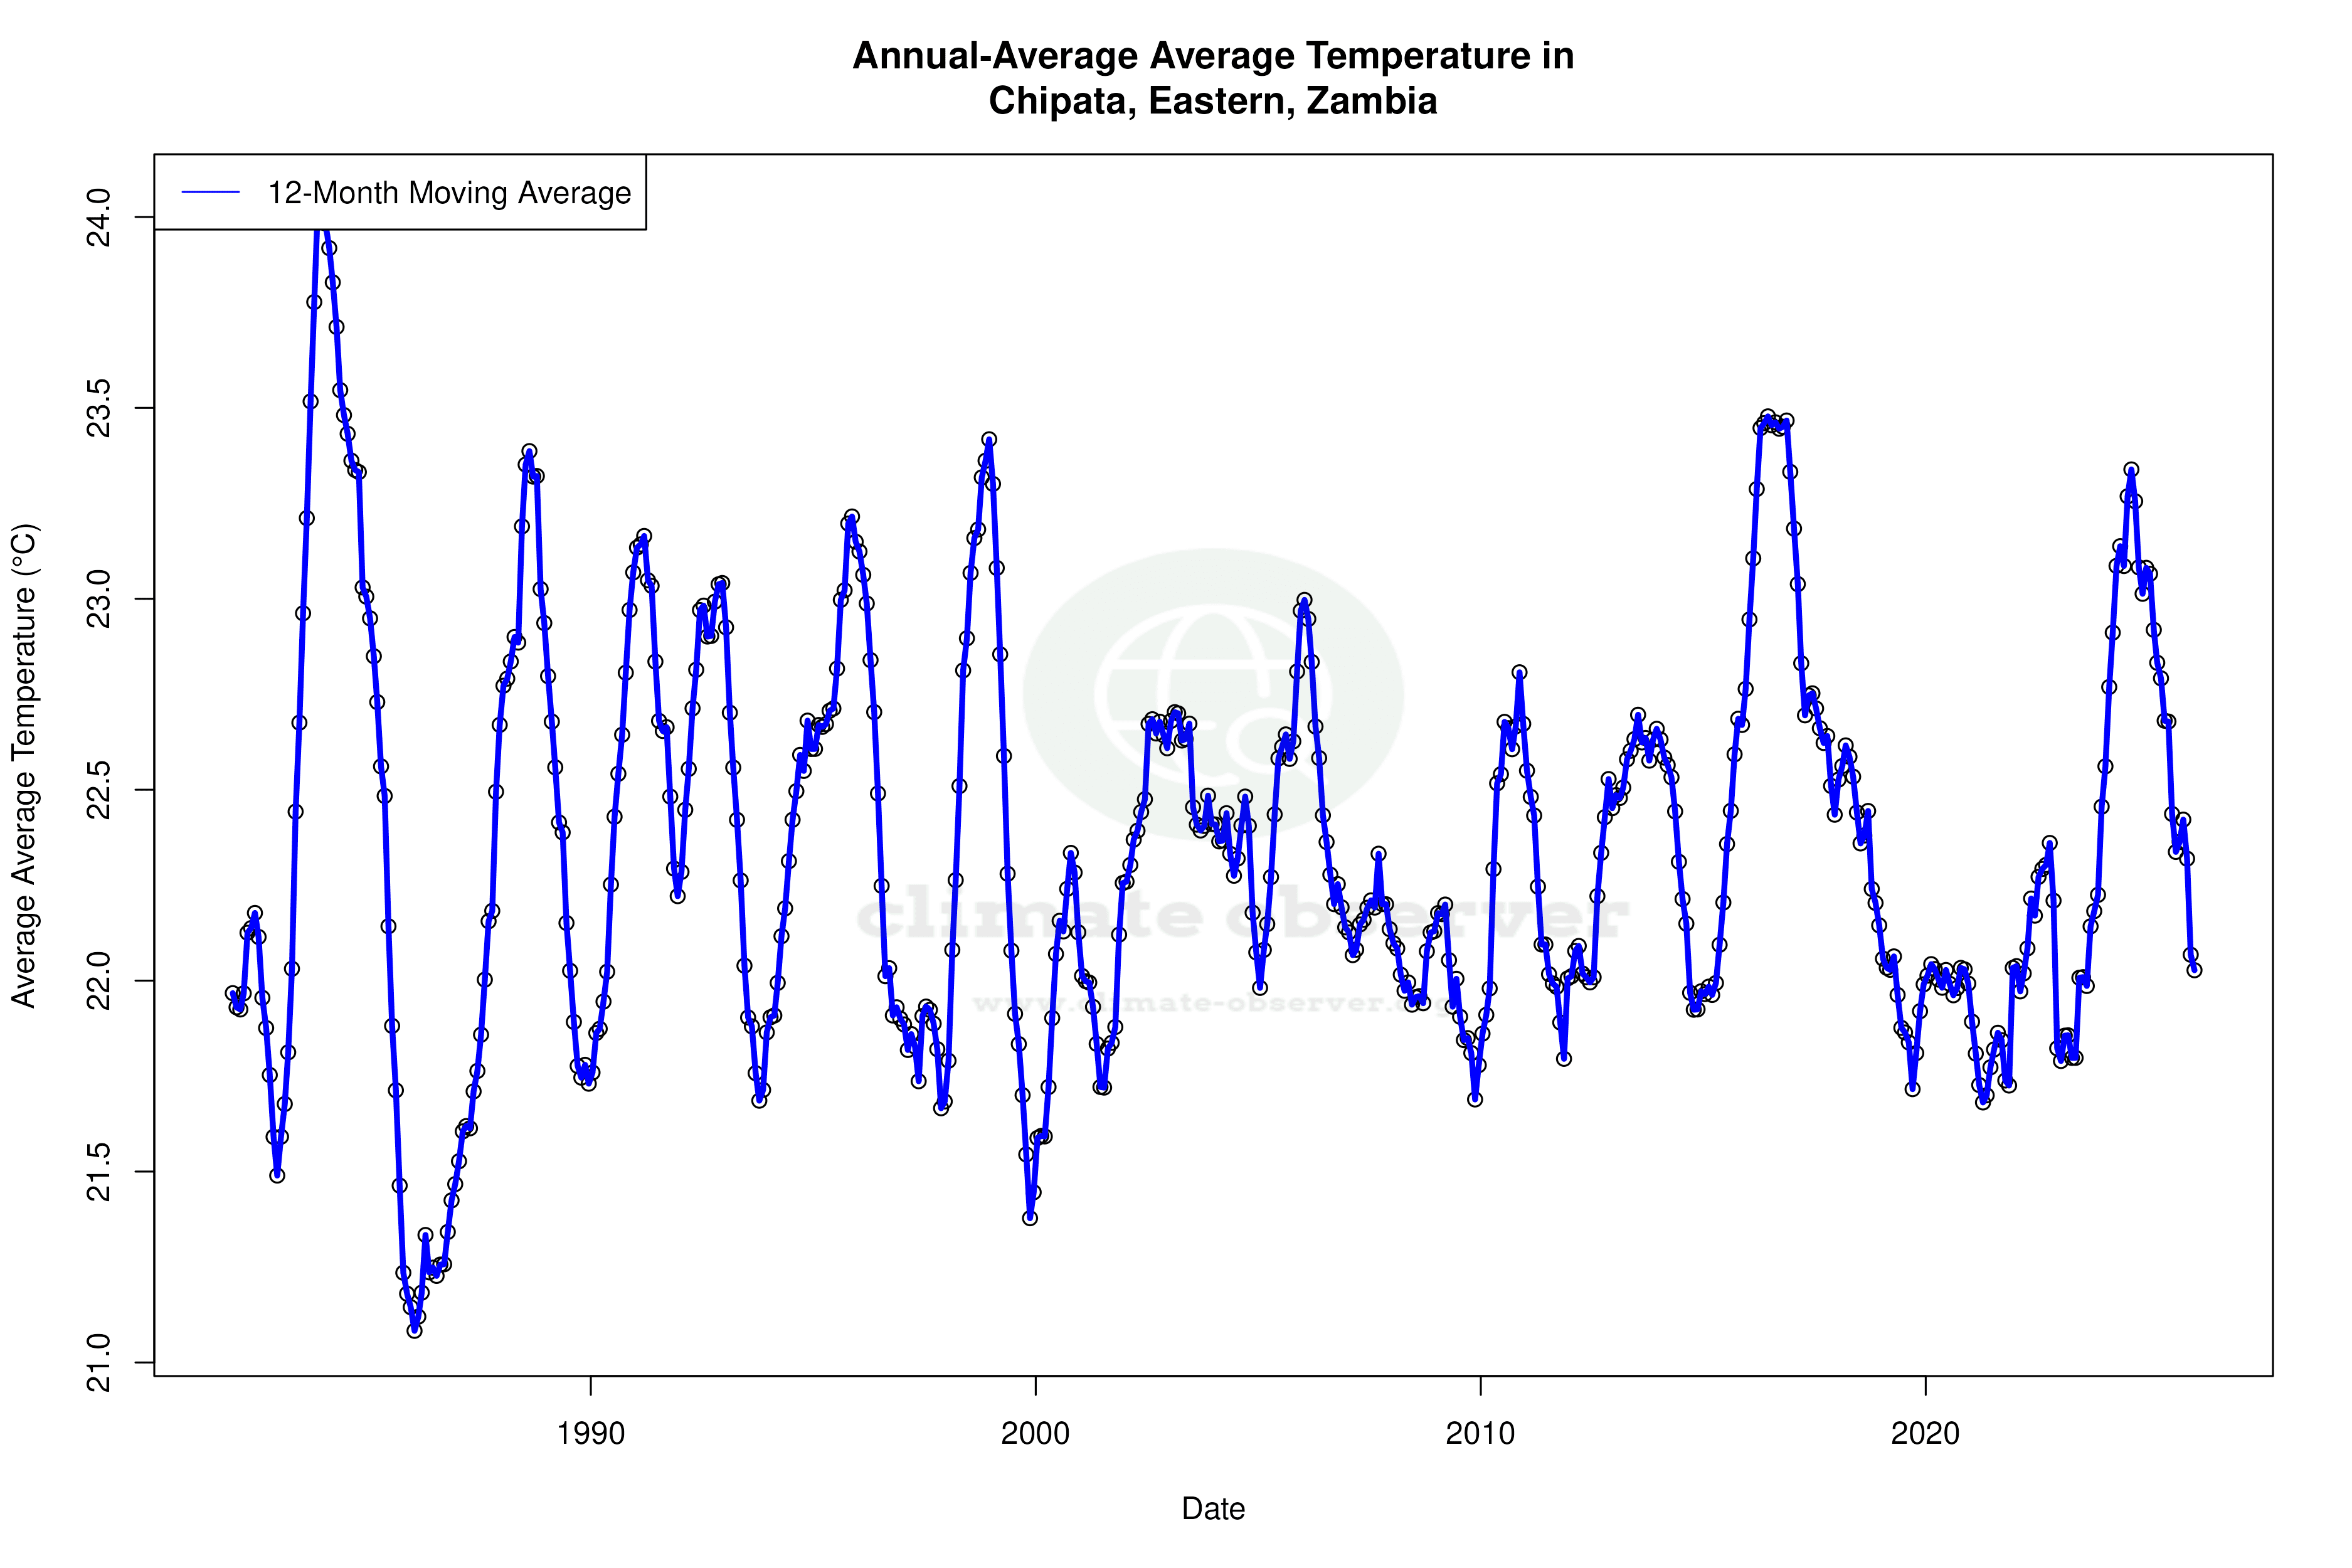


Max Temperature 12-Month MA | 1 of 6
Daily Data Points and Averages Throughout the Year


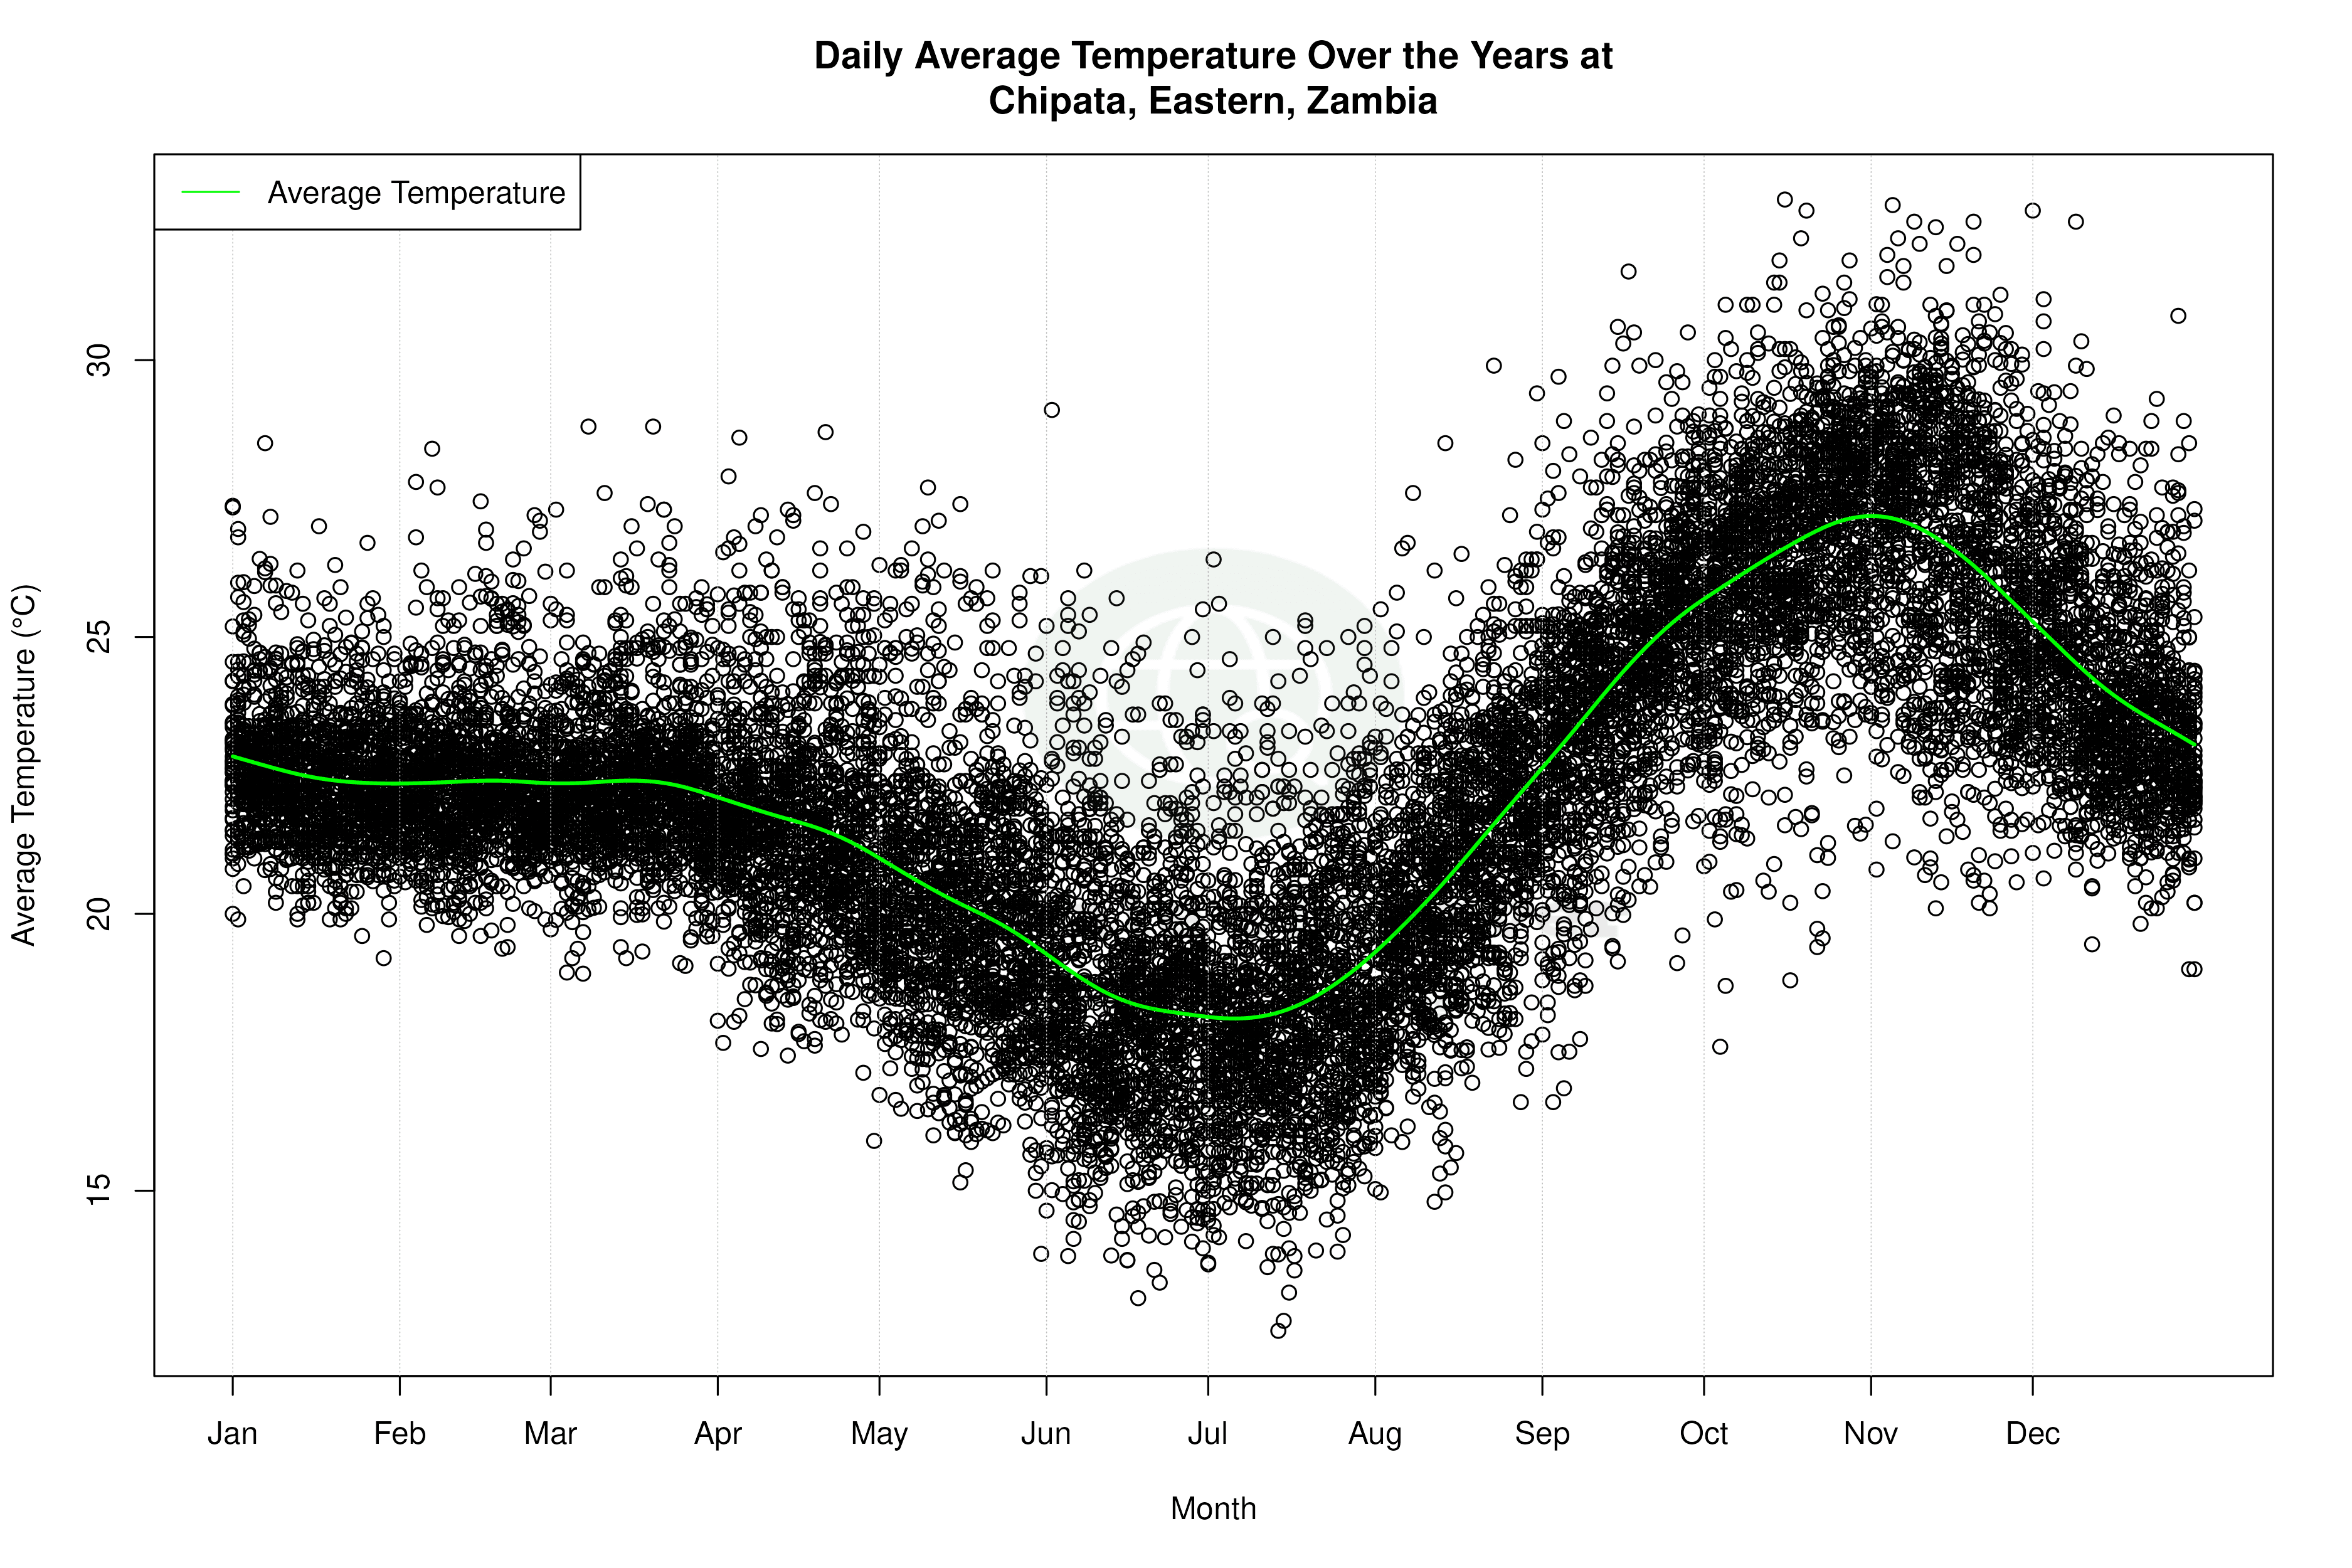
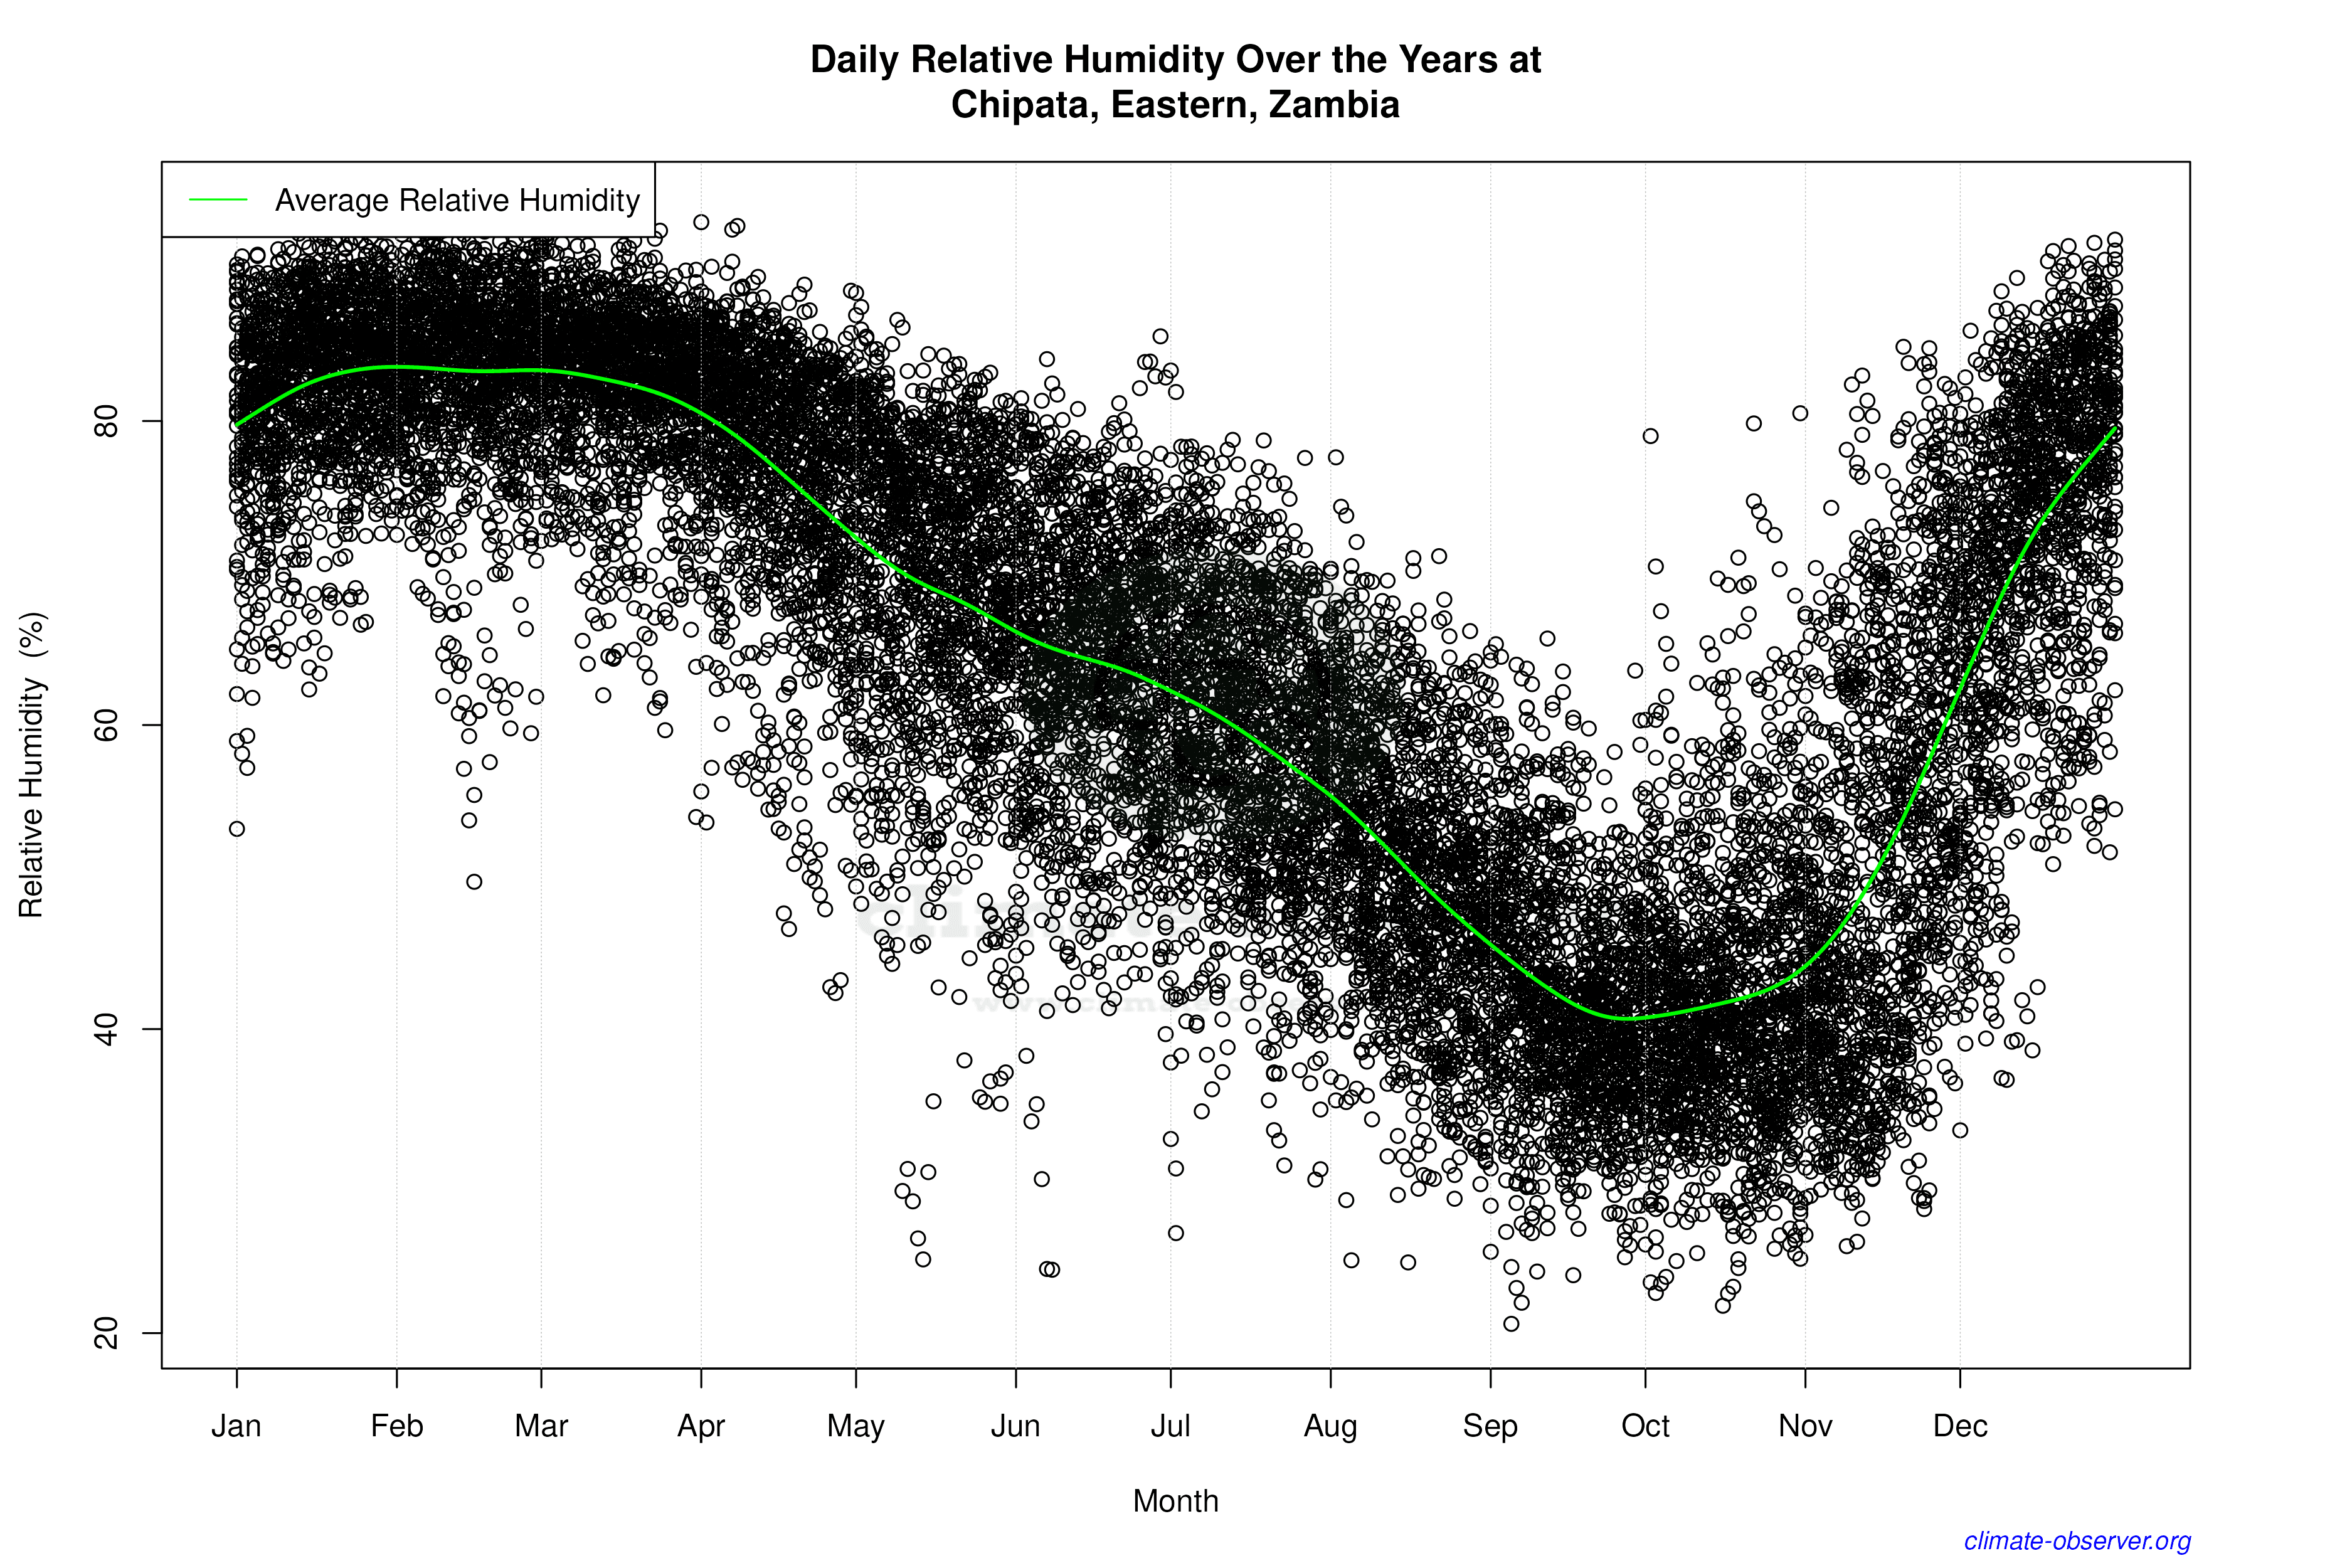

Average Max Temperature Throughout Year | 1 of 5
