Climate for Station: Mongu, Western, Zambia
Loading live weather...
Climate Analysis & Overview
Mongu's climate profile reveals a nuanced interplay of warming and cooling trends, alongside a more evenly distributed precipitation pattern. The region's all-time temperature trends indicate a warming trajectory, while recent years have shown a cooling in highs, suggesting complex climatic dynamics.
Köppen Climate Classification and Local Geography
Mongu, located in the Western Province of Zambia, falls under the Köppen climate classification of Aw, denoting a tropical savanna climate with a distinct wet and dry season. This classification is influenced by its geographical setting on the Barotse Floodplain, which is part of the Zambezi River basin. The floodplain's seasonal inundation plays a critical role in the local climate, affecting temperature and precipitation patterns.
Temperature Trends: A Tale of Two Periods
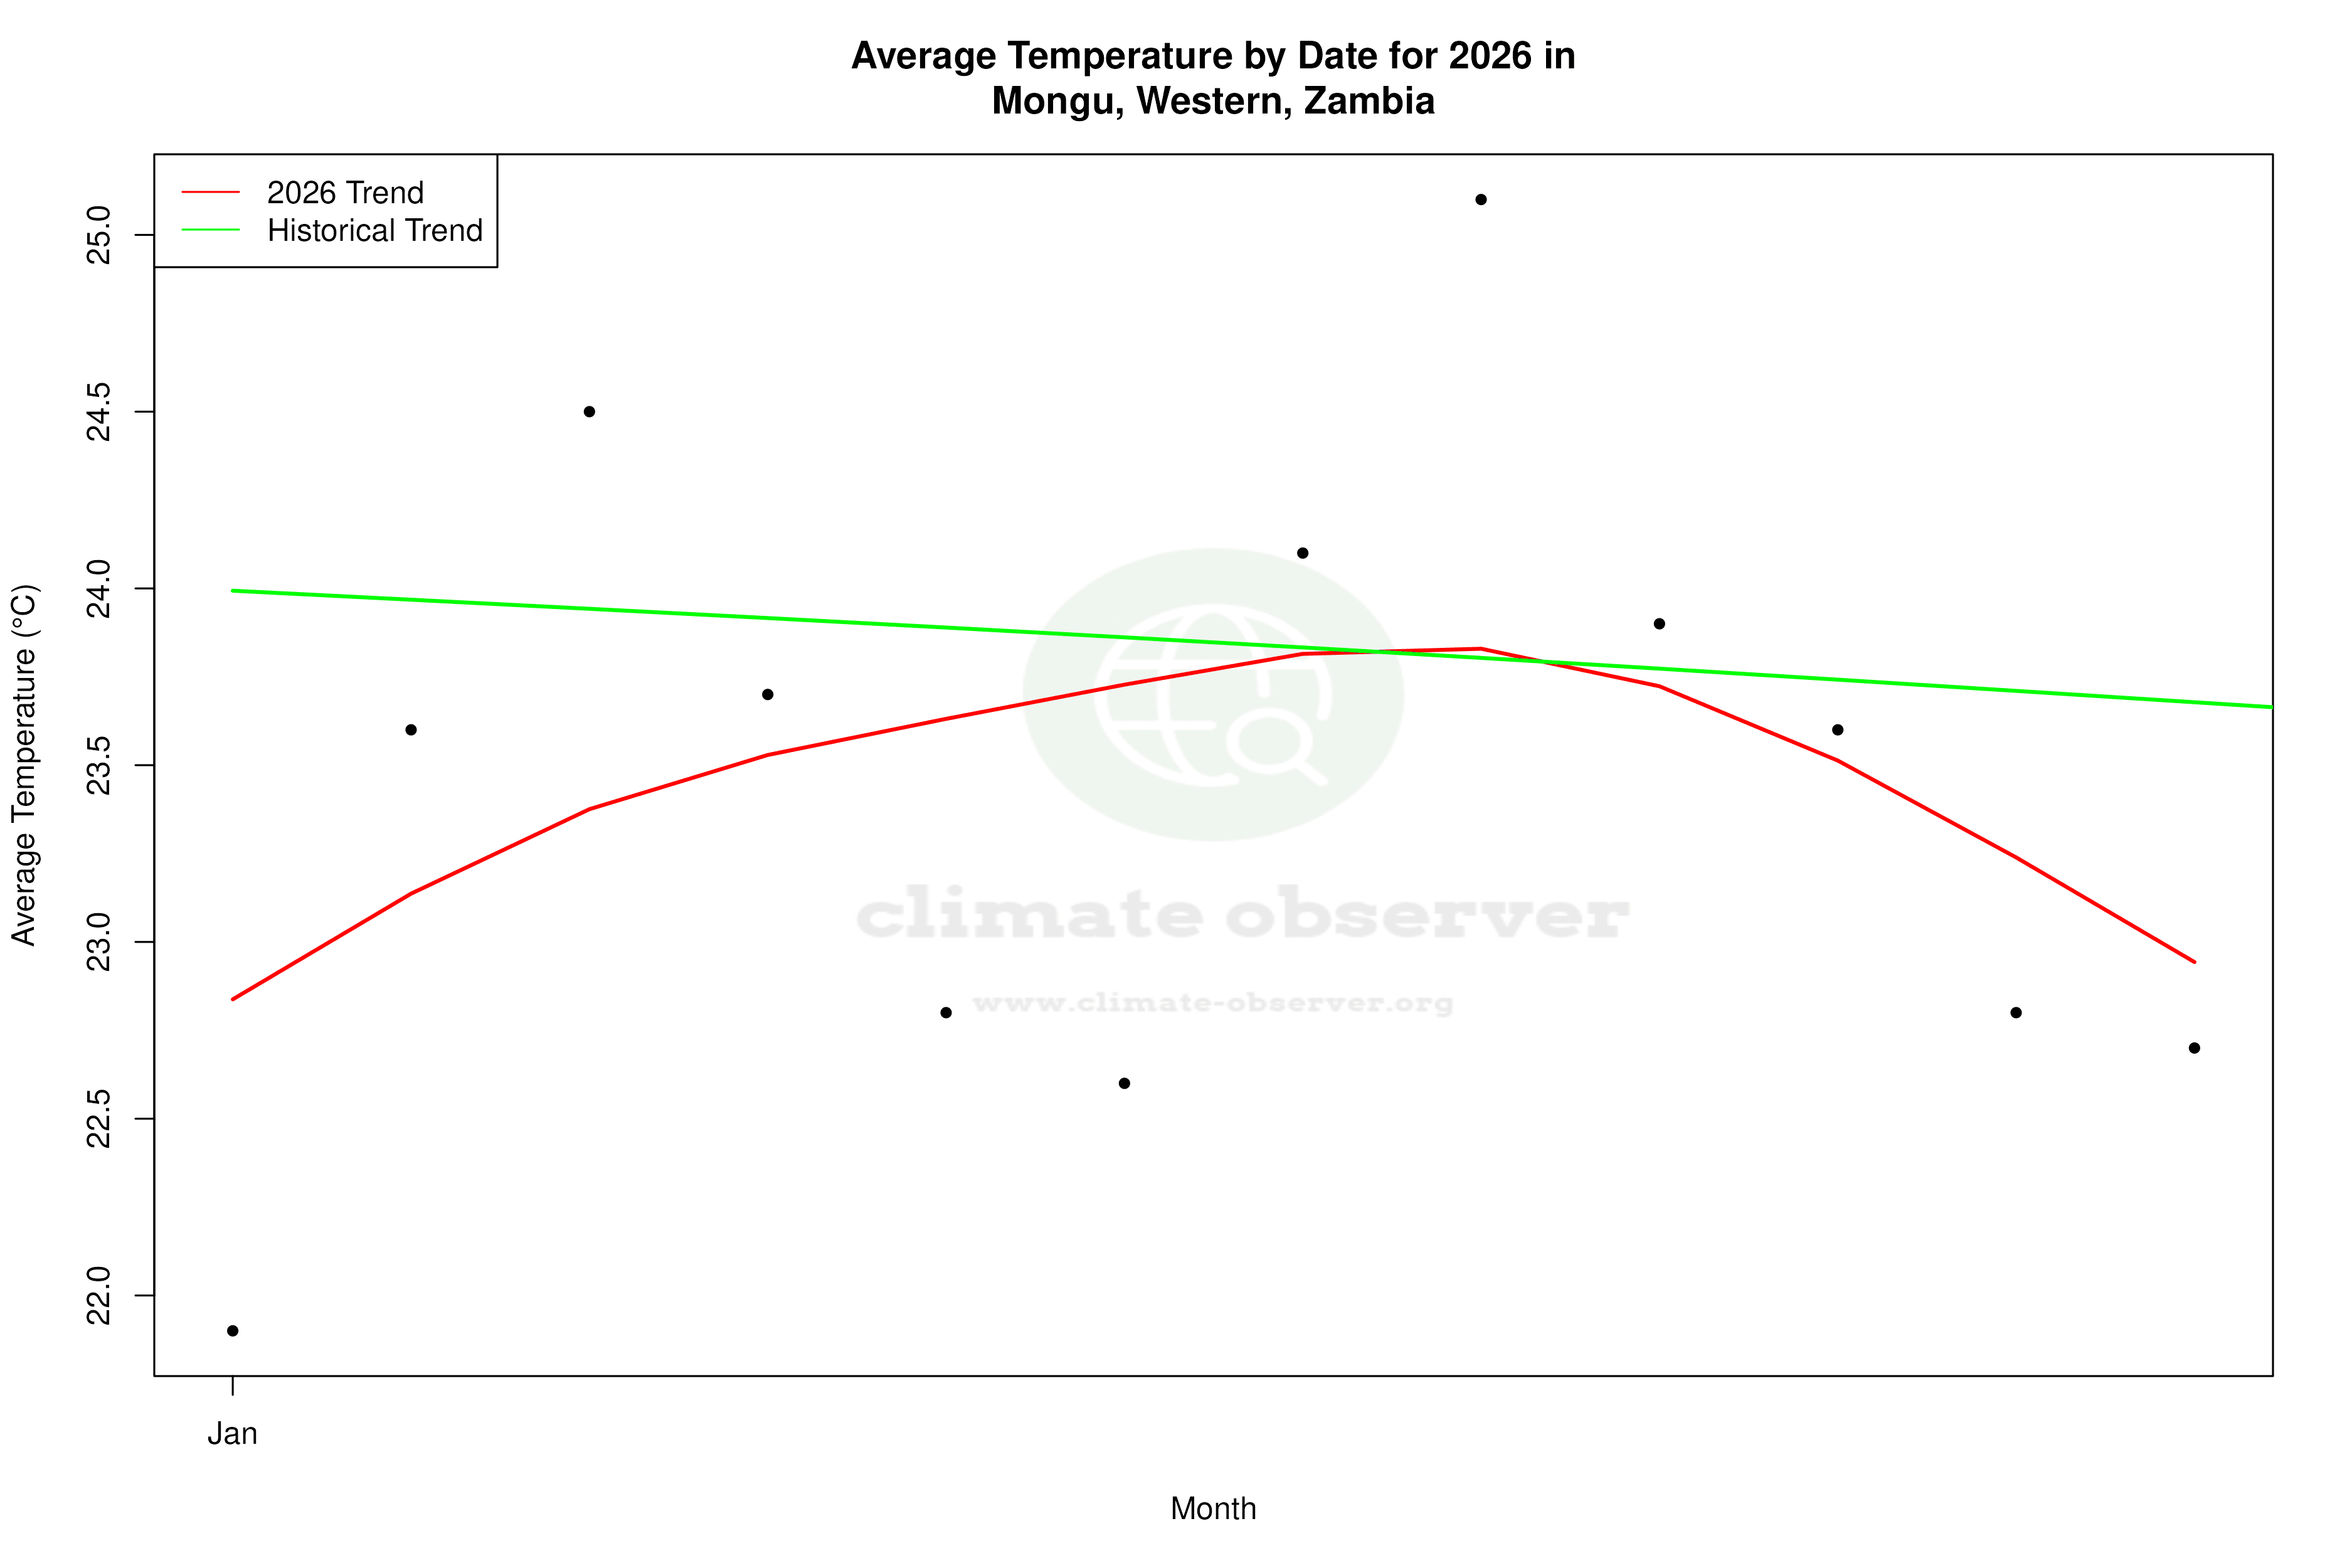
Examining the long-term temperature trends, Mongu has experienced an all-time warming with highs increasing by 0.13°C (0.23°F) and lows by 0.24°C (0.43°F). This suggests a gradual rise in baseline temperatures over the years. However, the past decade presents a contrasting picture with a cooling trend in highs, decreasing by 0.37°C (0.67°F), while lows have shown a slight warming of 0.04°C (0.07°F). This divergence highlights the complexity of local climatic changes, potentially influenced by regional atmospheric conditions and land use changes.
Precipitation Patterns: Towards Even Distribution
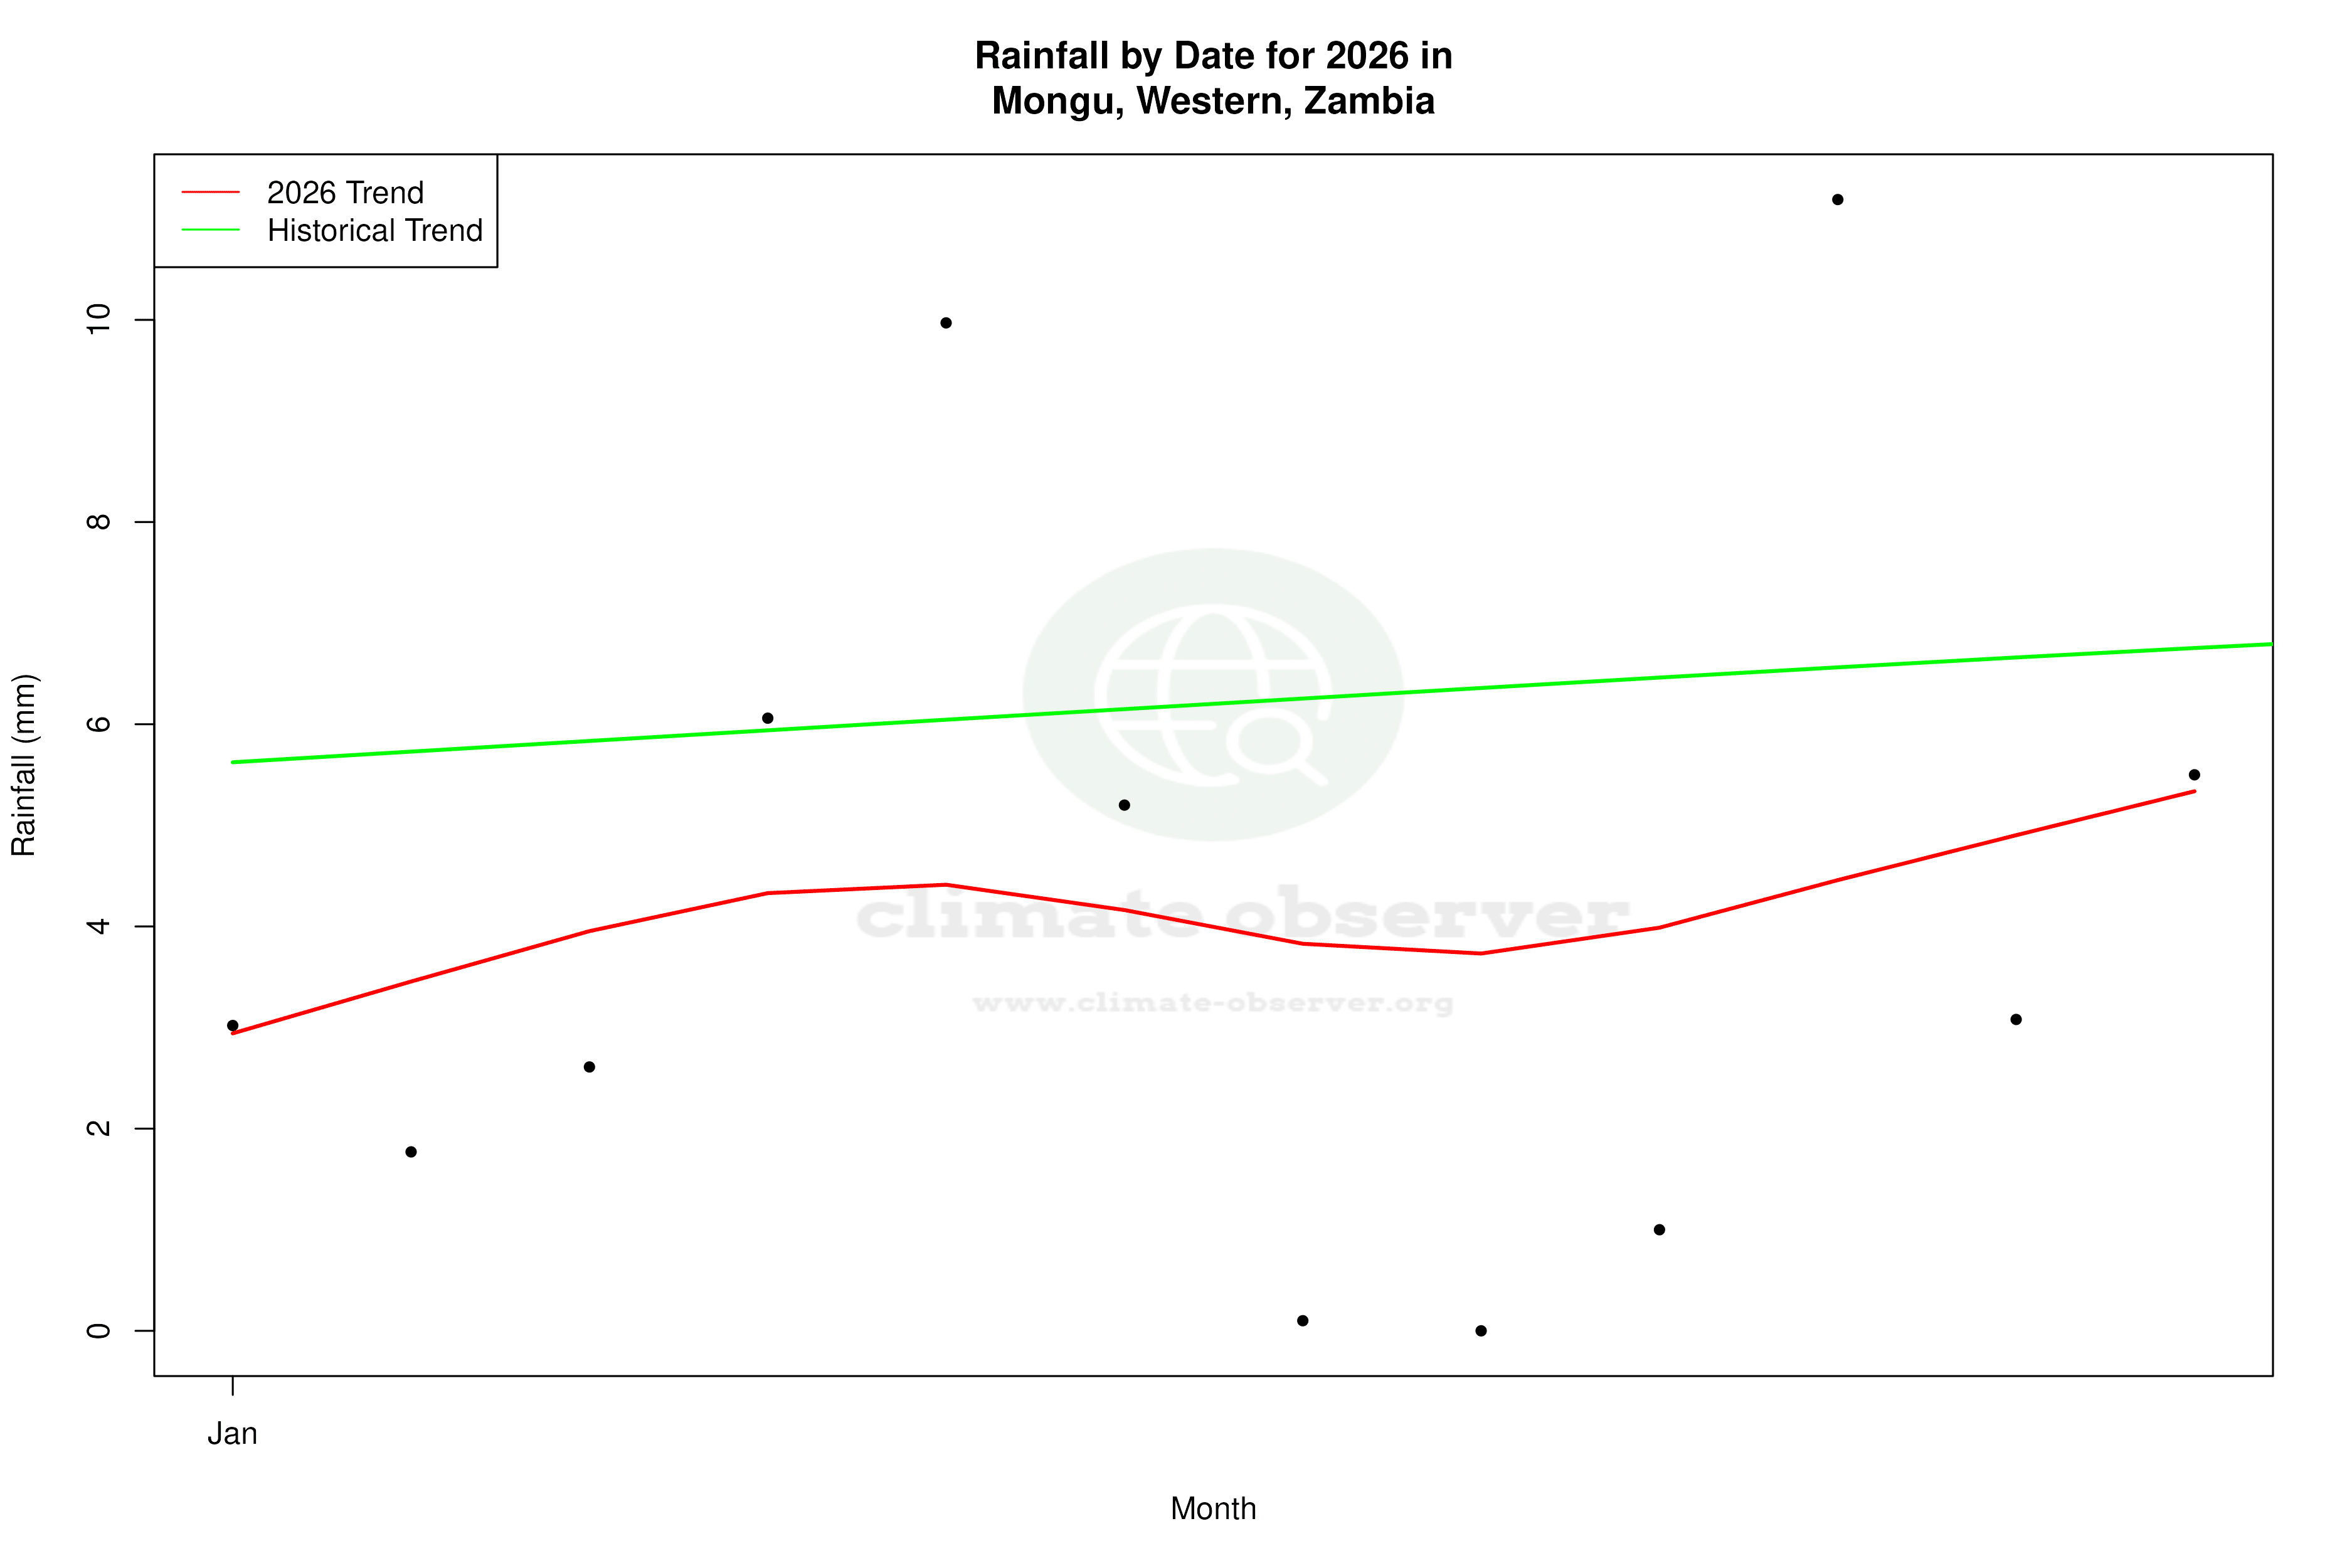
The Precipitation Concentration Index (PCI) for Mongu has decreased from a baseline of 21.3 to a current value of 17.0. This significant change indicates that precipitation events have become more evenly distributed throughout the year, reducing the concentration of rainfall in fewer, more intense events. This shift could have implications for local agriculture and water management, as more consistent rainfall can support crop growth and reduce the risk of flooding.
Temperature Extremes: Records and Implications
Mongu's recorded temperature extremes reflect its tropical savanna climate. The highest recorded temperature is 41.82°C (107.28°F), while the lowest is 1.6°C (34.88°F). These extremes underscore the variability inherent in the region's climate, which can affect everything from human health to agricultural productivity. Understanding and adapting to these extremes is crucial for local communities and policymakers, particularly in the context of Zambia's climate resilience goals.
Regional Climate Context and Future Considerations
Zambia has been proactive in addressing climate change, with initiatives aimed at enhancing resilience and sustainable development. Mongu's climate profile, with its mixed temperature trends and evolving precipitation patterns, offers valuable insights into the broader regional climate dynamics. As Zambia continues to pursue its climate goals, understanding localised patterns such as those seen in Mongu will be essential for crafting effective adaptation and mitigation strategies.
Station Statistics
10-Year Trend
High: -0.95 °F/decade
Low: +0.03 °F/decade
Rain: -0.025 in/decade
25-Year Trend
High: -0.46 °F/decade
Low: +0.36 °F/decade
Rain: -0.000 in/decade
50-Year Trend
High: +0.20 °F/decade
Low: +0.42 °F/decade
Rain: -0.001 in/decade
All-Time Trend
High: +0.20 °F/decade
Low: +0.42 °F/decade
Rain: -0.003 in/decade
Percentage Above-Average Days
Last 12 Months: 27.3%
This Year: 32.9%
Precipitation Concentration Index (PCI) ℹ️
Last 12 Months: 18.4
Historical Average: 21.9
Percentile Rank of Last 12 Months ℹ️
High: 16th percentile
Low: 76th percentile
Rain: 23rd percentile
Change in Variance ℹ️
High: +5.6%
Low: -14.1%
Intraday: -19.9%
Data Coverage
73.4%
First Year of Data
1956
Station Location
Historical Weather Records
| Max High | Avg High | Min High | Max Avg | Avg Avg | Min Avg | Max Low | Avg Low | Min Low | Max Precipitation | Avg Precipitation | Max Snow | Avg Snow | |
|---|---|---|---|---|---|---|---|---|---|---|---|---|---|
| Record | 107.28 °F | — | 65.93 °F | 92.84 °F | — | 48.74 °F | 80.74 °F | — | 34.88 °F | 9.32 in | — | — | — |
| January | 100.99 °F | 83.02 °F | 71.42 °F | 86.18 °F | 74.43 °F | 67.87 °F | 73.83 °F | 66.56 °F | 59.61 °F | 3.33 in | 0.27 in | — | — |
| February | 100.40 °F | 83.06 °F | 73.22 °F | 90.68 °F | 74.31 °F | 68.07 °F | 73.76 °F | 66.36 °F | 57.85 °F | 9.32 in | 0.25 in | — | — |
| March | 100.83 °F | 84.08 °F | 72.48 °F | 86.41 °F | 74.61 °F | 66.92 °F | 73.80 °F | 65.79 °F | 54.27 °F | 2.62 in | 0.14 in | — | — |
| April | 99.59 °F | 85.28 °F | 72.07 °F | 87.62 °F | 73.59 °F | 64.04 °F | 73.24 °F | 62.26 °F | 46.40 °F | 4.11 in | 0.03 in | — | — |
| May | 97.70 °F | 84.22 °F | 71.29 °F | 82.04 °F | 70.24 °F | 60.42 °F | 71.91 °F | 56.65 °F | 43.16 °F | 0.50 in | 0.00 in | — | — |
| June | 92.30 °F | 81.42 °F | 65.93 °F | 79.16 °F | 66.17 °F | 48.74 °F | 65.73 °F | 51.74 °F | 34.88 °F | 0.13 in | 0.00 in | — | — |
| July | 98.60 °F | 81.89 °F | 67.46 °F | 80.96 °F | 66.00 °F | 52.52 °F | 64.71 °F | 51.00 °F | 37.67 °F | 0.49 in | 0.00 in | — | — |
| August | 98.96 °F | 88.25 °F | 75.38 °F | 86.54 °F | 71.88 °F | 59.54 °F | 71.80 °F | 56.07 °F | 42.80 °F | 0.42 in | 0.00 in | — | — |
| September | 104.25 °F | 95.32 °F | 78.26 °F | 89.60 °F | 79.30 °F | 65.66 °F | 77.43 °F | 63.64 °F | 50.00 °F | 1.34 in | 0.01 in | — | — |
| October | 107.28 °F | 97.13 °F | 74.16 °F | 92.84 °F | 83.01 °F | 63.14 °F | 80.08 °F | 69.50 °F | 54.32 °F | 2.10 in | 0.06 in | — | — |
| November | 106.70 °F | 91.19 °F | 74.91 °F | 92.44 °F | 79.84 °F | 66.56 °F | 80.74 °F | 69.00 °F | 57.20 °F | 2.80 in | 0.17 in | — | — |
| December | 102.85 °F | 85.44 °F | 72.75 °F | 89.71 °F | 76.18 °F | 67.46 °F | 76.44 °F | 67.47 °F | 59.88 °F | 3.37 in | 0.25 in | — | — |
Data Visualisations
Remove WatermarksCurrent Year Climate Trends vs Historical
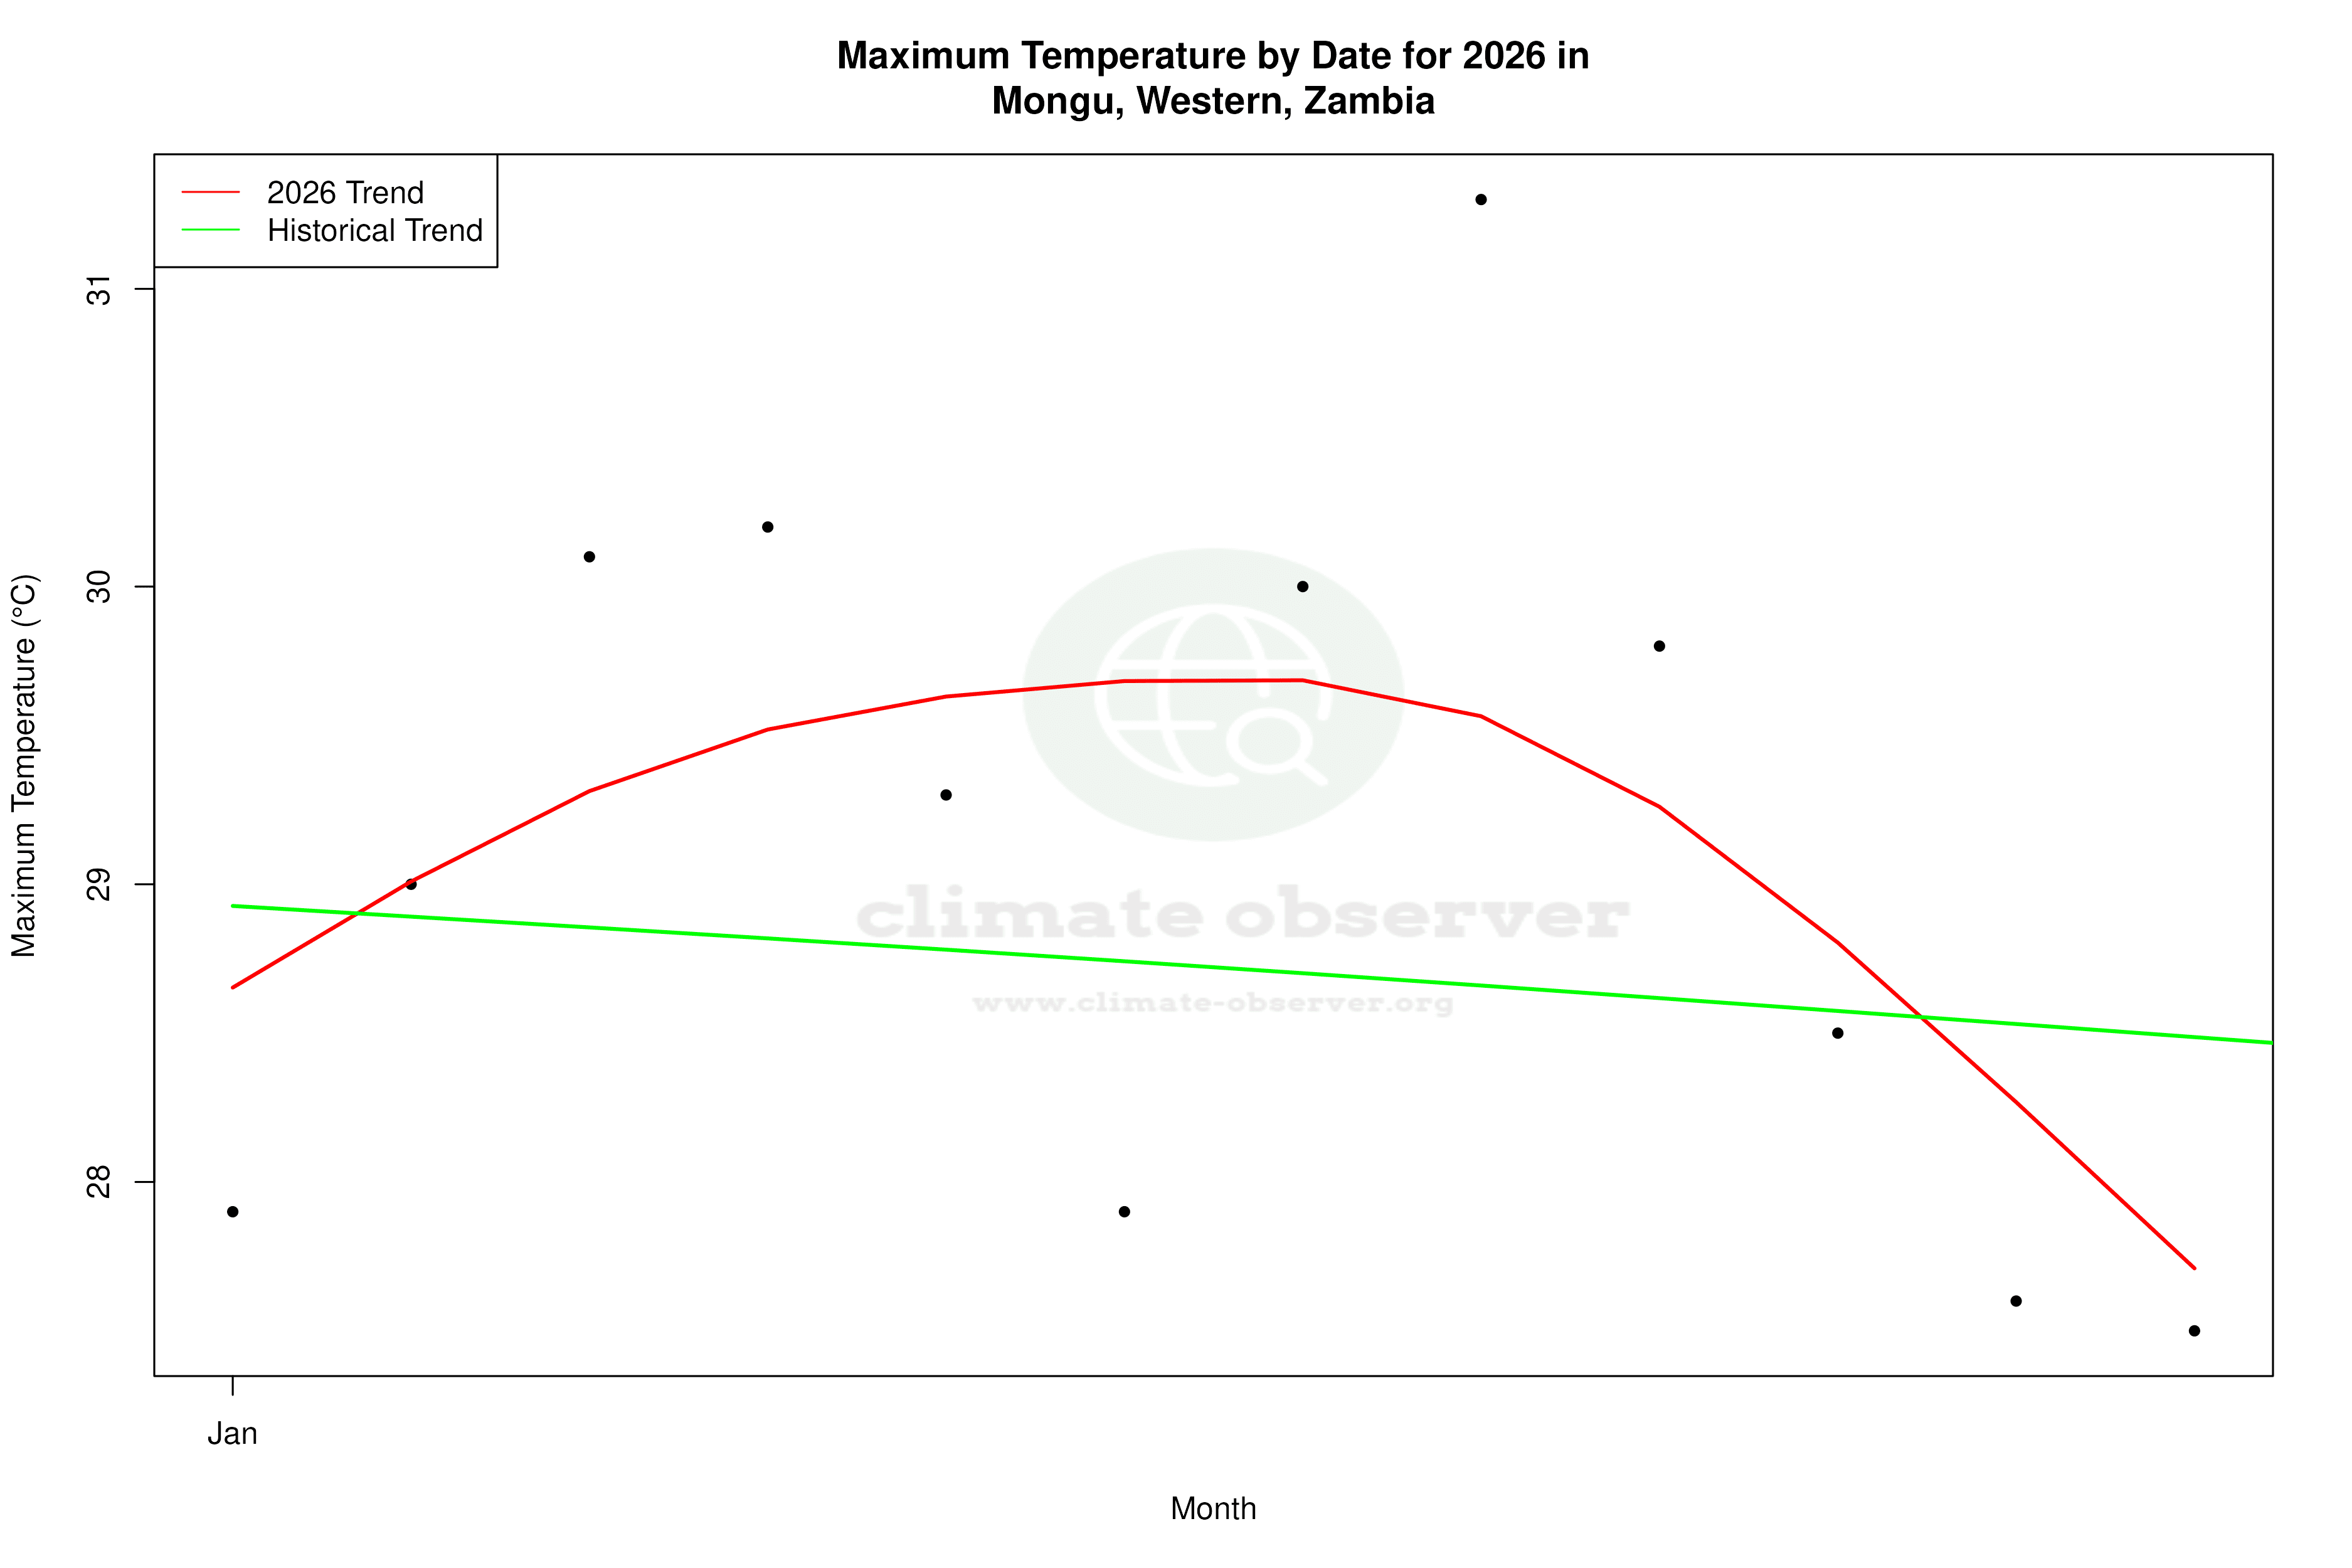


Max Temperature this Year | 1 of 6
Climate 12-Month Moving Averages


Max Temperature 12-Month MA | 1 of 6
Daily Data Points and Averages Throughout the Year


Average Max Temperature Throughout Year | 1 of 5
