Climate for Station: Broome Airport, Western Australia, Australia
Loading live weather...
Climate Analysis & Overview
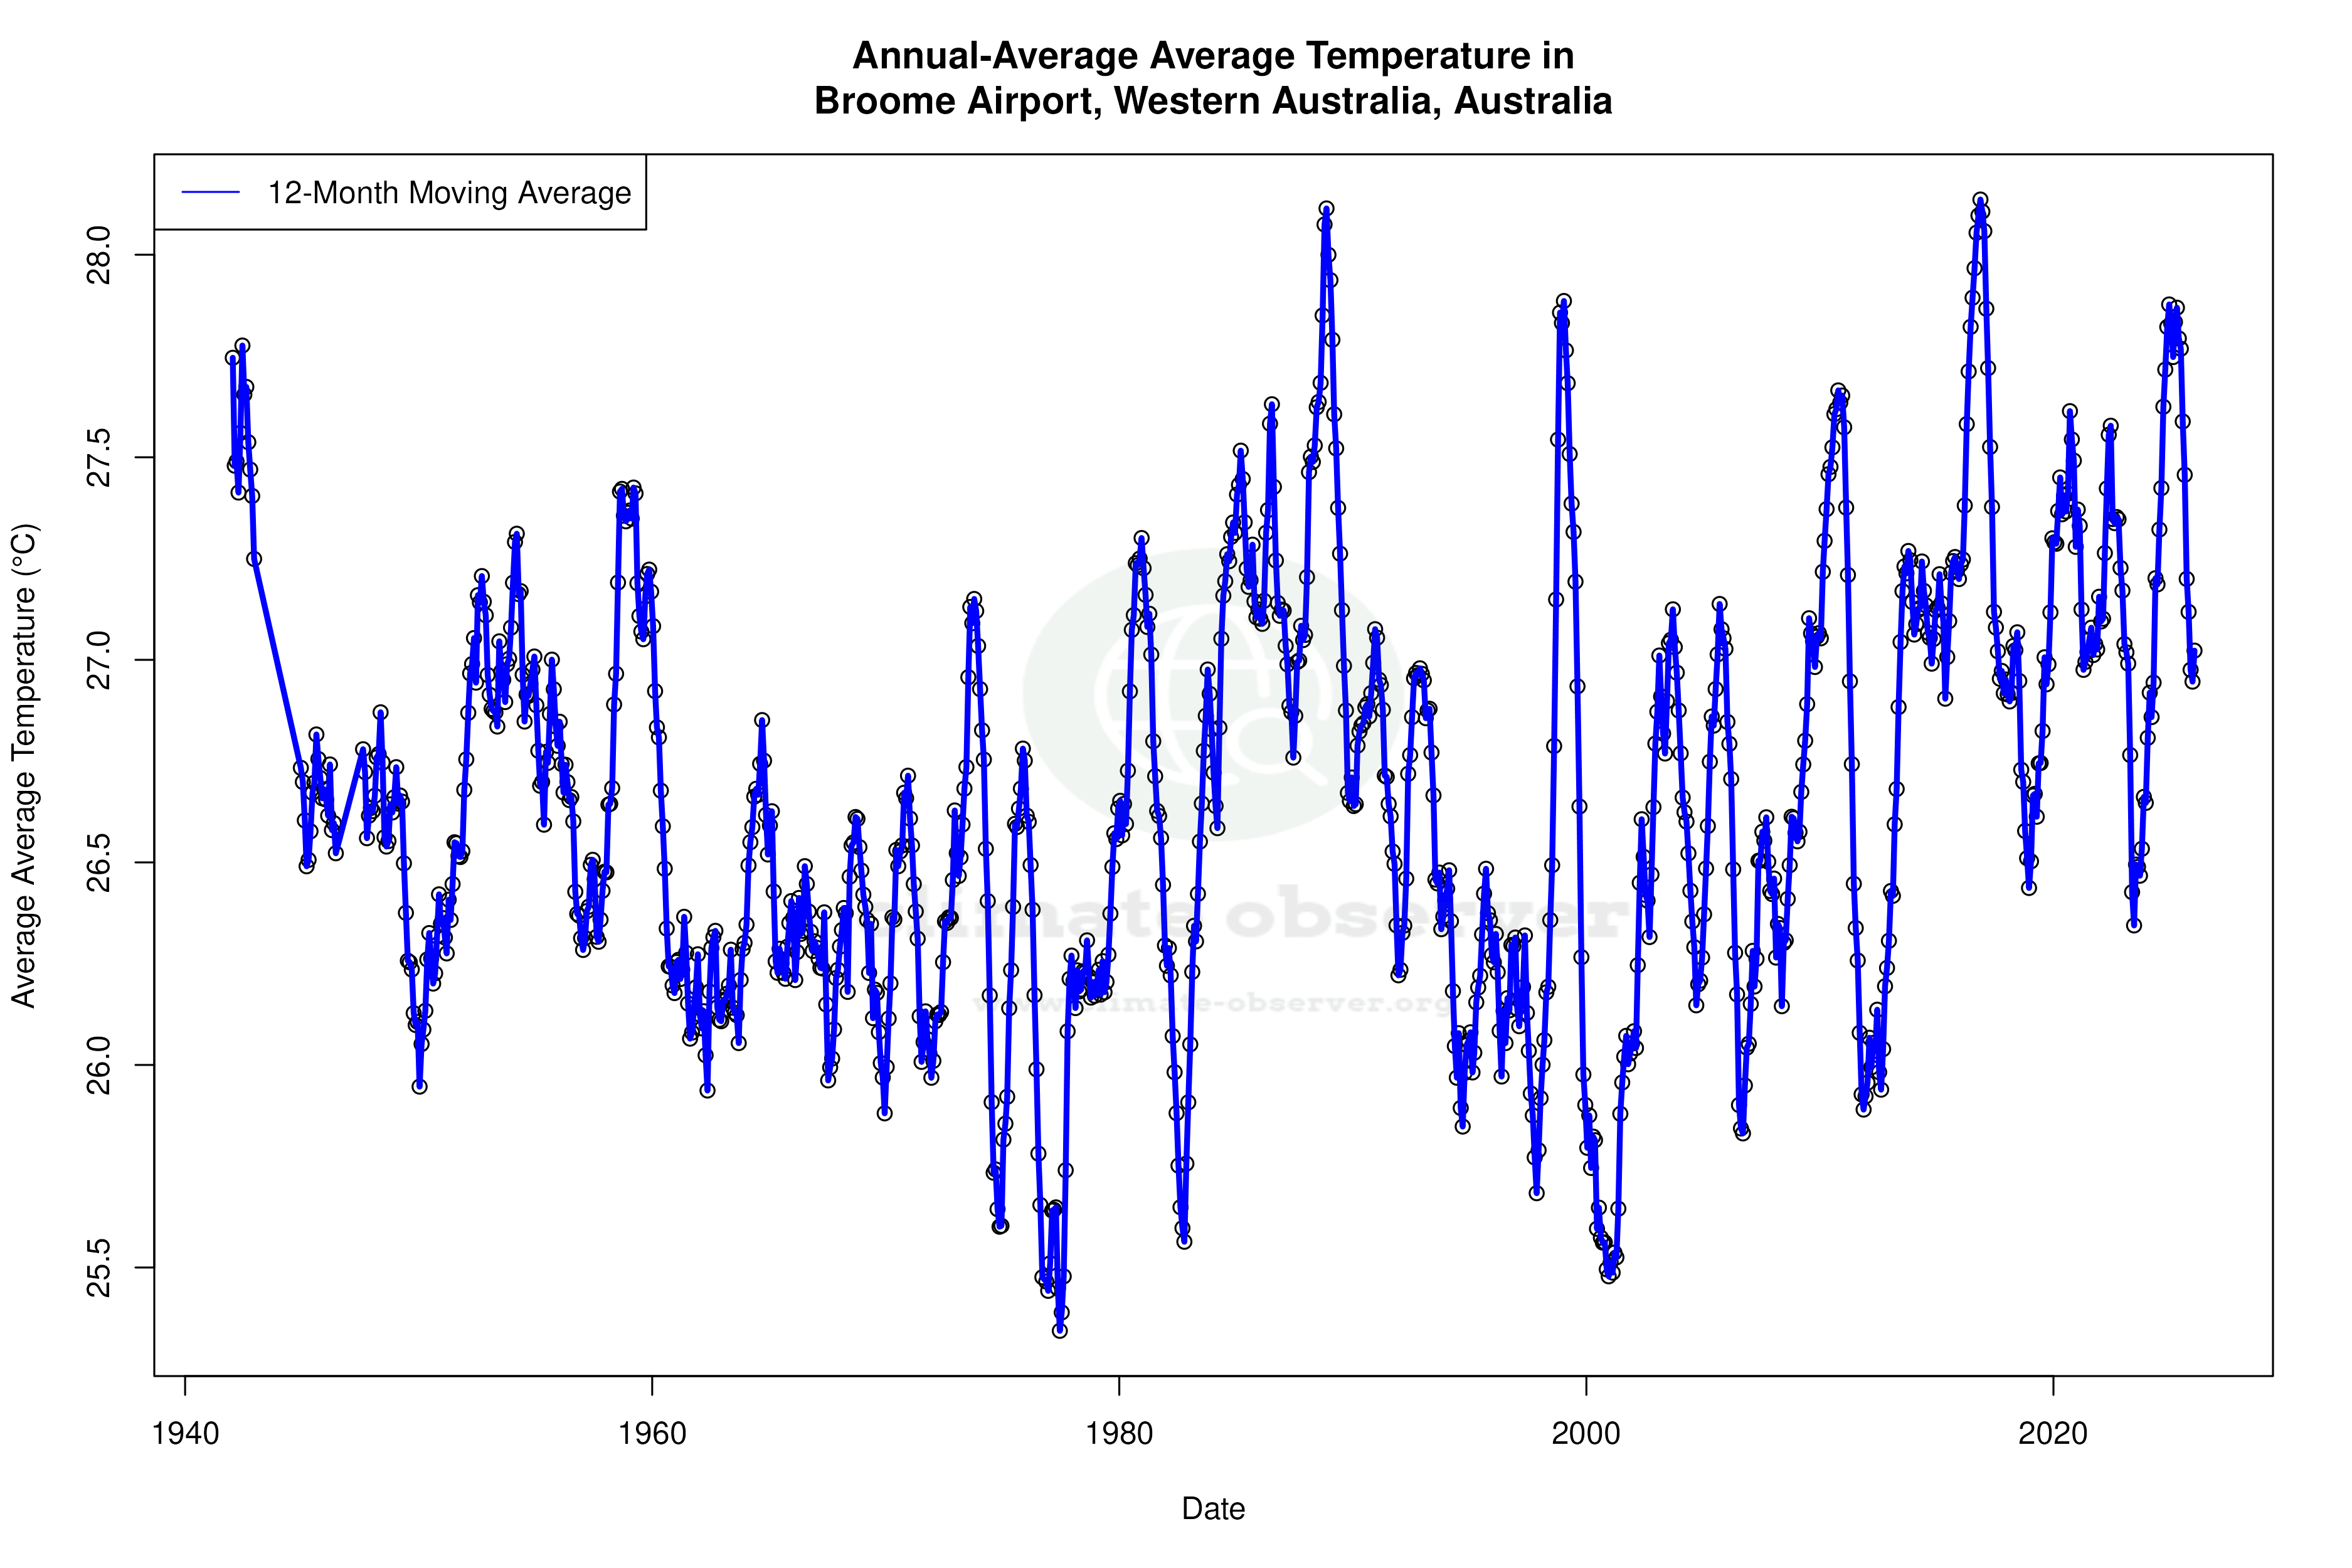
Broome Airport, located in the northwestern part of Australia, is experiencing a warming trend over the long term, with highs rising by 0.08°C (0.14°F) and lows by 0.08°C (0.14°F). However, the past decade has shown a slight cooling trend. Precipitation is becoming more evenly distributed, as indicated by a decrease in the Precipitation Concentration Index from 29.23 to 23.56.
Tropical Climate Dynamics
Broome Airport, situated at the edge of the Indian Ocean, falls under the Köppen climate classification of Aw, which denotes a tropical savanna climate. This classification is characterised by distinct wet and dry seasons, heavily influenced by monsoonal patterns. The geographical position near the coastline ensures that Broome experiences significant maritime influences, moderating extreme temperatures but also contributing to high humidity levels. The region's all-time temperature trends reveal a warming pattern, with highs increasing by 0.08°C (0.14°F) and lows by 0.08°C (0.14°F). This suggests a gradual rise in baseline temperatures over the years, aligning with broader global warming observations.
Decadal Cooling Anomaly
Interestingly, the past decade has witnessed a slight cooling trend, with highs decreasing by 0.14°C (0.25°F) and lows by 0.12°C (0.21°F). This cooling anomaly contrasts with the long-term warming trend and may be attributed to regional climatic variations or localised weather events. Such discrepancies in short-term versus long-term trends are not uncommon and highlight the complexity of climate systems. These variations underscore the importance of considering both short-term fluctuations and long-term trends in climate assessments.
Precipitation Patterns and Distribution
The Precipitation Concentration Index (PCI) provides insights into the distribution of rainfall events. A decrease from 29.23 to 23.56 indicates that precipitation in Broome is becoming more evenly distributed throughout the year. This shift suggests a reduction in the intensity and concentration of rainfall events, leading to a more balanced distribution of precipitation. Such changes can have significant implications for water resource management and agricultural planning in the region.
Temperature Extremes and Records
Broome's temperature records highlight the region's capacity for extreme weather. The highest recorded temperature is 44.6°C (112.3°F), while the lowest is 3.3°C (37.9°F). These extremes illustrate the variability inherent in Broome's climate, influenced by both its tropical location and proximity to the ocean. Such temperature ranges are critical for understanding the potential impacts of climate change on local ecosystems and human activities.
Regional Climate Goals and Considerations
Australia's commitment to reducing greenhouse gas emissions and enhancing climate resilience is a crucial backdrop for understanding Broome's climate profile. Recent weather events, such as cyclones and heatwaves, have underscored the need for adaptive strategies. The observed trends at Broome Airport, including the long-term warming and changes in precipitation distribution, provide valuable data for informing regional climate policies and initiatives.
Station Statistics
10-Year Trend
High: -0.06 °F/decade
Low: +0.76 °F/decade
Rain: +0.012 in/decade
25-Year Trend
High: +0.80 °F/decade
Low: +0.65 °F/decade
Rain: +0.002 in/decade
50-Year Trend
High: +0.35 °F/decade
Low: +0.39 °F/decade
Rain: +0.000 in/decade
All-Time Trend
High: +0.12 °F/decade
Low: +0.10 °F/decade
Rain: +0.002 in/decade
Percentage Above-Average Days
Last 12 Months: 49.9%
This Year: 44.0%
Precipitation Concentration Index (PCI) ℹ️
Last 12 Months: 34.0
Historical Average: 34.2
Percentile Rank of Last 12 Months ℹ️
High: 81st percentile
Low: 77th percentile
Rain: 80th percentile
Change in Variance ℹ️
High: -12.6%
Low: +6.2%
Intraday: +9.6%
Data Coverage
98.9%
First Year of Data
1939
Station Location
Historical Weather Records
| Max High | Avg High | Min High | Max Avg | Avg Avg | Min Avg | Max Low | Avg Low | Min Low | Max Precipitation | Avg Precipitation | Max Snow | Avg Snow | |
|---|---|---|---|---|---|---|---|---|---|---|---|---|---|
| Record | 112.28 °F | — | 62.78 °F | 95.90 °F | — | 57.02 °F | 87.62 °F | — | 37.94 °F | 13.81 in | — | — | — |
| January | 106.16 °F | 91.97 °F | 77.72 °F | 94.82 °F | 85.41 °F | 74.84 °F | 87.08 °F | 79.40 °F | 64.04 °F | 13.81 in | 0.24 in | — | — |
| February | 107.24 °F | 91.37 °F | 77.54 °F | 95.72 °F | 84.93 °F | 71.96 °F | 86.36 °F | 78.92 °F | 59.36 °F | 5.94 in | 0.24 in | — | — |
| March | 107.96 °F | 93.16 °F | 75.92 °F | 93.38 °F | 85.22 °F | 73.76 °F | 87.08 °F | 77.92 °F | 60.80 °F | 8.01 in | 0.12 in | — | — |
| April | 105.98 °F | 93.83 °F | 74.48 °F | 92.30 °F | 83.08 °F | 69.62 °F | 85.64 °F | 72.91 °F | 54.68 °F | 4.21 in | 0.02 in | — | — |
| May | 101.66 °F | 89.03 °F | 66.74 °F | 87.98 °F | 76.77 °F | 62.24 °F | 82.04 °F | 64.85 °F | 45.86 °F | 4.70 in | 0.03 in | — | — |
| June | 97.16 °F | 84.70 °F | 67.10 °F | 83.66 °F | 71.94 °F | 58.64 °F | 76.64 °F | 59.46 °F | 41.36 °F | 5.00 in | 0.02 in | — | — |
| July | 96.80 °F | 84.20 °F | 62.78 °F | 81.86 °F | 70.29 °F | 57.02 °F | 74.48 °F | 56.70 °F | 37.94 °F | 2.16 in | 0.01 in | — | — |
| August | 104.90 °F | 86.82 °F | 68.72 °F | 85.82 °F | 72.83 °F | 60.80 °F | 76.82 °F | 58.86 °F | 40.64 °F | 1.27 in | 0.00 in | — | — |
| September | 106.34 °F | 89.54 °F | 77.54 °F | 91.04 °F | 77.61 °F | 67.46 °F | 81.32 °F | 65.46 °F | 48.02 °F | 0.50 in | 0.00 in | — | — |
| October | 110.12 °F | 91.43 °F | 79.52 °F | 92.91 °F | 81.75 °F | 72.68 °F | 83.48 °F | 72.62 °F | 55.94 °F | 0.59 in | 0.00 in | — | — |
| November | 112.28 °F | 92.70 °F | 77.54 °F | 95.90 °F | 84.61 °F | 76.64 °F | 86.90 °F | 77.55 °F | 61.88 °F | 1.45 in | 0.01 in | — | — |
| December | 109.94 °F | 93.13 °F | 78.98 °F | 95.54 °F | 85.92 °F | 75.02 °F | 87.62 °F | 79.89 °F | 64.40 °F | 8.27 in | 0.07 in | — | — |
Data Visualisations
Remove WatermarksCurrent Year Climate Trends vs Historical


Max Temperature this Year | 1 of 6
Climate 12-Month Moving Averages


Max Temperature 12-Month MA | 1 of 6
Daily Data Points and Averages Throughout the Year


Average Max Temperature Throughout Year | 1 of 5
