Climate for Station: Geraldton Airport, Western Australia, Australia
Loading live weather...
Climate Analysis & Overview
Geraldton Airport, located in Western Australia's semi-arid region, is experiencing a warming trend, with notable increases in both high and low temperatures over the past decade. The precipitation pattern is becoming slightly more even, a subtle but important shift for local agriculture and water management.
Thermal Trends in Geraldton
Geraldton Airport sits within a semi-arid climate zone, characterised by hot summers and mild winters. Recent data indicates a warming trend in both high and low temperatures. Over the past decade, high temperatures have risen by 1.29°C (2.32°F), while low temperatures have increased by 1.12°C (2.01°F). These trends are more pronounced than the all-time increases, where highs have risen by 0.18°C (0.32°F) and lows by 0.06°C (0.11°F). This suggests a recent acceleration in temperature changes, which could have implications for local ecosystems and human activities.
Record Extremes
The recorded temperature extremes at Geraldton Airport highlight the region's climatic variability. The highest temperature on record is 49.3°C (120.7°F), while the lowest is -0.4°C (31.3°F). These extremes underscore the challenges of managing resources and infrastructure in a region subject to significant thermal oscillations.
Precipitation Patterns and Distribution
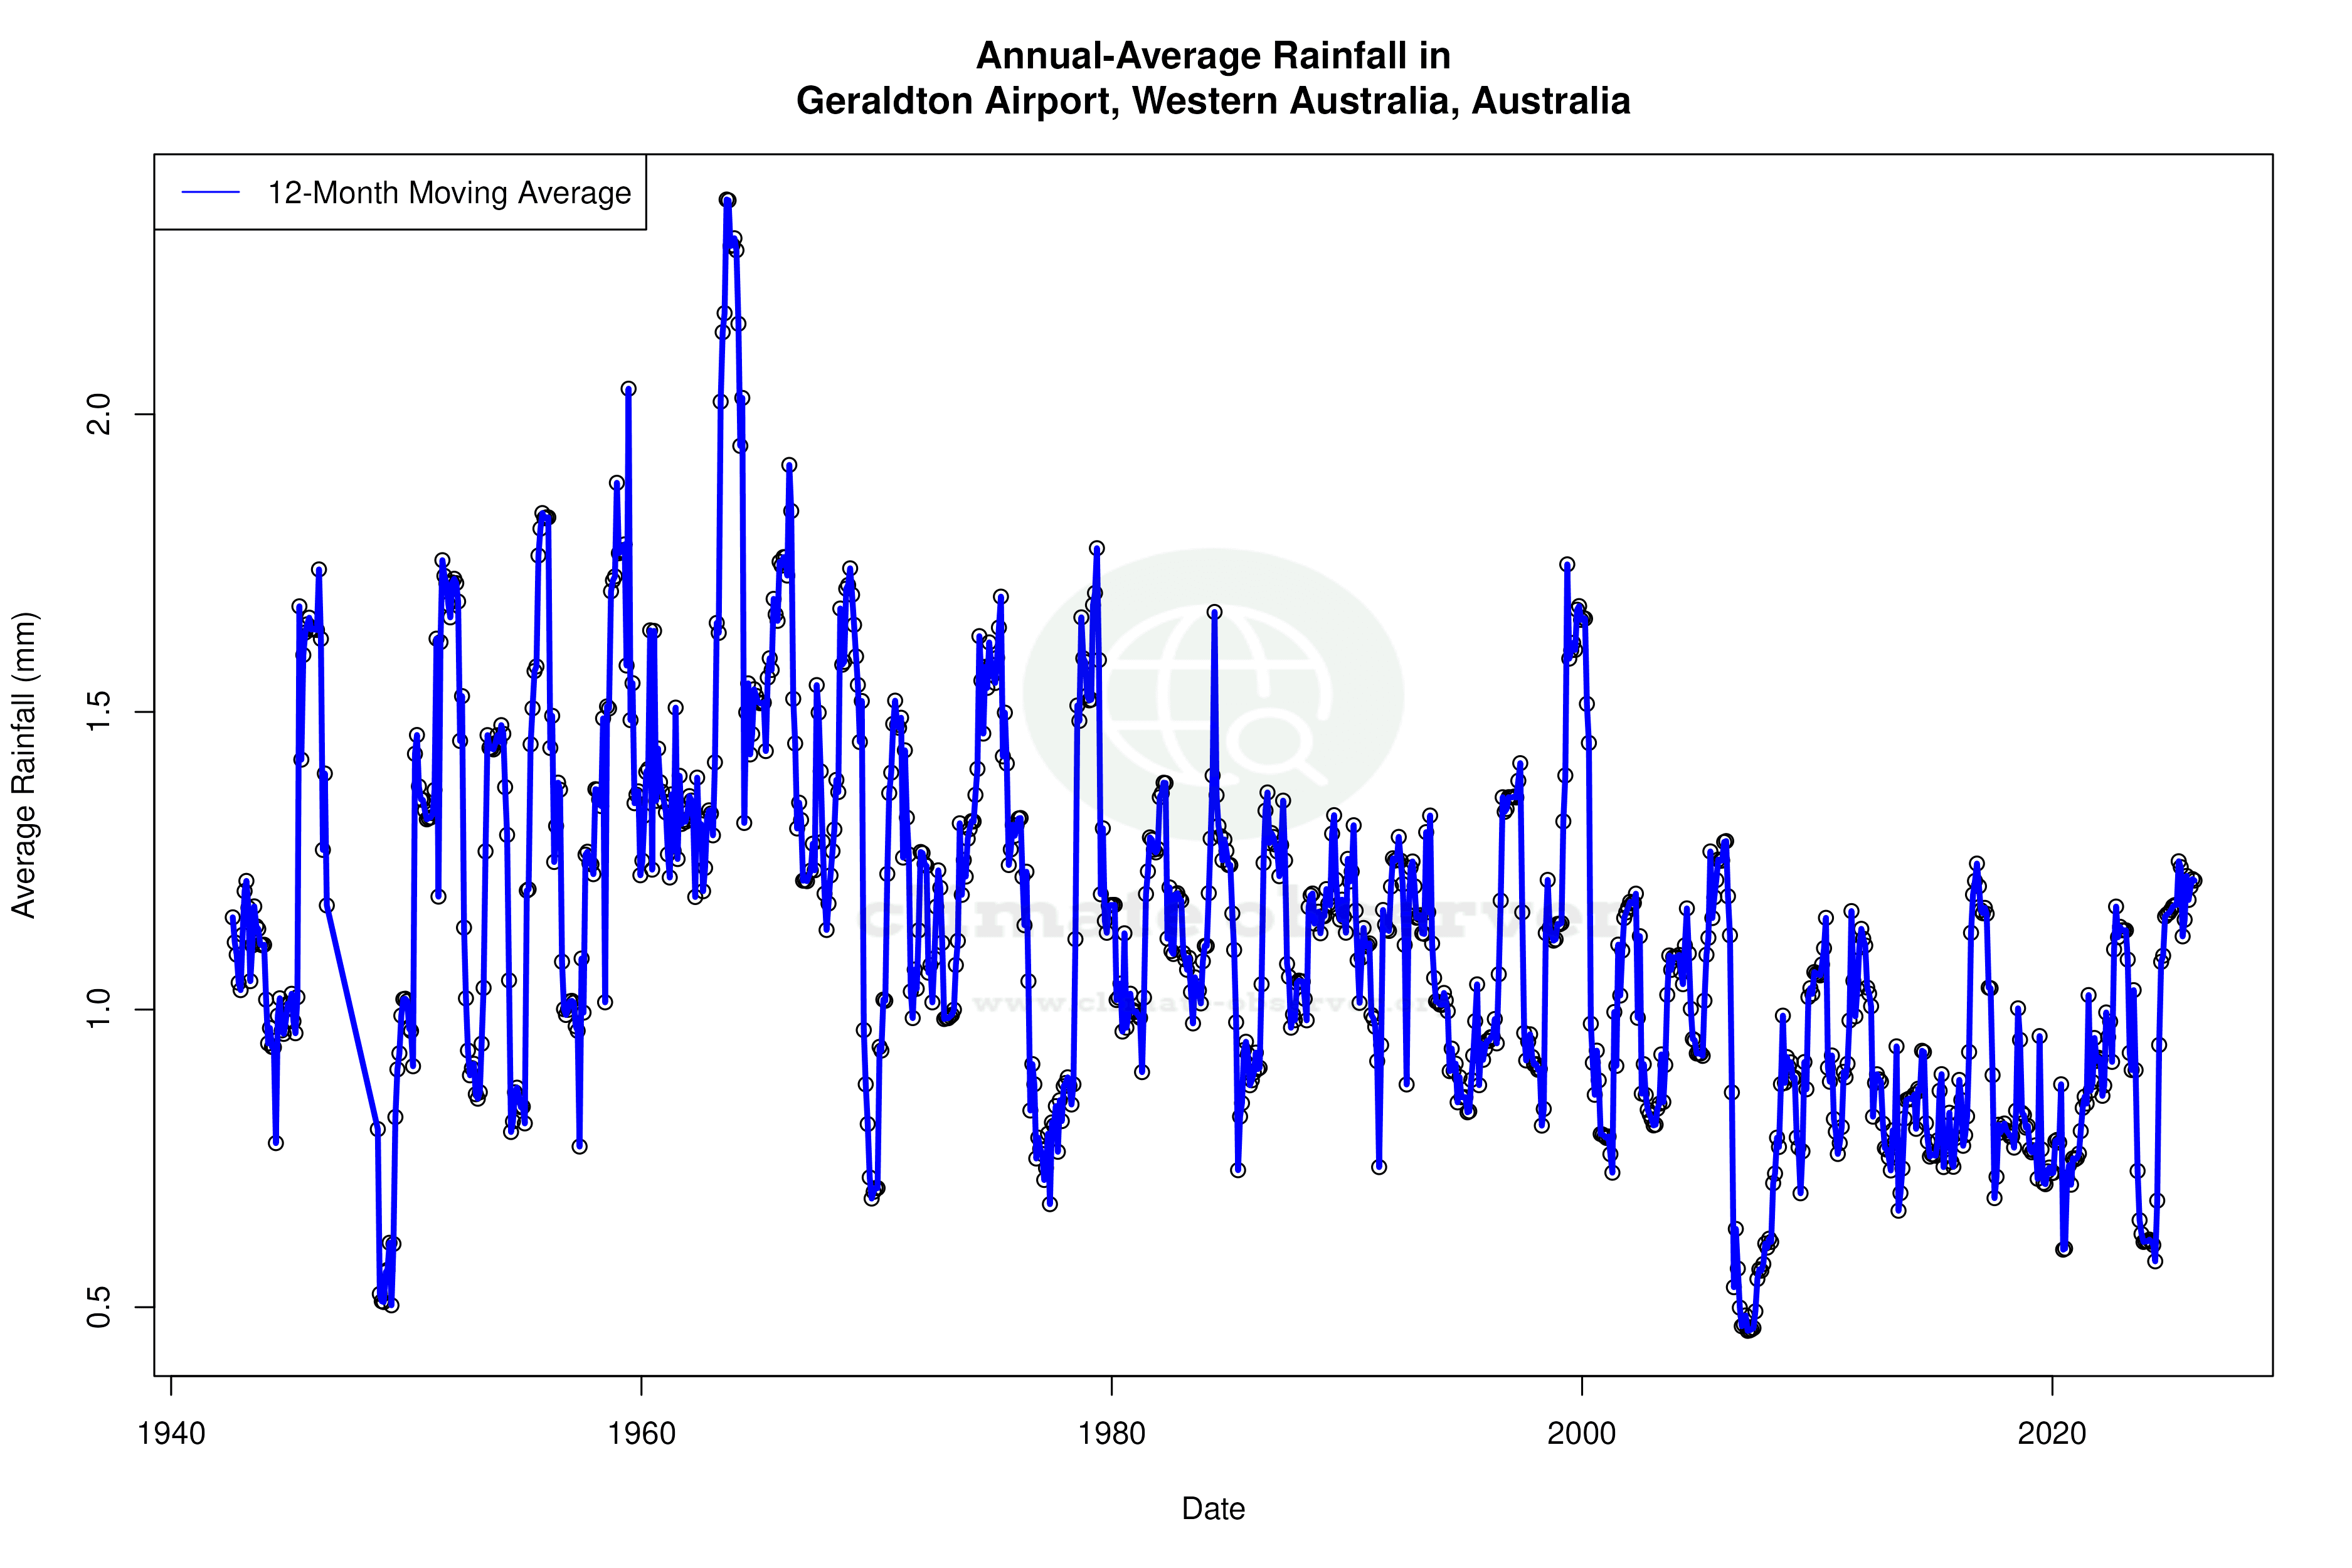
The Precipitation Concentration Index (PCI) at Geraldton Airport has seen a slight decrease from a baseline of 18.81 to the current value of 17.66. This indicates a marginal shift towards more evenly distributed rainfall events. While not a dramatic change, this trend could offer some relief in terms of water availability and agricultural planning, as more evenly distributed precipitation can mitigate the impacts of prolonged dry spells.
Geographic and Climatic Influences
Situated near the Indian Ocean, Geraldton's climate is influenced by both maritime and continental factors. The ocean moderates temperature extremes, yet the inland desert exerts a drying influence. This unique geographic positioning contributes to the area's semi-arid climate classification. The recent warming trends align with broader regional patterns observed across Australia, where climate goals focus on mitigating temperature increases and adapting to shifting precipitation patterns.
Implications for Regional Climate Goals
Australia's climate strategy aims to address these warming trends by implementing sustainable practices and investing in renewable energy. The data from Geraldton Airport reflects the broader challenges faced by the nation, illustrating the need for adaptive strategies in agriculture, water management, and urban planning to cope with the ongoing climatic changes.
Station Statistics
10-Year Trend
High: +2.68 °F/decade
Low: +2.83 °F/decade
Rain: +0.006 in/decade
25-Year Trend
High: +0.94 °F/decade
Low: +0.45 °F/decade
Rain: -0.001 in/decade
50-Year Trend
High: +0.41 °F/decade
Low: +0.11 °F/decade
Rain: -0.003 in/decade
All-Time Trend
High: +0.32 °F/decade
Low: +0.13 °F/decade
Rain: -0.003 in/decade
Percentage Above-Average Days
Last 12 Months: 43.0%
This Year: 47.2%
Precipitation Concentration Index (PCI) ℹ️
Last 12 Months: 14.3
Historical Average: 19.9
Percentile Rank of Last 12 Months ℹ️
High: 81st percentile
Low: 83rd percentile
Rain: 71st percentile
Change in Variance ℹ️
High: +3.4%
Low: +11.2%
Intraday: +5.8%
Data Coverage
97.8%
First Year of Data
1941
Station Location
Historical Weather Records
| Max High | Avg High | Min High | Max Avg | Avg Avg | Min Avg | Max Low | Avg Low | Min Low | Max Precipitation | Avg Precipitation | Max Snow | Avg Snow | |
|---|---|---|---|---|---|---|---|---|---|---|---|---|---|
| Record | 120.74 °F | — | 55.83 °F | 101.66 °F | — | 45.14 °F | 89.96 °F | — | 31.28 °F | 4.30 in | — | — | — |
| January | 120.74 °F | 89.23 °F | 70.70 °F | 101.66 °F | 76.64 °F | 63.32 °F | 85.64 °F | 65.19 °F | 48.92 °F | 1.73 in | 0.01 in | — | — |
| February | 120.74 °F | 90.79 °F | 71.06 °F | 100.04 °F | 77.88 °F | 62.78 °F | 86.54 °F | 66.60 °F | 50.00 °F | 2.70 in | 0.01 in | — | — |
| March | 113.36 °F | 88.15 °F | 65.30 °F | 99.86 °F | 75.52 °F | 60.80 °F | 89.96 °F | 64.47 °F | 47.84 °F | 3.48 in | 0.01 in | — | — |
| April | 104.90 °F | 82.16 °F | 66.02 °F | 89.24 °F | 70.25 °F | 55.58 °F | 79.88 °F | 59.80 °F | 42.98 °F | 1.88 in | 0.03 in | — | — |
| May | 97.88 °F | 75.76 °F | 57.74 °F | 82.58 °F | 64.46 °F | 50.36 °F | 73.94 °F | 54.99 °F | 33.98 °F | 2.81 in | 0.08 in | — | — |
| June | 85.28 °F | 69.82 °F | 55.94 °F | 71.96 °F | 59.86 °F | 46.22 °F | 66.56 °F | 51.46 °F | 32.90 °F | 4.30 in | 0.12 in | — | — |
| July | 84.20 °F | 67.36 °F | 56.48 °F | 73.04 °F | 57.40 °F | 45.14 °F | 64.58 °F | 48.68 °F | 31.28 °F | 2.83 in | 0.11 in | — | — |
| August | 89.60 °F | 68.41 °F | 55.83 °F | 71.78 °F | 57.69 °F | 46.94 °F | 63.32 °F | 47.89 °F | 34.16 °F | 2.32 in | 0.08 in | — | — |
| September | 96.98 °F | 71.98 °F | 57.96 °F | 79.52 °F | 60.13 °F | 48.38 °F | 66.38 °F | 48.47 °F | 34.16 °F | 1.52 in | 0.04 in | — | — |
| October | 106.34 °F | 76.44 °F | 57.56 °F | 86.54 °F | 64.25 °F | 48.02 °F | 73.40 °F | 51.77 °F | 36.32 °F | 2.80 in | 0.02 in | — | — |
| November | 110.84 °F | 81.19 °F | 61.86 °F | 91.58 °F | 69.23 °F | 56.30 °F | 78.44 °F | 57.13 °F | 38.84 °F | 0.90 in | 0.01 in | — | — |
| December | 116.24 °F | 85.58 °F | 69.80 °F | 99.50 °F | 73.32 °F | 58.82 °F | 79.70 °F | 61.58 °F | 45.86 °F | 2.02 in | 0.01 in | — | — |
Data Visualisations
Remove WatermarksCurrent Year Climate Trends vs Historical


Max Temperature this Year | 1 of 6
Climate 12-Month Moving Averages


Max Temperature 12-Month MA | 1 of 6
Daily Data Points and Averages Throughout the Year


Average Max Temperature Throughout Year | 1 of 5
