Climate for Station: Santarem-Aeroporto, Para, Brazil
Loading live weather...
Climate Analysis & Overview
Santarém-Aeroporto's climate profile reveals a juxtaposition of warming and cooling trends, with a notable shift towards more evenly distributed rainfall. The region's all-time temperature trends suggest a warming of 0.12°C (0.22°F) for highs and a cooling of 0.25°C (0.45°F) for lows, while recent 10-year data indicates a slight cooling in highs and warming in lows. These dynamics are set against the backdrop of Brazil's commitment to sustainable climate policies.
Equatorial Climate Dynamics
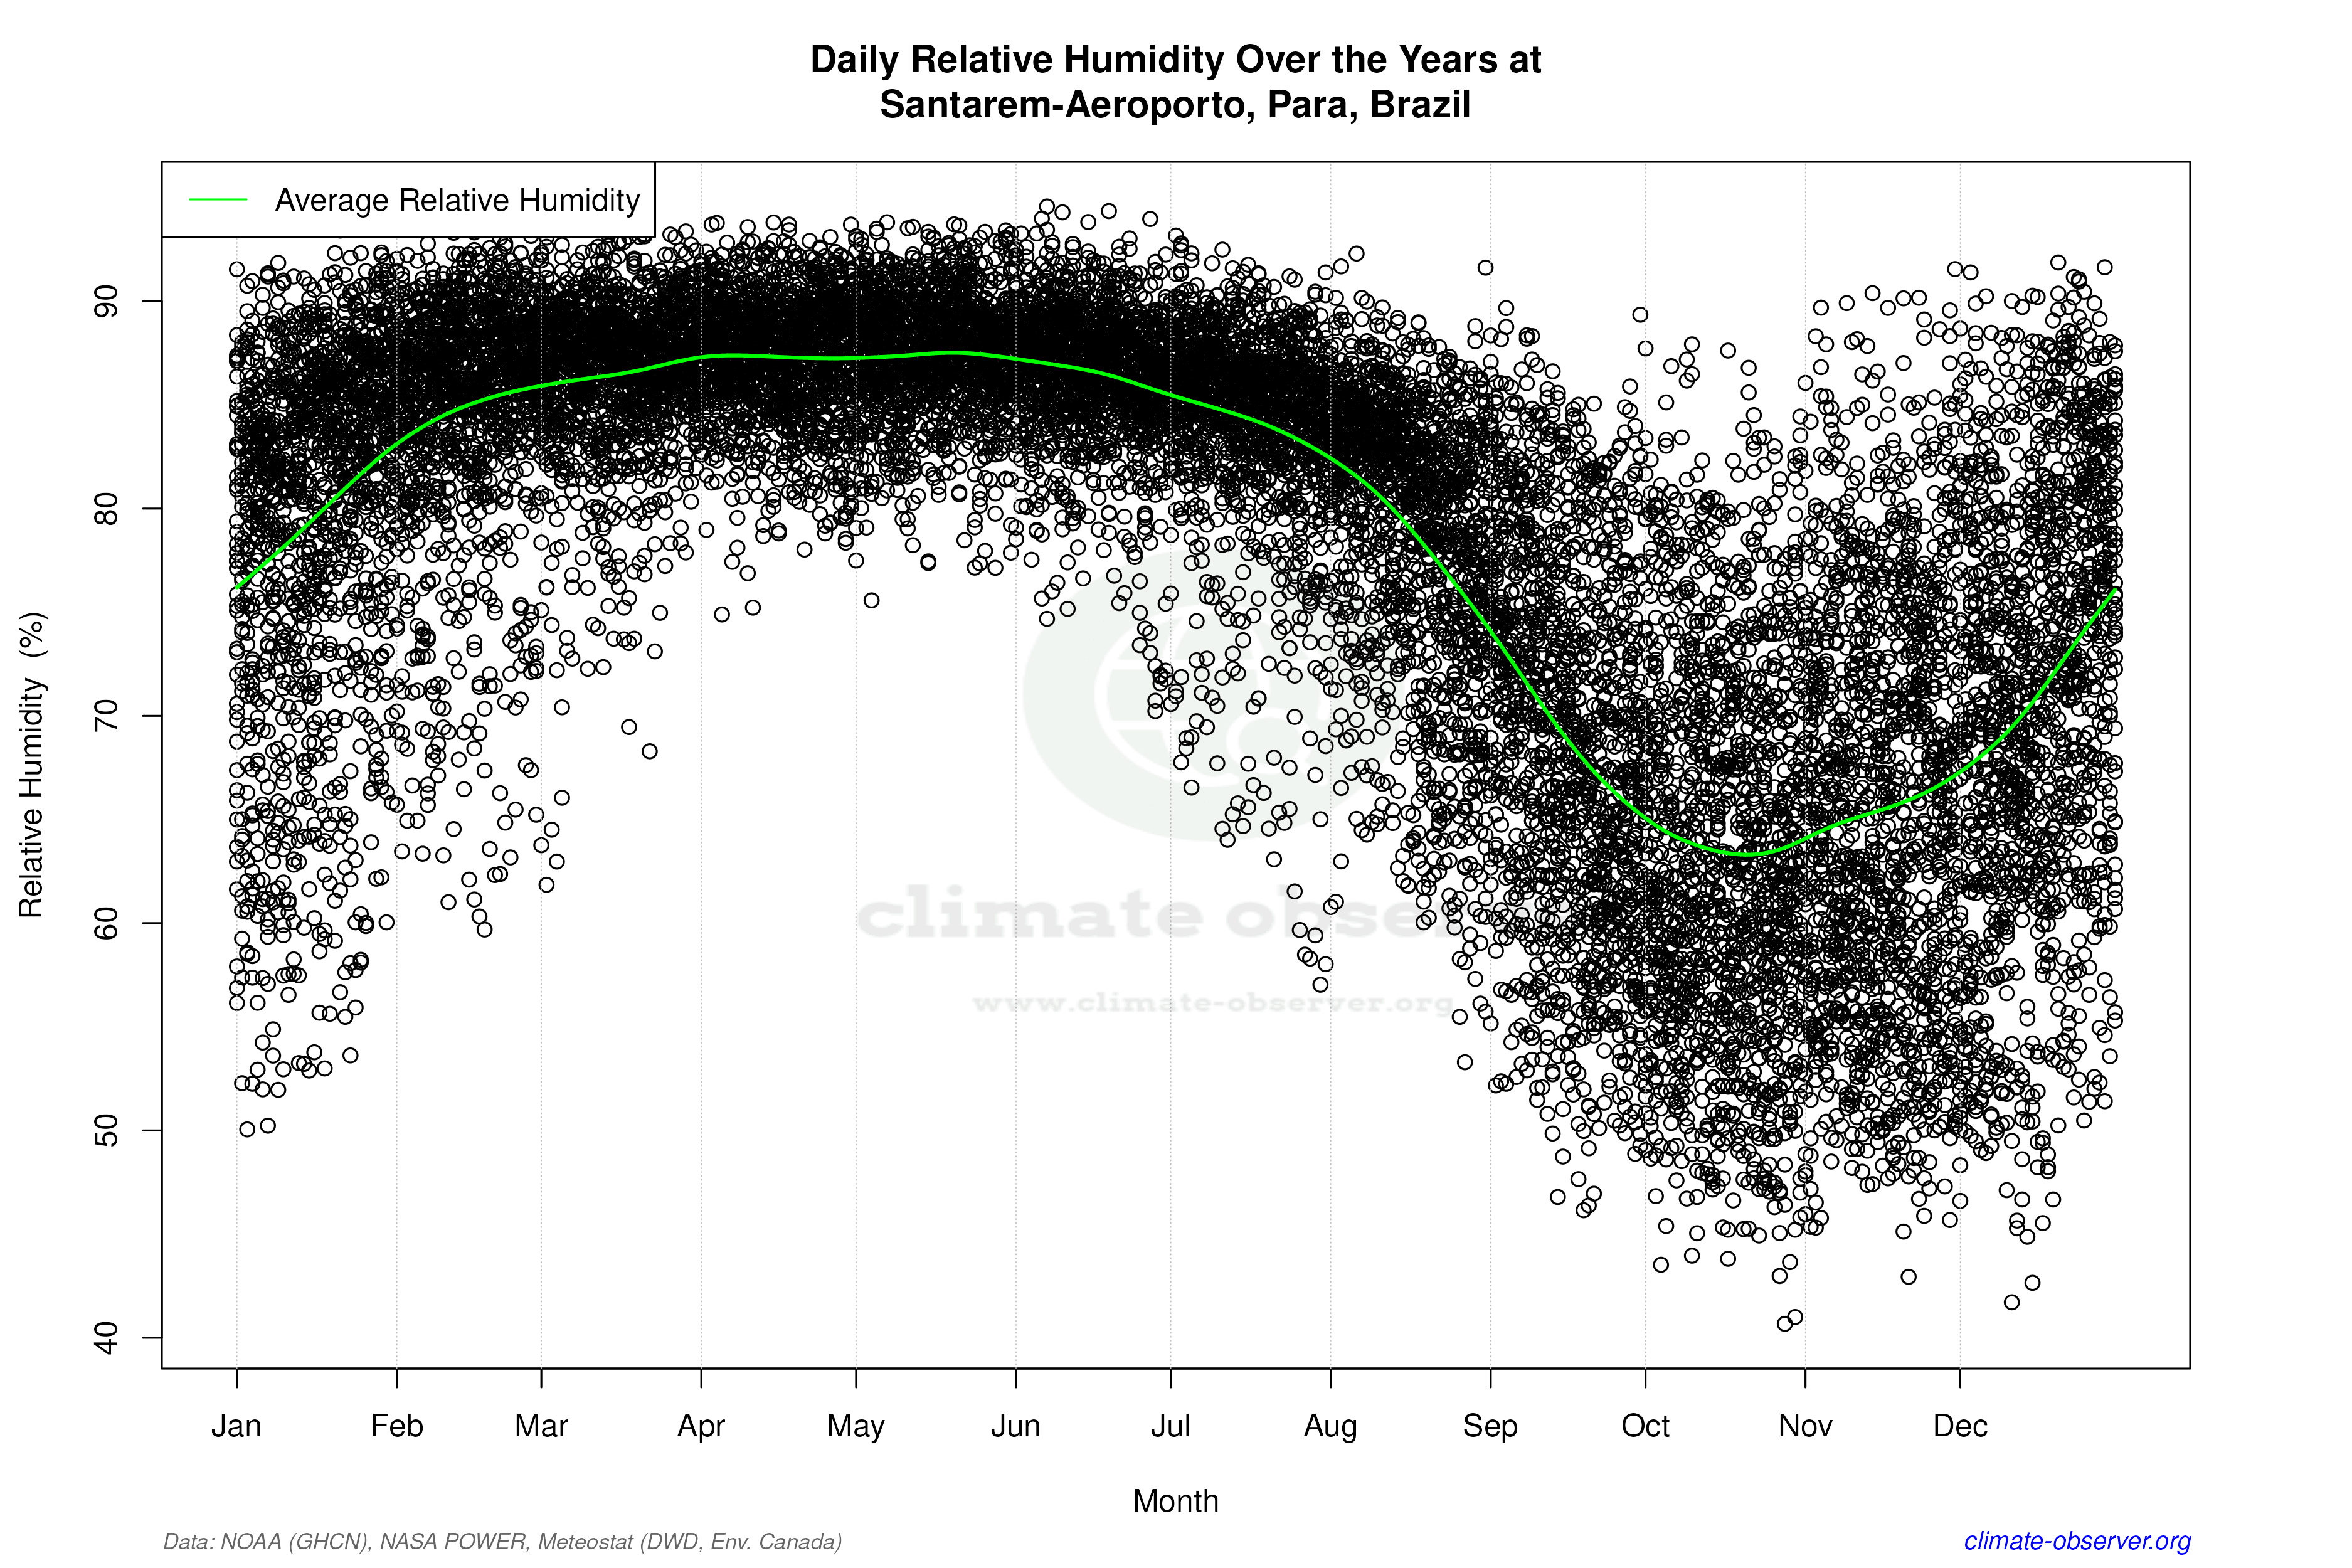
Santarém-Aeroporto is nestled in the heart of the Amazon, characterised by its equatorial climate (Af in the Köppen classification), marked by high humidity and significant rainfall throughout the year. The Amazon River's proximity plays a crucial role in moderating temperatures and influencing humidity levels. The all-time temperature trends show a warming of 0.12°C (0.22°F) for high temperatures, suggesting a gradual rise in daytime heat over the years. Conversely, the lows have experienced a cooling trend of 0.25°C (0.45°F), indicating cooler nights, which could be attributed to changes in cloud cover or localised atmospheric conditions.
Recent Temperature Fluctuations
Examining the past decade, Santarém-Aeroporto has experienced a slight cooling trend in high temperatures, with a decrease of 0.16°C (0.29°F). In contrast, the low temperatures have shown a warming trend of 0.15°C (0.27°F). This divergence from the all-time trends could reflect short-term climatic variability or regional weather patterns. Such fluctuations are essential for understanding the broader implications of climate change on local ecosystems and human activities.
Rainfall Redistribution
The Precipitation Concentration Index (PCI) has seen a significant decrease from a baseline of 13.70 to a current value of 9.90. This change indicates that rainfall is now more evenly distributed throughout the year, reducing the likelihood of intense, concentrated rainfall events. A PCI below 10 suggests a very even distribution, which can mitigate the risks of flooding and soil erosion, benefiting agriculture and local communities.
Temperature Extremes and Records
Santarém-Aeroporto's climate extremes are defined by a record high of 39.0°C (102.2°F) and a record low of 17.0°C (62.6°F). These extremes underscore the region's capacity for significant thermal variation, despite its equatorial location. Such records are crucial for assessing the resilience of local infrastructure and ecosystems to temperature extremes.
Regional Climate Initiatives
Brazil's regional climate goals, aimed at reducing deforestation and promoting sustainable land use, provide a critical context for Santarém-Aeroporto's climate profile. The observed changes in temperature and precipitation patterns align with broader national efforts to adapt to and mitigate the impacts of climate change. Understanding these localised trends is vital for informing policy decisions and fostering resilience in the face of ongoing environmental challenges.
Station Statistics
10-Year Trend
High: -0.13 °F/decade
Low: +0.73 °F/decade
Rain: +0.089 in/decade
25-Year Trend
High: -0.00 °F/decade
Low: -0.56 °F/decade
Rain: +0.005 in/decade
50-Year Trend
High: +0.21 °F/decade
Low: -0.43 °F/decade
Rain: -0.004 in/decade
All-Time Trend
High: +0.21 °F/decade
Low: -0.43 °F/decade
Rain: -0.010 in/decade
Percentage Above-Average Days
Last 12 Months: 38.9%
This Year: 28.0%
Precipitation Concentration Index (PCI) ℹ️
Last 12 Months: 11.3
Historical Average: 13.8
Percentile Rank of Last 12 Months ℹ️
High: 42nd percentile
Low: 47th percentile
Rain: 62nd percentile
Change in Variance ℹ️
High: -22.3%
Low: -18.7%
Intraday: -19.2%
Data Coverage
87.6%
First Year of Data
1968
Station Location
Historical Weather Records
| Max High | Avg High | Min High | Max Avg | Avg Avg | Min Avg | Max Low | Avg Low | Min Low | Max Precipitation | Avg Precipitation | Max Snow | Avg Snow | |
|---|---|---|---|---|---|---|---|---|---|---|---|---|---|
| Record | 102.20 °F | — | 75.20 °F | 90.86 °F | — | 71.96 °F | 87.46 °F | — | 62.60 °F | 7.09 in | — | — | — |
| January | 96.80 °F | 86.90 °F | 75.20 °F | 87.98 °F | 81.03 °F | 71.96 °F | 85.14 °F | 75.79 °F | 68.00 °F | 5.47 in | 0.31 in | — | — |
| February | 96.80 °F | 85.68 °F | 75.20 °F | 87.44 °F | 80.23 °F | 72.86 °F | 82.40 °F | 75.37 °F | 68.36 °F | 6.67 in | 0.43 in | — | — |
| March | 96.80 °F | 85.52 °F | 76.44 °F | 86.36 °F | 80.21 °F | 72.86 °F | 82.40 °F | 75.42 °F | 69.80 °F | 7.09 in | 0.49 in | — | — |
| April | 93.20 °F | 85.52 °F | 77.41 °F | 88.16 °F | 80.34 °F | 73.58 °F | 82.40 °F | 75.45 °F | 69.80 °F | 6.40 in | 0.47 in | — | — |
| May | 93.20 °F | 85.69 °F | 75.81 °F | 87.80 °F | 80.51 °F | 74.12 °F | 80.60 °F | 75.42 °F | 69.62 °F | 5.63 in | 0.35 in | — | — |
| June | 93.38 °F | 86.21 °F | 76.60 °F | 88.16 °F | 80.56 °F | 73.22 °F | 79.88 °F | 74.77 °F | 67.10 °F | 4.65 in | 0.18 in | — | — |
| July | 95.07 °F | 87.06 °F | 77.34 °F | 87.26 °F | 80.73 °F | 73.58 °F | 80.92 °F | 74.29 °F | 68.00 °F | 2.94 in | 0.12 in | — | — |
| August | 96.73 °F | 89.06 °F | 77.61 °F | 88.16 °F | 82.35 °F | 74.84 °F | 81.05 °F | 75.31 °F | 62.60 °F | 2.80 in | 0.07 in | — | — |
| September | 98.71 °F | 91.02 °F | 77.74 °F | 90.14 °F | 83.92 °F | 75.92 °F | 83.98 °F | 76.99 °F | 67.82 °F | 1.63 in | 0.05 in | — | — |
| October | 100.72 °F | 91.92 °F | 80.29 °F | 90.55 °F | 84.20 °F | 75.38 °F | 86.45 °F | 77.47 °F | 69.08 °F | 4.57 in | 0.06 in | — | — |
| November | 102.20 °F | 90.98 °F | 77.00 °F | 90.86 °F | 83.72 °F | 75.20 °F | 87.46 °F | 77.14 °F | 68.00 °F | 5.43 in | 0.10 in | — | — |
| December | 97.61 °F | 89.40 °F | 77.00 °F | 89.78 °F | 82.71 °F | 74.66 °F | 86.25 °F | 76.94 °F | 69.08 °F | 5.45 in | 0.19 in | — | — |
Data Visualisations
Remove WatermarksCurrent Year Climate Trends vs Historical


Max Temperature this Year | 1 of 6
Climate 12-Month Moving Averages


Max Temperature 12-Month MA | 1 of 6
Daily Data Points and Averages Throughout the Year


Average Max Temperature Throughout Year | 1 of 5
