Climate for Station: Berlin-Dahlem, Berlin, Germany
Loading live weather...
Climate Analysis & Overview
Berlin-Dahlem is experiencing a warming trend, with notable increases in both high and low temperatures over the past decade. Precipitation events are becoming slightly more concentrated, indicating shifts in local climate patterns. These changes align with Germany's broader climate goals to mitigate warming impacts.
Köppen Climate Context
Berlin-Dahlem, situated at the coordinates 52.4639, 13.3017, falls under the Köppen climate classification of Cfb, indicating a temperate oceanic climate. This classification is characterised by moderate temperature variations and relatively even precipitation throughout the year. The local geography, marked by its urban setting with a mix of green spaces, influences the microclimate by moderating temperature extremes and affecting precipitation patterns.
Decadal Thermal Dynamics
Over the last decade, Berlin-Dahlem has experienced a noticeable warming trend. High temperatures have risen by 0.92°C (1.66°F), while low temperatures have increased by 0.62°C (1.12°F). These changes suggest a shift towards warmer conditions, potentially impacting local ecosystems and energy demands. This recent trend contrasts with the more modest all-time warming, where high temperatures have increased by 0.12°C (0.22°F) and lows by 0.05°C (0.09°F). The accelerated warming in the past decade could be indicative of more immediate climatic shifts.
Precipitation Patterns and Concentration
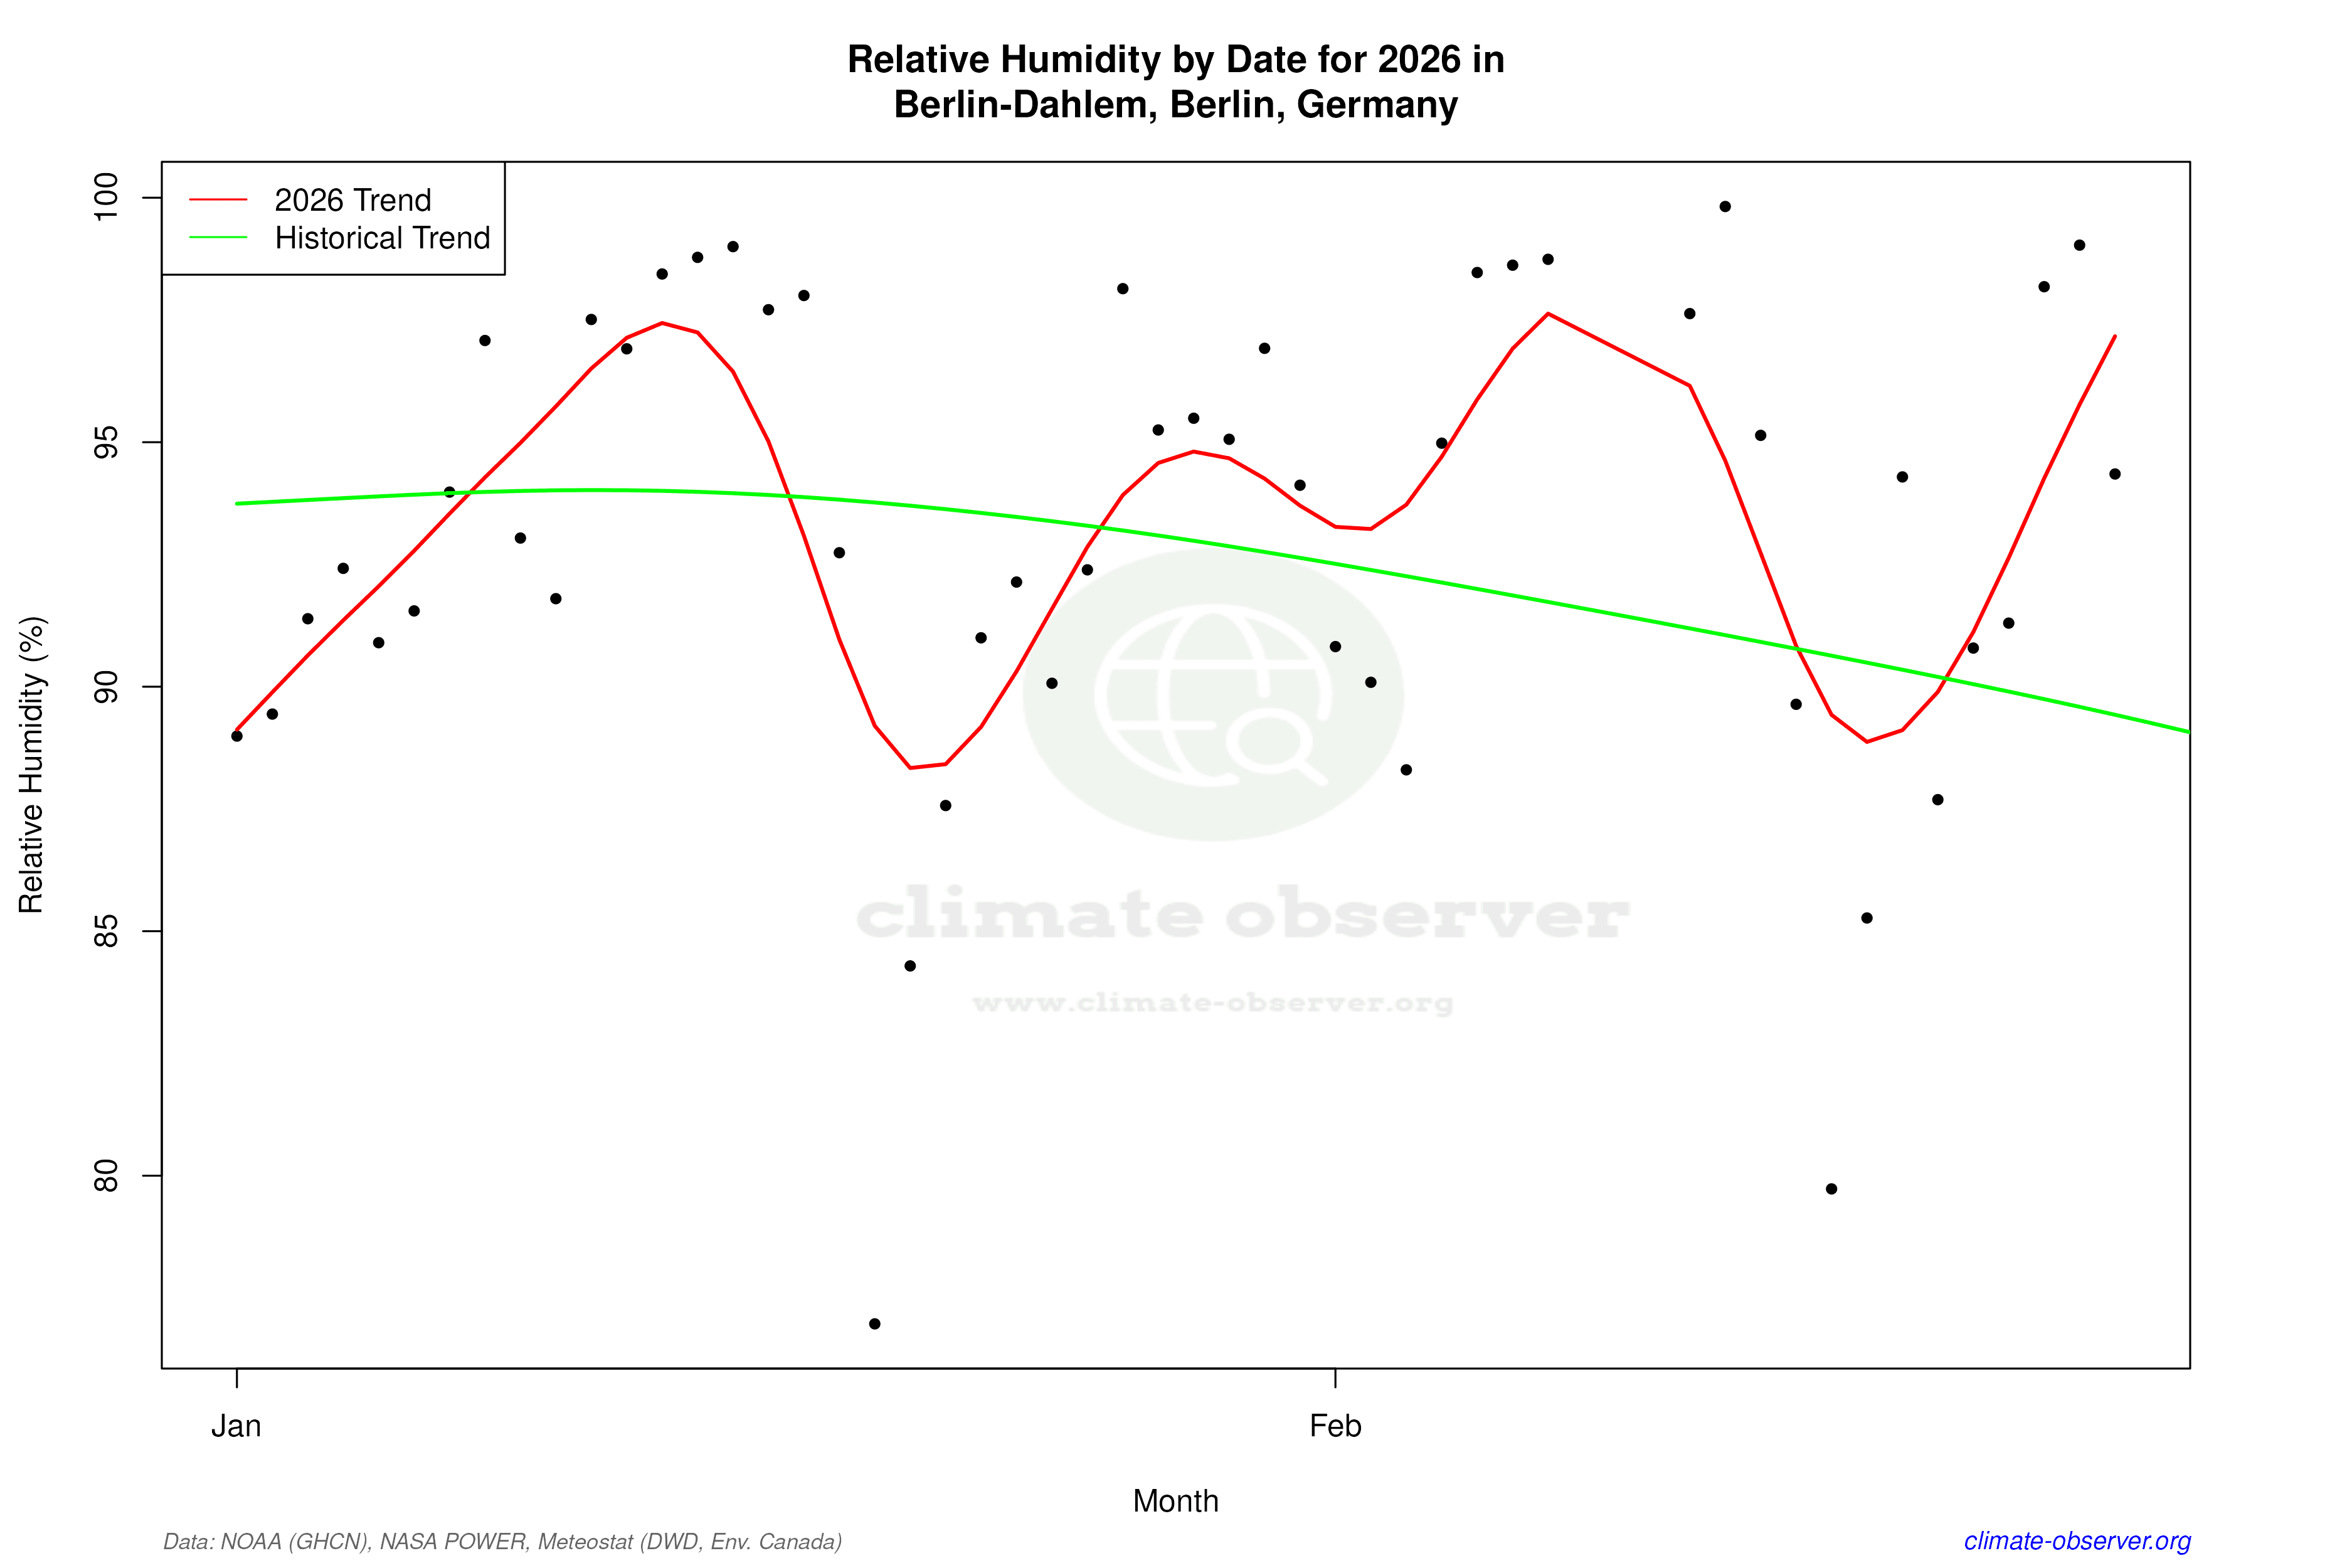
The Precipitation Concentration Index (PCI) for Berlin-Dahlem has shown a slight increase from a baseline of 11.26 to a current value of 12.09. This indicates that precipitation is becoming slightly more concentrated in fewer, more intense events. While not yet highly concentrated, this trend could lead to more frequent flooding events or periods of drought, affecting agriculture and water management in the region.
Extreme Temperature Records
Berlin-Dahlem's historical temperature records reveal an absolute maximum of 37.9°C (100.2°F) and a minimum of -23.1°C (-9.6°F). These extremes highlight the potential for significant temperature variability, which can pose challenges for infrastructure and public health. Understanding these records is crucial for planning and adaptation strategies, especially in the context of increasing temperature trends.
Regional Implications and Climate Goals
Germany has set ambitious climate goals to reduce greenhouse gas emissions and limit temperature rise. The observed warming trends in Berlin-Dahlem underscore the urgency of these objectives. Recent weather events, such as heatwaves and heavy rainfall, provide a backdrop for understanding the local impacts of global climate change. These changes necessitate adaptive measures to safeguard the region's environmental and economic stability.
Station Statistics
10-Year Trend
High: +1.25 °F/decade
Low: +0.68 °F/decade
Rain: -0.004 in/decade
25-Year Trend
High: +1.38 °F/decade
Low: +0.93 °F/decade
Rain: -0.005 in/decade
50-Year Trend
High: +1.05 °F/decade
Low: +0.52 °F/decade
Rain: -0.001 in/decade
All-Time Trend
High: +0.22 °F/decade
Low: +0.08 °F/decade
Rain: -0.000 in/decade
Percentage Above-Average Days
Last 12 Months: 56.7%
This Year: 57.2%
Precipitation Concentration Index (PCI) ℹ️
Last 12 Months: 10.2
Historical Average: 11.0
Percentile Rank of Last 12 Months ℹ️
High: 93rd percentile
Low: 79th percentile
Rain: 9th percentile
Change in Variance ℹ️
High: -3.3%
Low: -13.5%
Intraday: +17.8%
Data Coverage
90.2%
First Year of Data
1876
Station Location
Historical Weather Records
| Max High | Avg High | Min High | Max Avg | Avg Avg | Min Avg | Max Low | Avg Low | Min Low | Max Precipitation | Avg Precipitation | Max Snow | Avg Snow | |
|---|---|---|---|---|---|---|---|---|---|---|---|---|---|
| Record | 100.53 °F | — | 2.48 °F | 86.36 °F | — | -0.58 °F | 77.14 °F | — | -9.58 °F | 4.91 in | — | — | — |
| January | 60.80 °F | 36.10 °F | 2.48 °F | 57.38 °F | 32.19 °F | -0.58 °F | 49.64 °F | 27.38 °F | -9.58 °F | 1.26 in | 0.06 in | — | — |
| February | 66.92 °F | 38.92 °F | 3.20 °F | 56.66 °F | 33.68 °F | 0.50 °F | 52.70 °F | 28.46 °F | -9.40 °F | 0.95 in | 0.05 in | — | — |
| March | 77.18 °F | 46.67 °F | 20.48 °F | 60.98 °F | 39.85 °F | 12.56 °F | 52.52 °F | 32.80 °F | 2.30 °F | 1.21 in | 0.05 in | — | — |
| April | 87.62 °F | 56.46 °F | 32.90 °F | 71.42 °F | 48.42 °F | 29.48 °F | 61.34 °F | 39.27 °F | 19.94 °F | 2.65 in | 0.05 in | — | — |
| May | 95.90 °F | 66.17 °F | 38.84 °F | 79.52 °F | 57.16 °F | 35.06 °F | 66.56 °F | 47.02 °F | 24.80 °F | 1.90 in | 0.06 in | — | — |
| June | 100.53 °F | 72.20 °F | 46.76 °F | 86.29 °F | 63.17 °F | 44.78 °F | 77.14 °F | 53.10 °F | 33.44 °F | 2.28 in | 0.08 in | — | — |
| July | 100.22 °F | 74.87 °F | 54.68 °F | 85.10 °F | 65.92 °F | 50.18 °F | 74.84 °F | 56.51 °F | 41.72 °F | 2.57 in | 0.09 in | — | — |
| August | 99.86 °F | 73.70 °F | 52.70 °F | 86.36 °F | 64.83 °F | 50.18 °F | 72.50 °F | 55.50 °F | 38.30 °F | 4.91 in | 0.08 in | — | — |
| September | 93.56 °F | 66.54 °F | 47.84 °F | 78.08 °F | 57.84 °F | 42.44 °F | 67.28 °F | 49.57 °F | 29.30 °F | 1.57 in | 0.06 in | — | — |
| October | 81.50 °F | 55.83 °F | 31.10 °F | 65.84 °F | 49.17 °F | 28.04 °F | 62.24 °F | 42.37 °F | 14.72 °F | 1.43 in | 0.06 in | — | — |
| November | 68.90 °F | 44.58 °F | 12.02 °F | 61.70 °F | 40.65 °F | 16.88 °F | 57.02 °F | 35.39 °F | 3.02 °F | 1.87 in | 0.06 in | — | — |
| December | 63.86 °F | 38.10 °F | 4.46 °F | 58.10 °F | 34.79 °F | 0.68 °F | 52.70 °F | 30.17 °F | -4.36 °F | 0.92 in | 0.06 in | — | — |
Data Visualisations
Remove WatermarksCurrent Year Climate Trends vs Historical


Max Temperature this Year | 1 of 6
Climate 12-Month Moving Averages


Max Temperature 12-Month MA | 1 of 6
Daily Data Points and Averages Throughout the Year


Average Max Temperature Throughout Year | 1 of 5
