Climate for Station: Kokpekty, Abai Region, Kazakhstan
Loading live weather...
Climate Analysis & Overview
Kokpekty is experiencing a warming trend, with significant increases in low temperatures over the past decade. Precipitation patterns have become more evenly distributed, indicating a shift in local climate dynamics.
Kokpekty's Climatic Context
Kokpekty, located at 48.75°N, 82.367°E in Kazakhstan, is characterised by a continental climate, classified under the Köppen system as Dfb, which denotes cold, snowy winters and warm summers. The region's geography, nestled in the eastern part of Kazakhstan, is influenced by its distance from large bodies of water and the surrounding steppe landscape, which contributes to its extreme temperature variations. The area's climate is shaped by these geographical features, leading to significant seasonal temperature shifts.
Temperature Trends: An Increasing Warmth
Over the past decade, Kokpekty has witnessed a noticeable warming trend. High temperatures have increased by 0.44°C (0.79°F), while low temperatures have surged by a more substantial 2.50°C (4.50°F). When considering the all-time trends, high temperatures have risen by 0.17°C (0.31°F), and low temperatures by 0.21°C (0.38°F). This indicates a consistent warming pattern, with the recent decade showing a sharper increase in low temperatures, suggesting milder winters. These changes are crucial for understanding the broader implications of climate change in Kazakhstan, where regional climate goals aim to mitigate such warming effects.
Record Extremes: A Spectrum of Temperatures
Kokpekty's temperature records highlight the extremity of its climate. The highest recorded temperature is 40.9°C (105.6°F), while the lowest plummets to -49.6°C (-57.3°F). These records underscore the significant thermal oscillations the region experiences, a characteristic feature of continental climates. Such extremes pose challenges for local agriculture and infrastructure, necessitating adaptive strategies to cope with both intense heat and severe cold.
Precipitation Patterns: A More Even Distribution
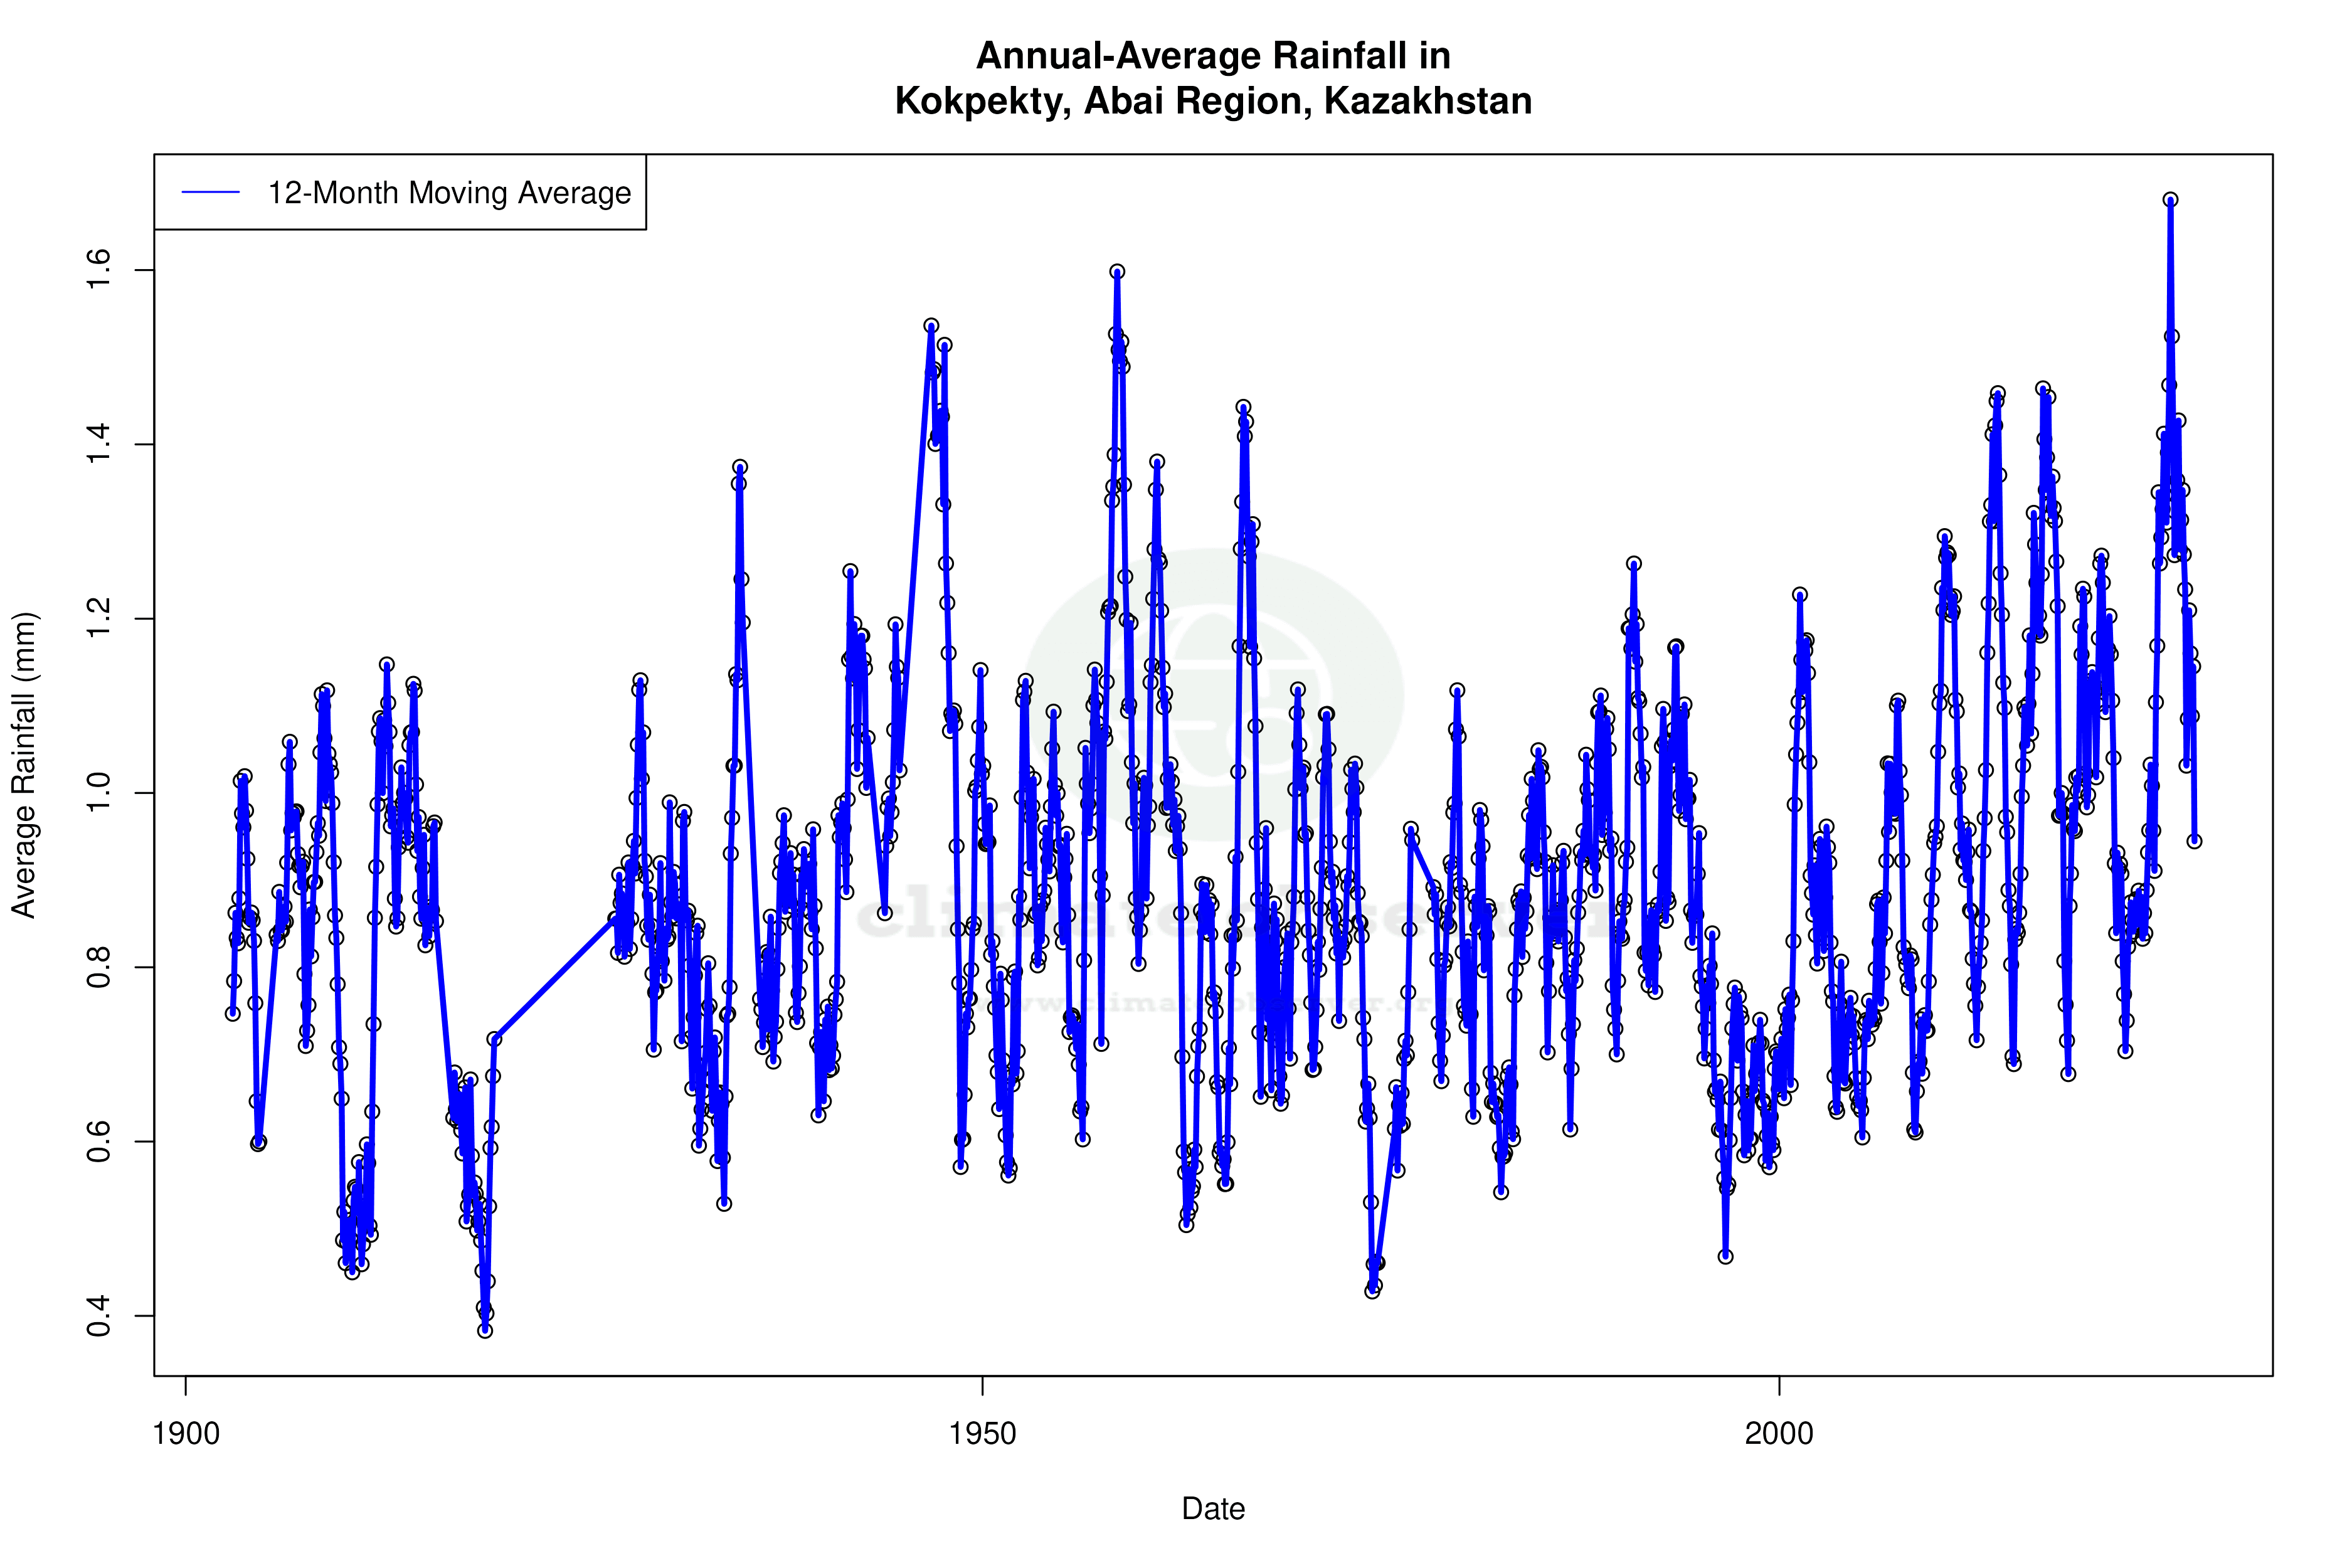
The Precipitation Concentration Index (PCI) offers insights into rainfall distribution. Kokpekty's PCI has decreased from a baseline of 11.65 to a current value of 9.56, indicating a more even distribution of precipitation events over time. This shift suggests that rainfall is becoming less concentrated in intense, sporadic events and more evenly spread throughout the year. Such a change can benefit agricultural activities by reducing the risk of flooding and drought, aligning with Kazakhstan's efforts to enhance water resource management.
Implications of Climatic Shifts
These climatic trends in Kokpekty reflect broader regional changes and highlight the importance of monitoring and adapting to evolving weather patterns. The significant increase in low temperatures over the past decade, coupled with more evenly distributed precipitation, suggests a shift towards a milder and potentially more stable climate. This evolution aligns with Kazakhstan's strategic initiatives to address climate change impacts, ensuring sustainable development and resilience in the face of ongoing environmental challenges.
Station Statistics
10-Year Trend
High: +1.14 °F/decade
Low: +5.15 °F/decade
Rain: +0.001 in/decade
25-Year Trend
High: +0.90 °F/decade
Low: +1.21 °F/decade
Rain: +0.006 in/decade
50-Year Trend
High: +0.52 °F/decade
Low: +0.70 °F/decade
Rain: +0.003 in/decade
All-Time Trend
High: +0.23 °F/decade
Low: +0.30 °F/decade
Rain: +0.000 in/decade
Percentage Above-Average Days
Last 12 Months: 53.2%
This Year: 42.5%
Precipitation Concentration Index (PCI) ℹ️
Last 12 Months: 10.1
Historical Average: 11.7
Percentile Rank of Last 12 Months ℹ️
High: 77th percentile
Low: 97th percentile
Rain: 78th percentile
Change in Variance ℹ️
High: -5.0%
Low: -15.0%
Intraday: -7.2%
Data Coverage
80.9%
First Year of Data
1902
Station Location
Historical Weather Records
| Max High | Avg High | Min High | Max Avg | Avg Avg | Min Avg | Max Low | Avg Low | Min Low | Max Precipitation | Avg Precipitation | Max Snow | Avg Snow | |
|---|---|---|---|---|---|---|---|---|---|---|---|---|---|
| Record | 105.62 °F | — | -33.88 °F | 87.98 °F | — | -47.56 °F | 75.56 °F | — | -57.28 °F | 2.15 in | — | — | — |
| January | 37.04 °F | 6.95 °F | -31.00 °F | 30.02 °F | -4.32 °F | -47.56 °F | 25.52 °F | -15.59 °F | -57.10 °F | 0.79 in | 0.04 in | — | — |
| February | 40.64 °F | 12.41 °F | -27.94 °F | 33.62 °F | -0.02 °F | -38.02 °F | 30.02 °F | -12.81 °F | -57.28 °F | 1.65 in | 0.03 in | — | — |
| March | 63.68 °F | 27.11 °F | -16.06 °F | 43.52 °F | 16.31 °F | -31.54 °F | 39.38 °F | 2.74 °F | -43.24 °F | 1.47 in | 0.03 in | — | — |
| April | 85.28 °F | 51.91 °F | 13.82 °F | 71.24 °F | 41.12 °F | 4.64 °F | 58.28 °F | 27.26 °F | -18.76 °F | 1.15 in | 0.03 in | — | — |
| May | 97.34 °F | 69.20 °F | 23.36 °F | 80.78 °F | 55.91 °F | 28.58 °F | 62.96 °F | 40.82 °F | 6.98 °F | 1.87 in | 0.03 in | — | — |
| June | 98.78 °F | 79.04 °F | 47.48 °F | 86.54 °F | 65.75 °F | 42.26 °F | 73.22 °F | 50.82 °F | 26.42 °F | 1.61 in | 0.04 in | — | — |
| July | 104.54 °F | 82.54 °F | 53.96 °F | 87.98 °F | 69.44 °F | 48.56 °F | 75.56 °F | 55.30 °F | 35.24 °F | 2.15 in | 0.04 in | — | — |
| August | 105.62 °F | 79.97 °F | 52.52 °F | 87.44 °F | 65.91 °F | 46.04 °F | 69.98 °F | 50.71 °F | 25.70 °F | 2.11 in | 0.03 in | — | — |
| September | 98.60 °F | 68.74 °F | 34.52 °F | 78.26 °F | 53.93 °F | 27.32 °F | 65.30 °F | 38.70 °F | 12.92 °F | 1.19 in | 0.02 in | — | — |
| October | 82.04 °F | 51.01 °F | 12.56 °F | 68.54 °F | 38.32 °F | 6.98 °F | 50.43 °F | 26.34 °F | -7.06 °F | 1.18 in | 0.03 in | — | — |
| November | 58.10 °F | 27.18 °F | -32.26 °F | 46.22 °F | 18.30 °F | -38.74 °F | 39.74 °F | 7.64 °F | -52.60 °F | 1.59 in | 0.05 in | — | — |
| December | 50.54 °F | 11.65 °F | -33.88 °F | 32.18 °F | 2.58 °F | -45.76 °F | 31.82 °F | -9.23 °F | -53.14 °F | 1.46 in | 0.04 in | — | — |
Data Visualisations
Remove WatermarksCurrent Year Climate Trends vs Historical


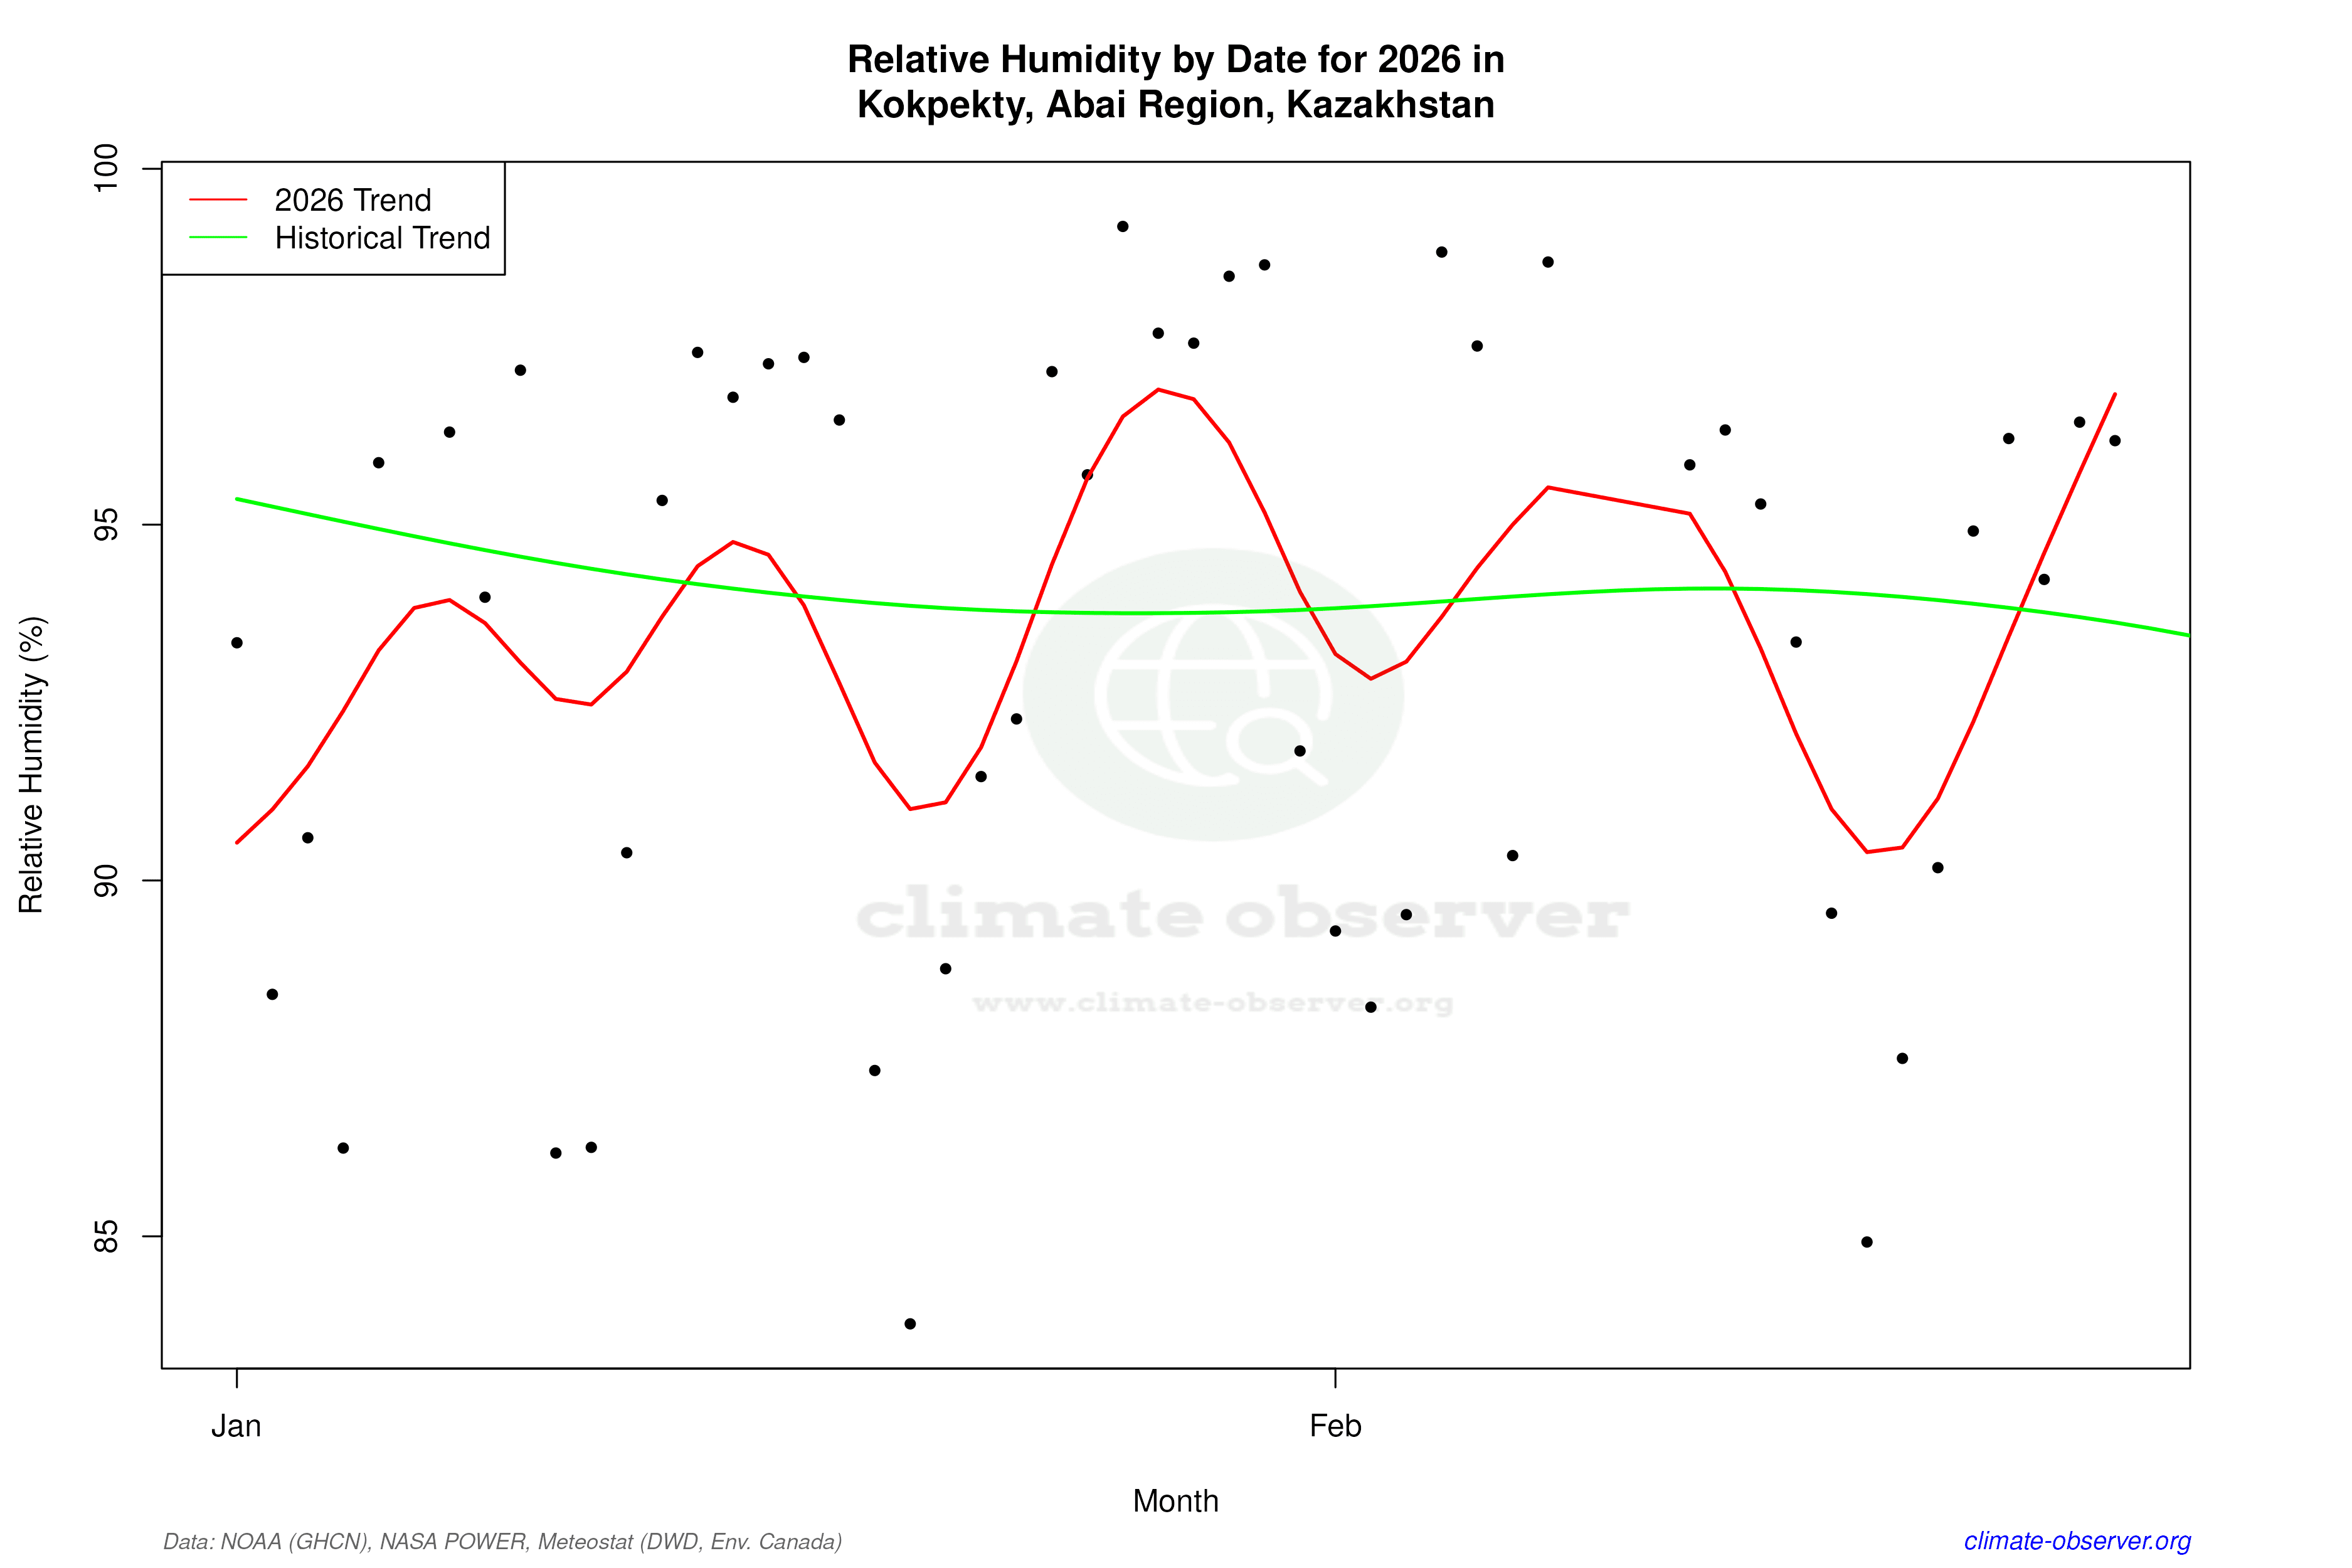

Max Temperature this Year | 1 of 6
Climate 12-Month Moving Averages

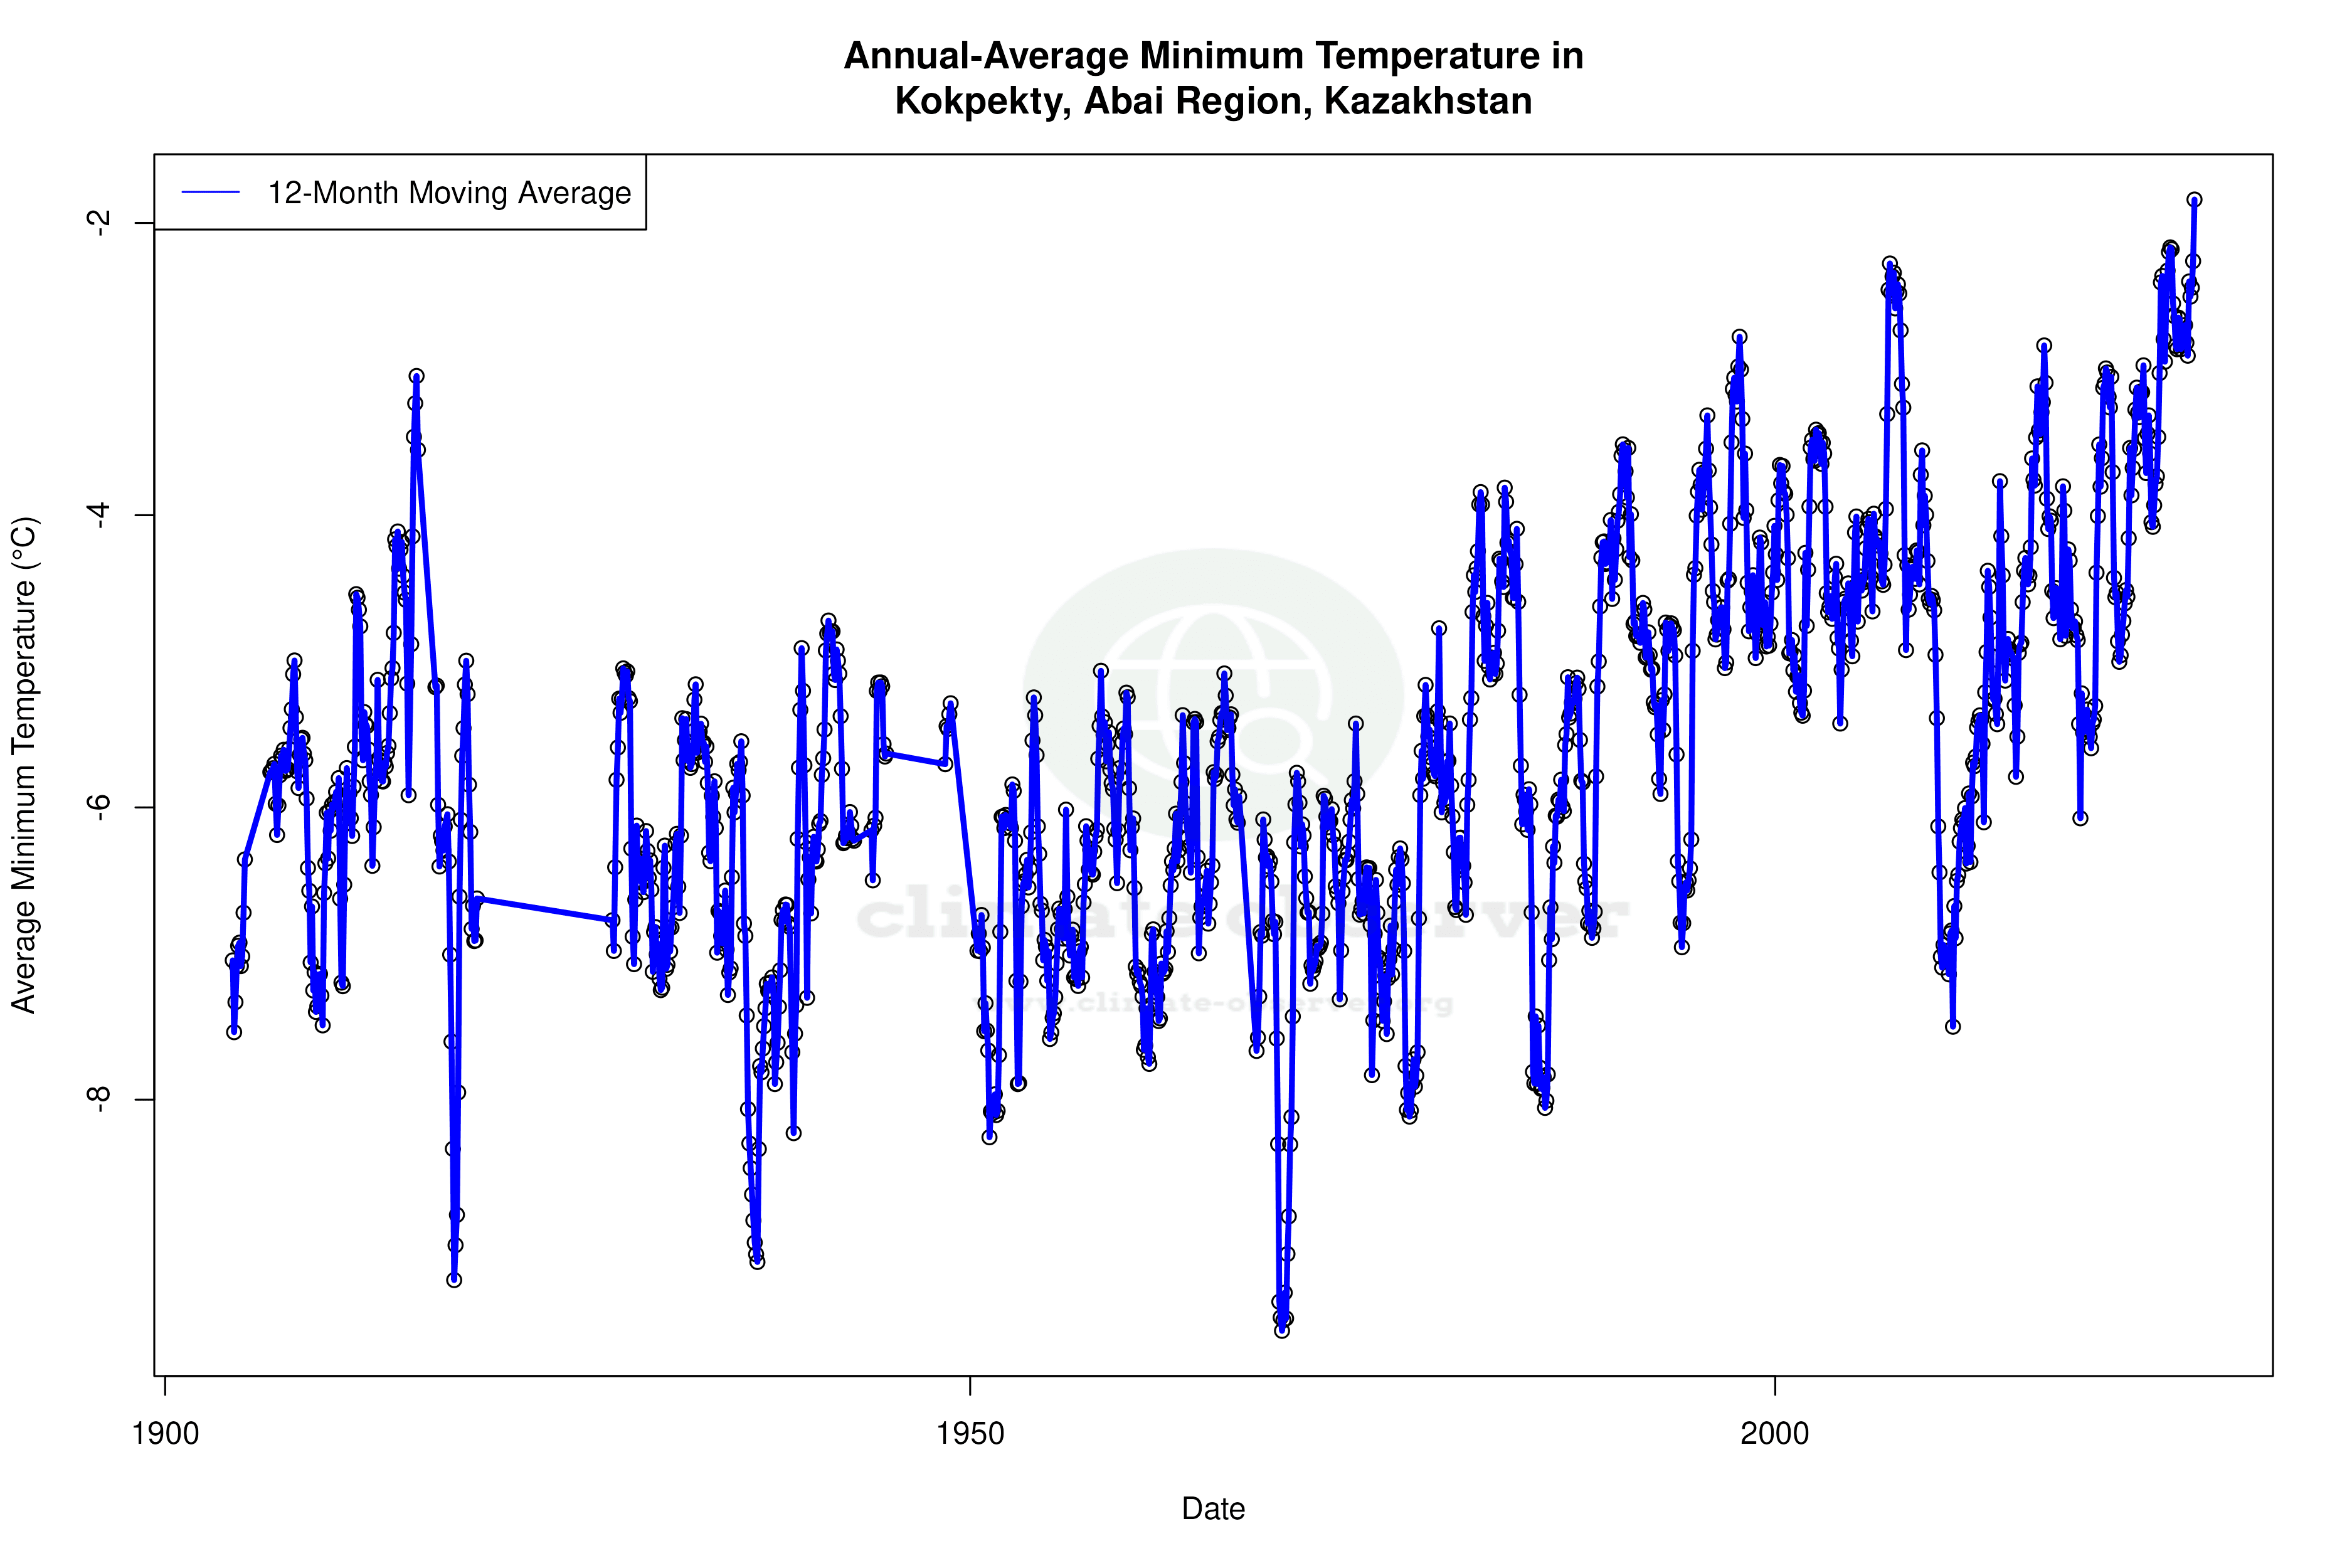


Max Temperature 12-Month MA | 1 of 6
Daily Data Points and Averages Throughout the Year


Average Max Temperature Throughout Year | 1 of 5
