Climate for Station: Toluca (Obs), Mexico State, Mexico
Loading live weather...
Climate Analysis & Overview
Toluca experiences a complex climate narrative where long-term warming trends contrast with recent cooling in high temperatures. The Precipitation Concentration Index indicates a slight shift towards more evenly distributed rainfall. These dynamics are crucial for understanding Toluca's evolving climate in the context of Mexico's regional climate goals.
Mountainous Climate Dynamics
Toluca, located at 19.2833°N, 99.7°W, is nestled in the high-altitude valleys of central Mexico, contributing to its subtropical highland climate (Cwb in the Köppen classification). This geography plays a crucial role in moderating temperatures and influencing precipitation patterns. The surrounding mountains act as a barrier, affecting wind and rainfall distribution, which is reflected in the station's data.
Temperature Trends: A Tale of Two Directions
Over the long term, Toluca has experienced a warming trend, with all-time high temperatures increasing by 0.89°C (1.60°F). This indicates a gradual rise in maximum temperatures, likely influenced by broader regional and global climate changes. However, the past decade reveals a different story, with a cooling trend in high temperatures of -0.28°C (-0.50°F). This divergence suggests short-term climatic variability, possibly due to localised weather patterns or human activities affecting the immediate environment.
Night-time Warming: A Persistent Trend
In contrast to the highs, low temperatures in Toluca have consistently risen. Over the last decade, there has been an increase of 0.69°C (1.24°F) in low temperatures, while the all-time trend shows a rise of 0.32°C (0.58°F). This persistent warming of night-time temperatures could be indicative of urban heat island effects or changes in atmospheric conditions that prevent heat from escaping during the night.
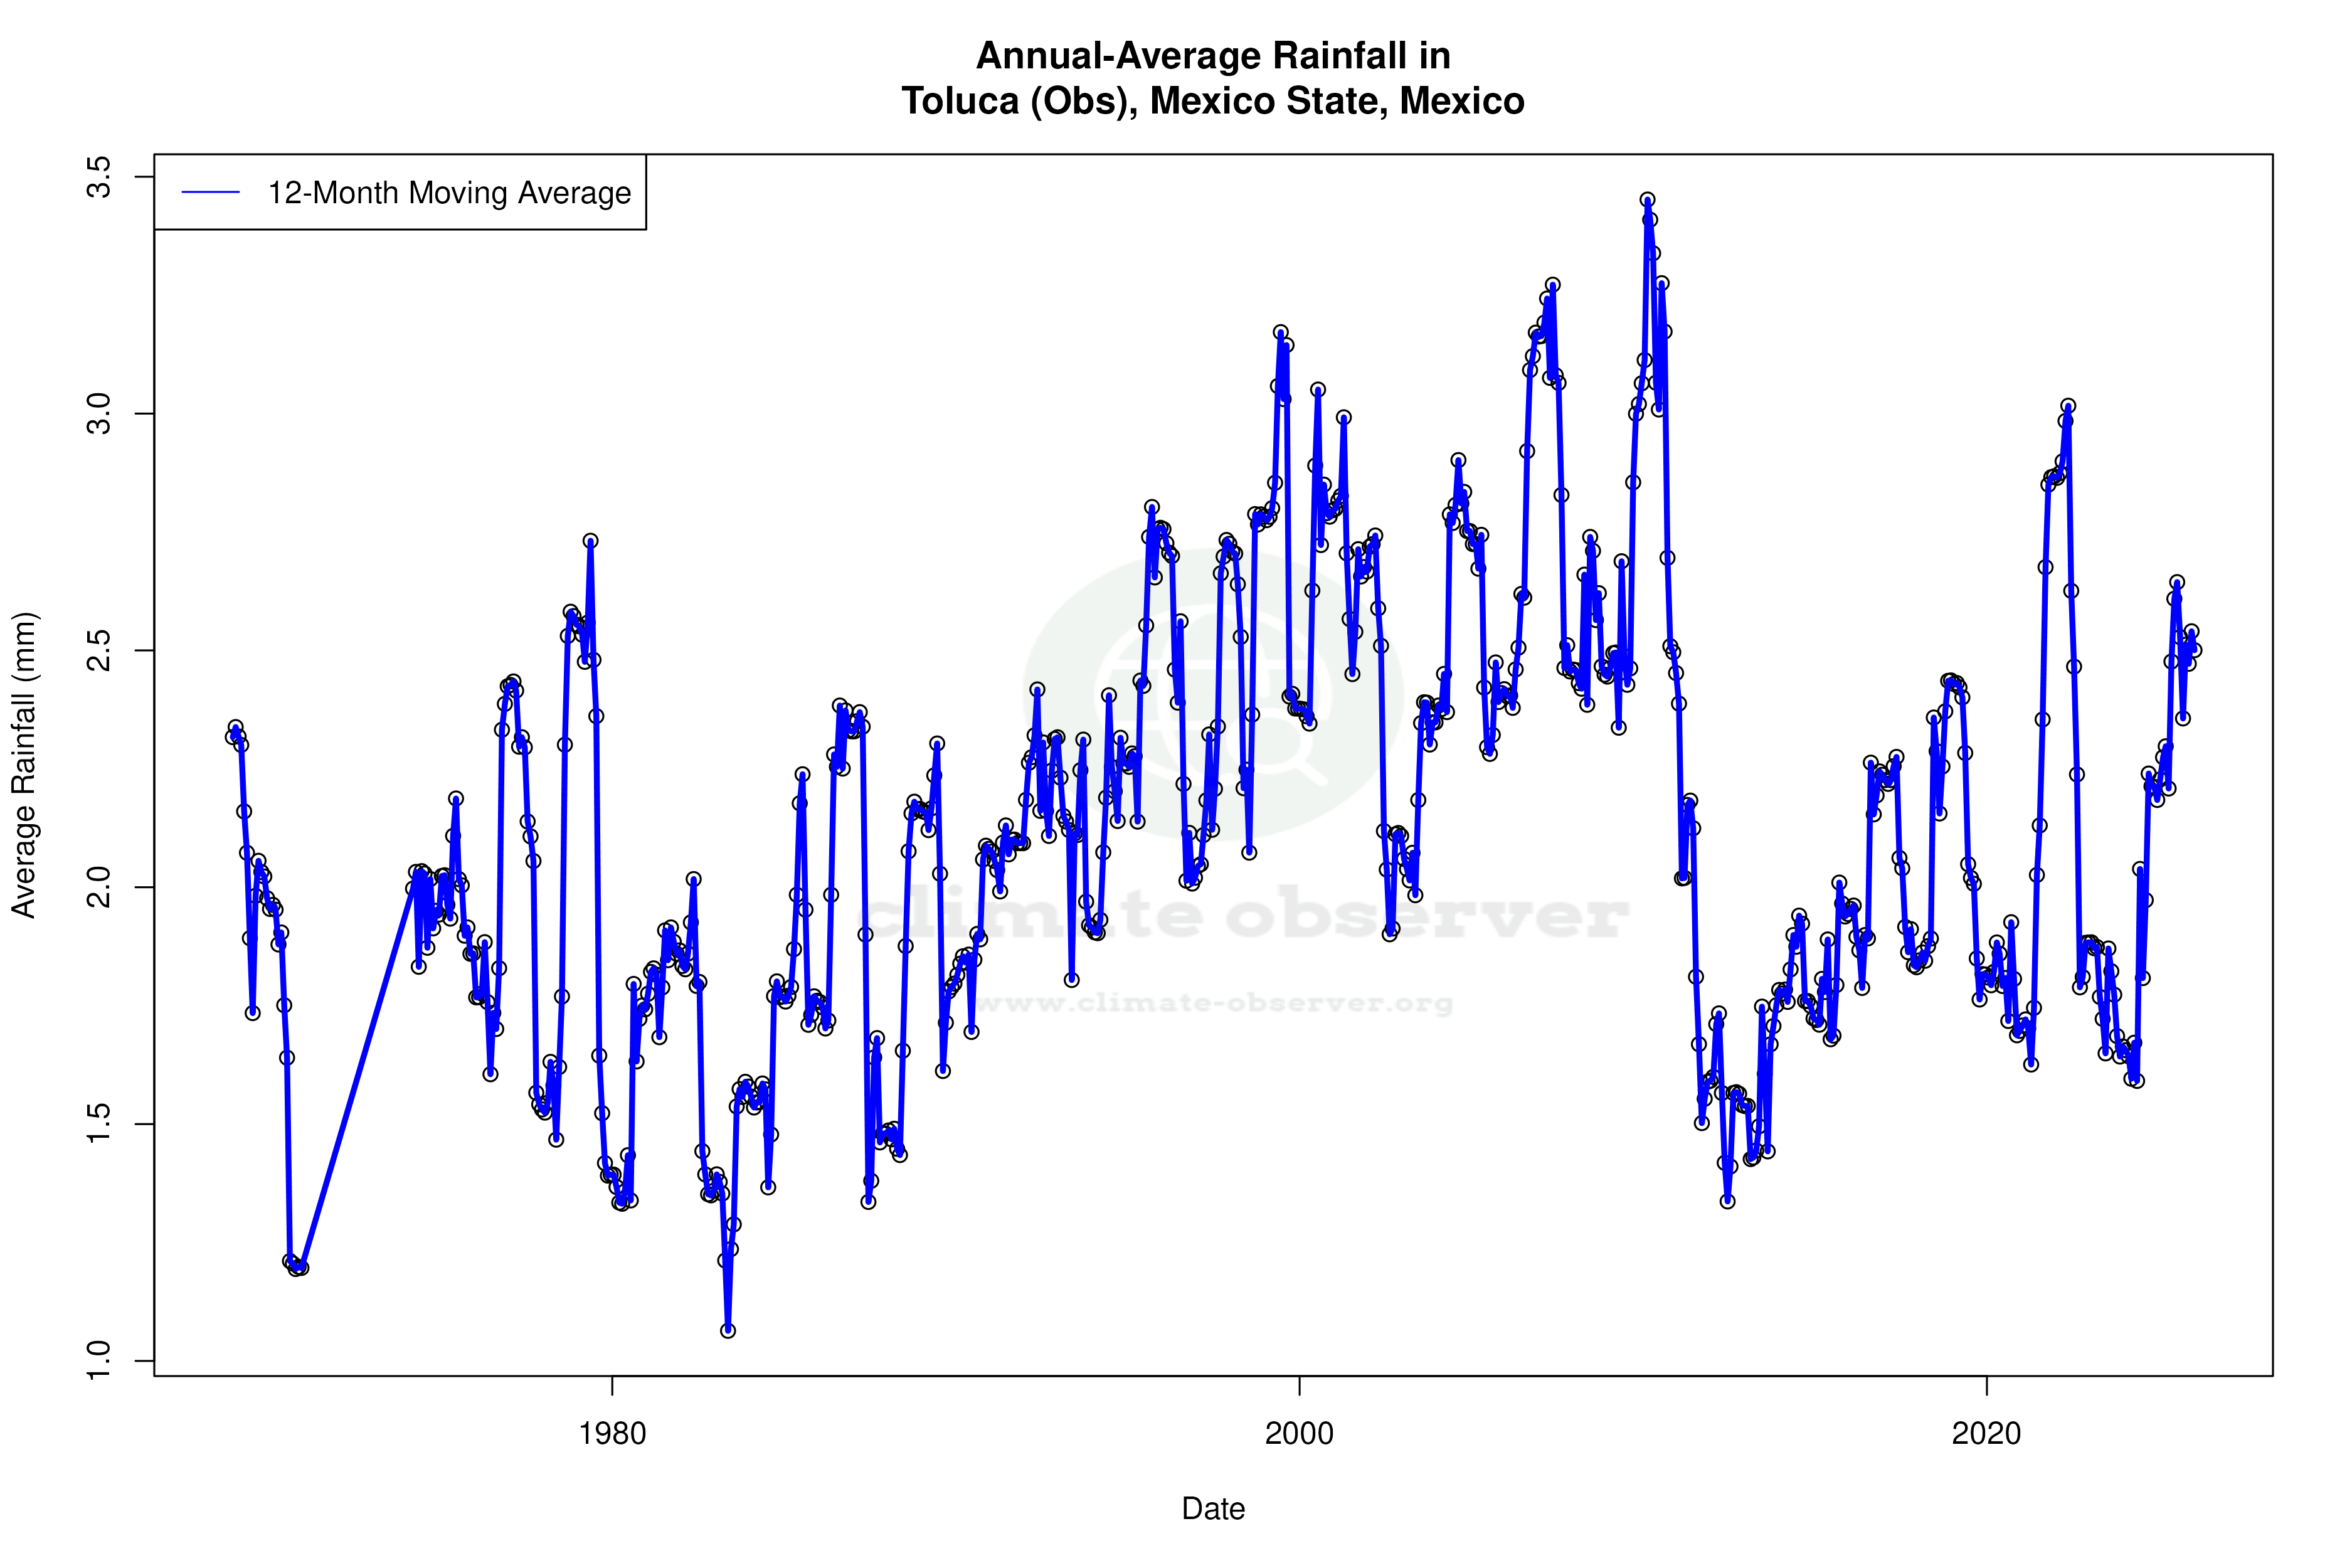
Precipitation Patterns: A Shift Towards Even Distribution
The Precipitation Concentration Index (PCI) for Toluca has decreased from a baseline of 18.57 to a current value of 17.05. This suggests a slight shift towards more evenly distributed rainfall events, reducing the concentration of precipitation in fewer, more intense events. Such a change could have implications for water resource management and agricultural planning in the region, aligning with Mexico's efforts to adapt to changing precipitation patterns.
Record Extremes: A Snapshot of Variability
Toluca's climate extremes highlight its variability, with record high temperatures reaching 33.6°C (92.5°F) and lows plunging to -11.1°C (12.0°F). These extremes underscore the range of conditions that the region can experience, influenced by its elevation and geographical positioning. Understanding these records is vital for preparing for future climate scenarios and mitigating potential impacts on the local population and infrastructure.
Station Statistics
10-Year Trend
High: -1.40 °F/decade
Low: +2.33 °F/decade
Rain: +0.008 in/decade
25-Year Trend
High: +1.80 °F/decade
Low: +0.86 °F/decade
Rain: -0.009 in/decade
50-Year Trend
High: +1.47 °F/decade
Low: +0.93 °F/decade
Rain: +0.003 in/decade
All-Time Trend
High: +1.56 °F/decade
Low: +0.62 °F/decade
Rain: +0.003 in/decade
Percentage Above-Average Days
Last 12 Months: 39.7%
This Year: 61.4%
Precipitation Concentration Index (PCI) ℹ️
Last 12 Months: 12.6
Historical Average: 18.0
Percentile Rank of Last 12 Months ℹ️
High: 60th percentile
Low: 98th percentile
Rain: 81st percentile
Change in Variance ℹ️
High: +3.4%
Low: -16.7%
Intraday: -1.3%
Data Coverage
91.7%
First Year of Data
1968
Station Location
Historical Weather Records
| Max High | Avg High | Min High | Max Avg | Avg Avg | Min Avg | Max Low | Avg Low | Min Low | Max Precipitation | Avg Precipitation | Max Snow | Avg Snow | |
|---|---|---|---|---|---|---|---|---|---|---|---|---|---|
| Record | 96.08 °F | — | 42.98 °F | 74.84 °F | — | 33.98 °F | 59.72 °F | — | 12.02 °F | 4.35 in | — | — | — |
| January | 83.84 °F | 67.04 °F | 42.98 °F | 63.32 °F | 50.60 °F | 37.94 °F | 49.66 °F | 31.82 °F | 12.02 °F | 0.99 in | 0.01 in | — | — |
| February | 83.84 °F | 69.93 °F | 50.00 °F | 68.54 °F | 53.20 °F | 39.74 °F | 52.23 °F | 33.78 °F | 17.96 °F | 2.42 in | 0.01 in | — | — |
| March | 91.94 °F | 73.46 °F | 51.08 °F | 73.22 °F | 56.45 °F | 43.16 °F | 53.42 °F | 36.63 °F | 17.06 °F | 0.67 in | 0.01 in | — | — |
| April | 89.60 °F | 75.60 °F | 50.00 °F | 73.94 °F | 60.07 °F | 43.16 °F | 57.87 °F | 41.09 °F | 23.00 °F | 1.21 in | 0.04 in | — | — |
| May | 96.08 °F | 75.35 °F | 50.00 °F | 74.84 °F | 61.49 °F | 49.82 °F | 59.13 °F | 44.61 °F | 30.92 °F | 2.27 in | 0.09 in | — | — |
| June | 88.16 °F | 71.76 °F | 55.04 °F | 73.22 °F | 60.31 °F | 49.64 °F | 59.72 °F | 47.44 °F | 28.94 °F | 2.88 in | 0.19 in | — | — |
| July | 84.92 °F | 69.27 °F | 55.94 °F | 68.72 °F | 58.32 °F | 47.48 °F | 56.41 °F | 46.83 °F | 32.00 °F | 2.18 in | 0.19 in | — | — |
| August | 80.42 °F | 69.58 °F | 55.94 °F | 69.08 °F | 58.43 °F | 49.64 °F | 57.74 °F | 46.67 °F | 32.00 °F | 2.19 in | 0.20 in | — | — |
| September | 82.94 °F | 69.30 °F | 51.08 °F | 69.26 °F | 58.01 °F | 46.94 °F | 56.66 °F | 46.65 °F | 24.98 °F | 2.82 in | 0.18 in | — | — |
| October | 84.92 °F | 69.53 °F | 50.00 °F | 68.00 °F | 56.41 °F | 43.88 °F | 55.22 °F | 41.87 °F | 19.04 °F | 4.35 in | 0.07 in | — | — |
| November | 84.02 °F | 68.83 °F | 48.92 °F | 68.72 °F | 53.46 °F | 39.38 °F | 53.11 °F | 35.92 °F | 17.96 °F | 0.54 in | 0.02 in | — | — |
| December | 87.08 °F | 67.23 °F | 48.02 °F | 63.86 °F | 51.04 °F | 33.98 °F | 50.74 °F | 33.08 °F | 14.00 °F | 0.35 in | 0.00 in | — | — |
Data Visualisations
Remove WatermarksCurrent Year Climate Trends vs Historical


Max Temperature this Year | 1 of 6
Climate 12-Month Moving Averages

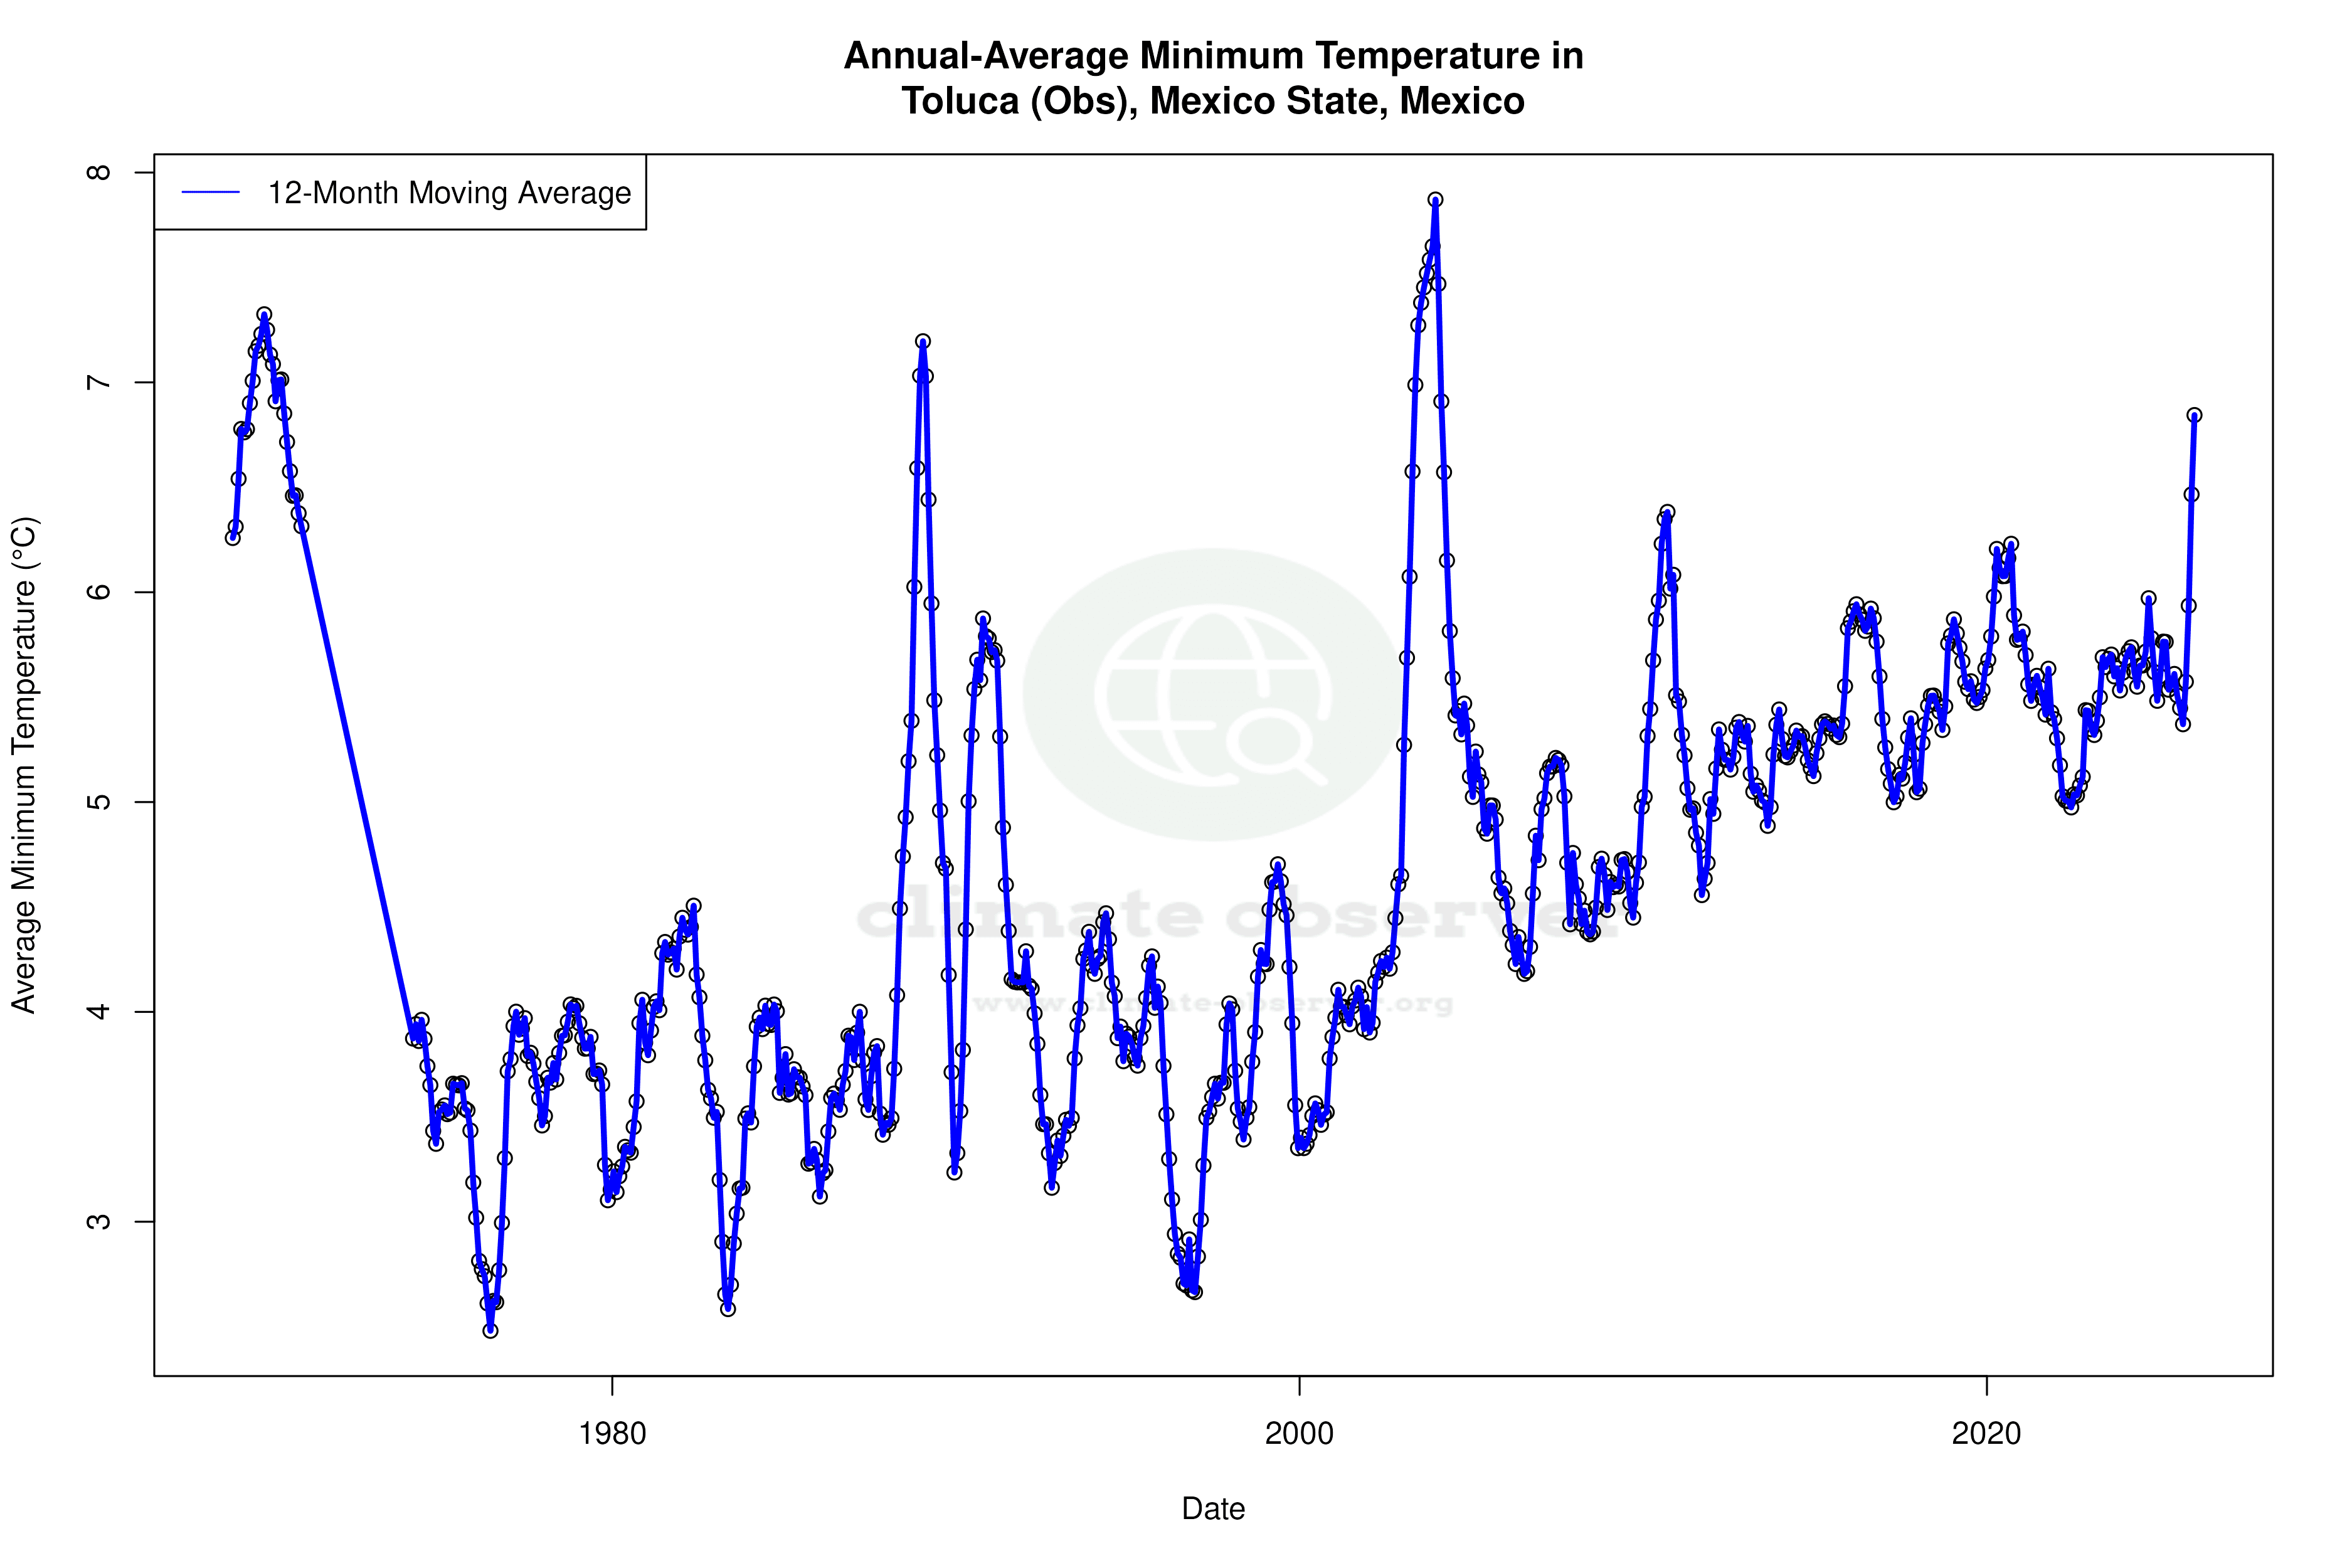


Max Temperature 12-Month MA | 1 of 6
Daily Data Points and Averages Throughout the Year


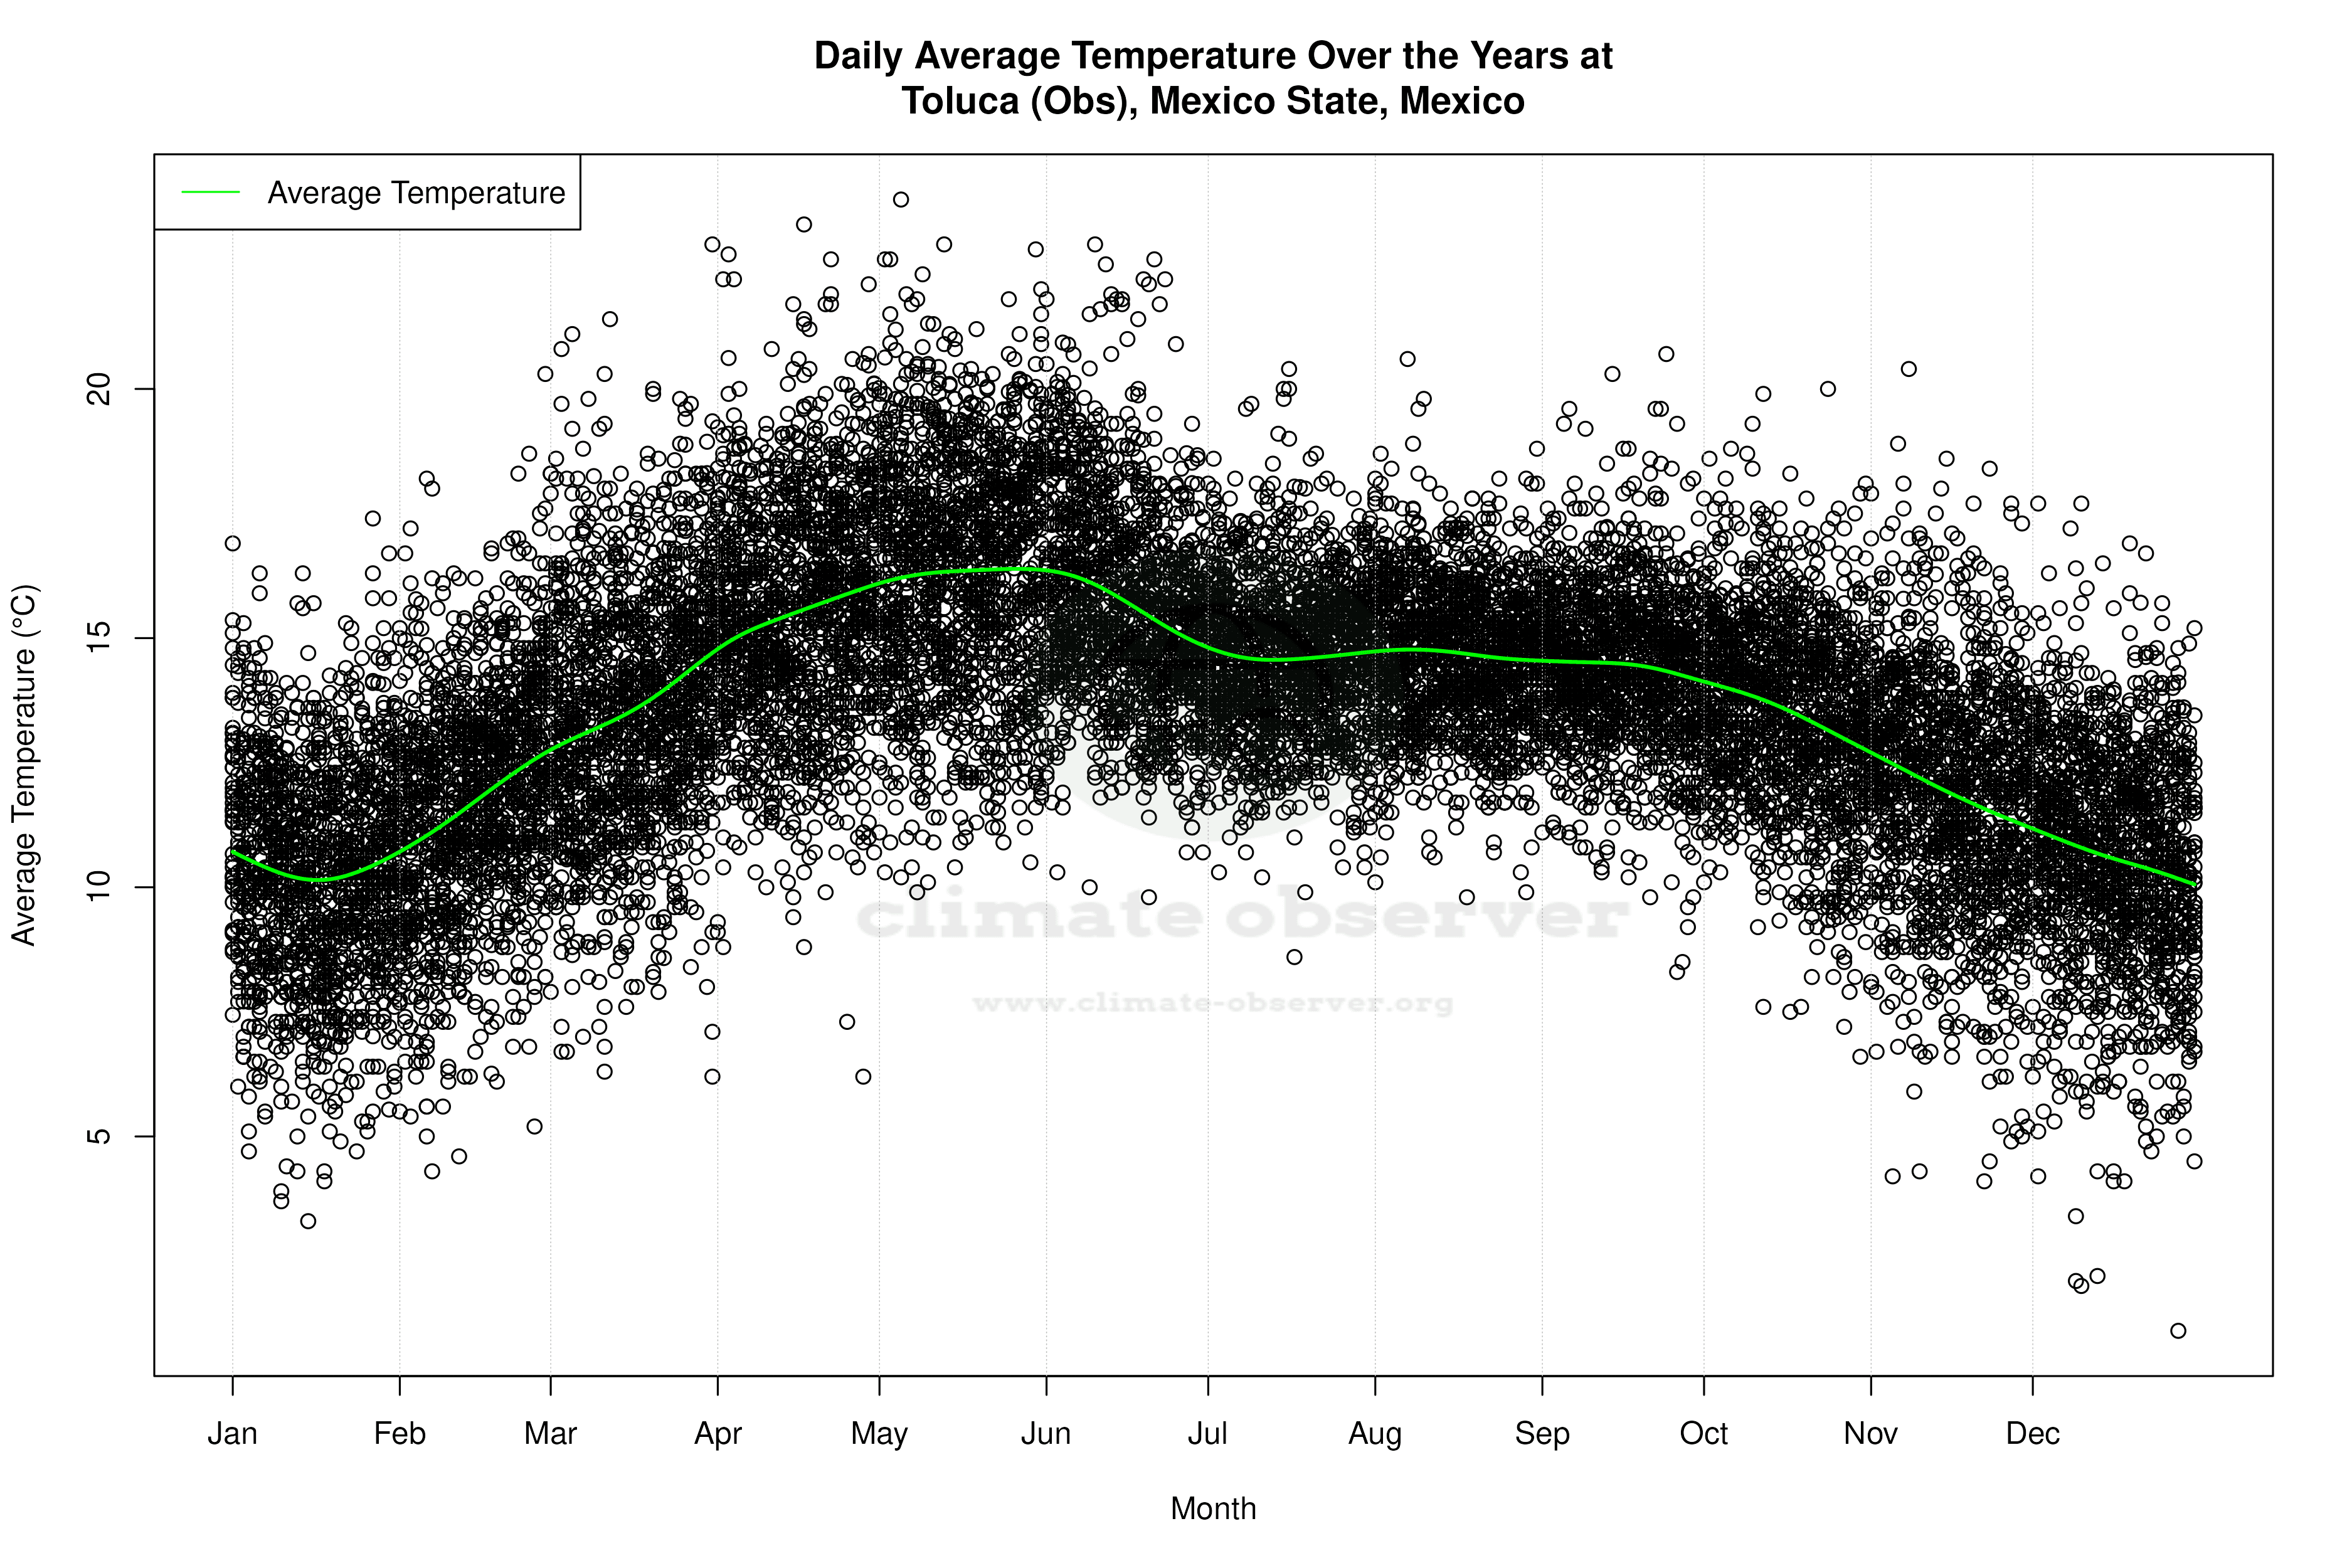


Average Max Temperature Throughout Year | 1 of 5
