Climate for Station: Mexico City, Mexico
Loading live weather...
Climate Analysis & Overview
Mexico City is experiencing a notable warming trend, with significant increases in both high and low temperatures over the past decade. Precipitation patterns have become more evenly distributed, suggesting a shift towards less extreme rainfall events. This climate evolution is critical for urban planning and water resource management.
Urban Heat Dynamics
Mexico City, situated at an elevation of approximately 2,240 metres (7,350 feet) and classified under the Köppen climate system as a subtropical highland climate (Cwb), is experiencing significant thermal changes. Over the past decade, the city has seen a warming trend in daily highs of 1.38°C (2.48°F) and lows of 2.38°C (4.28°F). These trends are more pronounced than the all-time trends, which show a warming of 0.47°C (0.85°F) for highs and 0.69°C (1.24°F) for lows. The city's geographical setting, surrounded by mountains, contributes to these thermal dynamics by trapping heat and affecting airflow, exacerbating the urban heat island effect.
Temperature Extremes
The city's temperature records reveal a maximum of 36.0°C (96.8°F) and a minimum of -4.33°C (24.2°F). These extremes highlight the city's capacity for both intense heat and rare cold snaps, influenced by its high altitude and latitude. The warming trends observed over the past decade suggest that such extreme temperatures may become more frequent, posing challenges for infrastructure and public health.
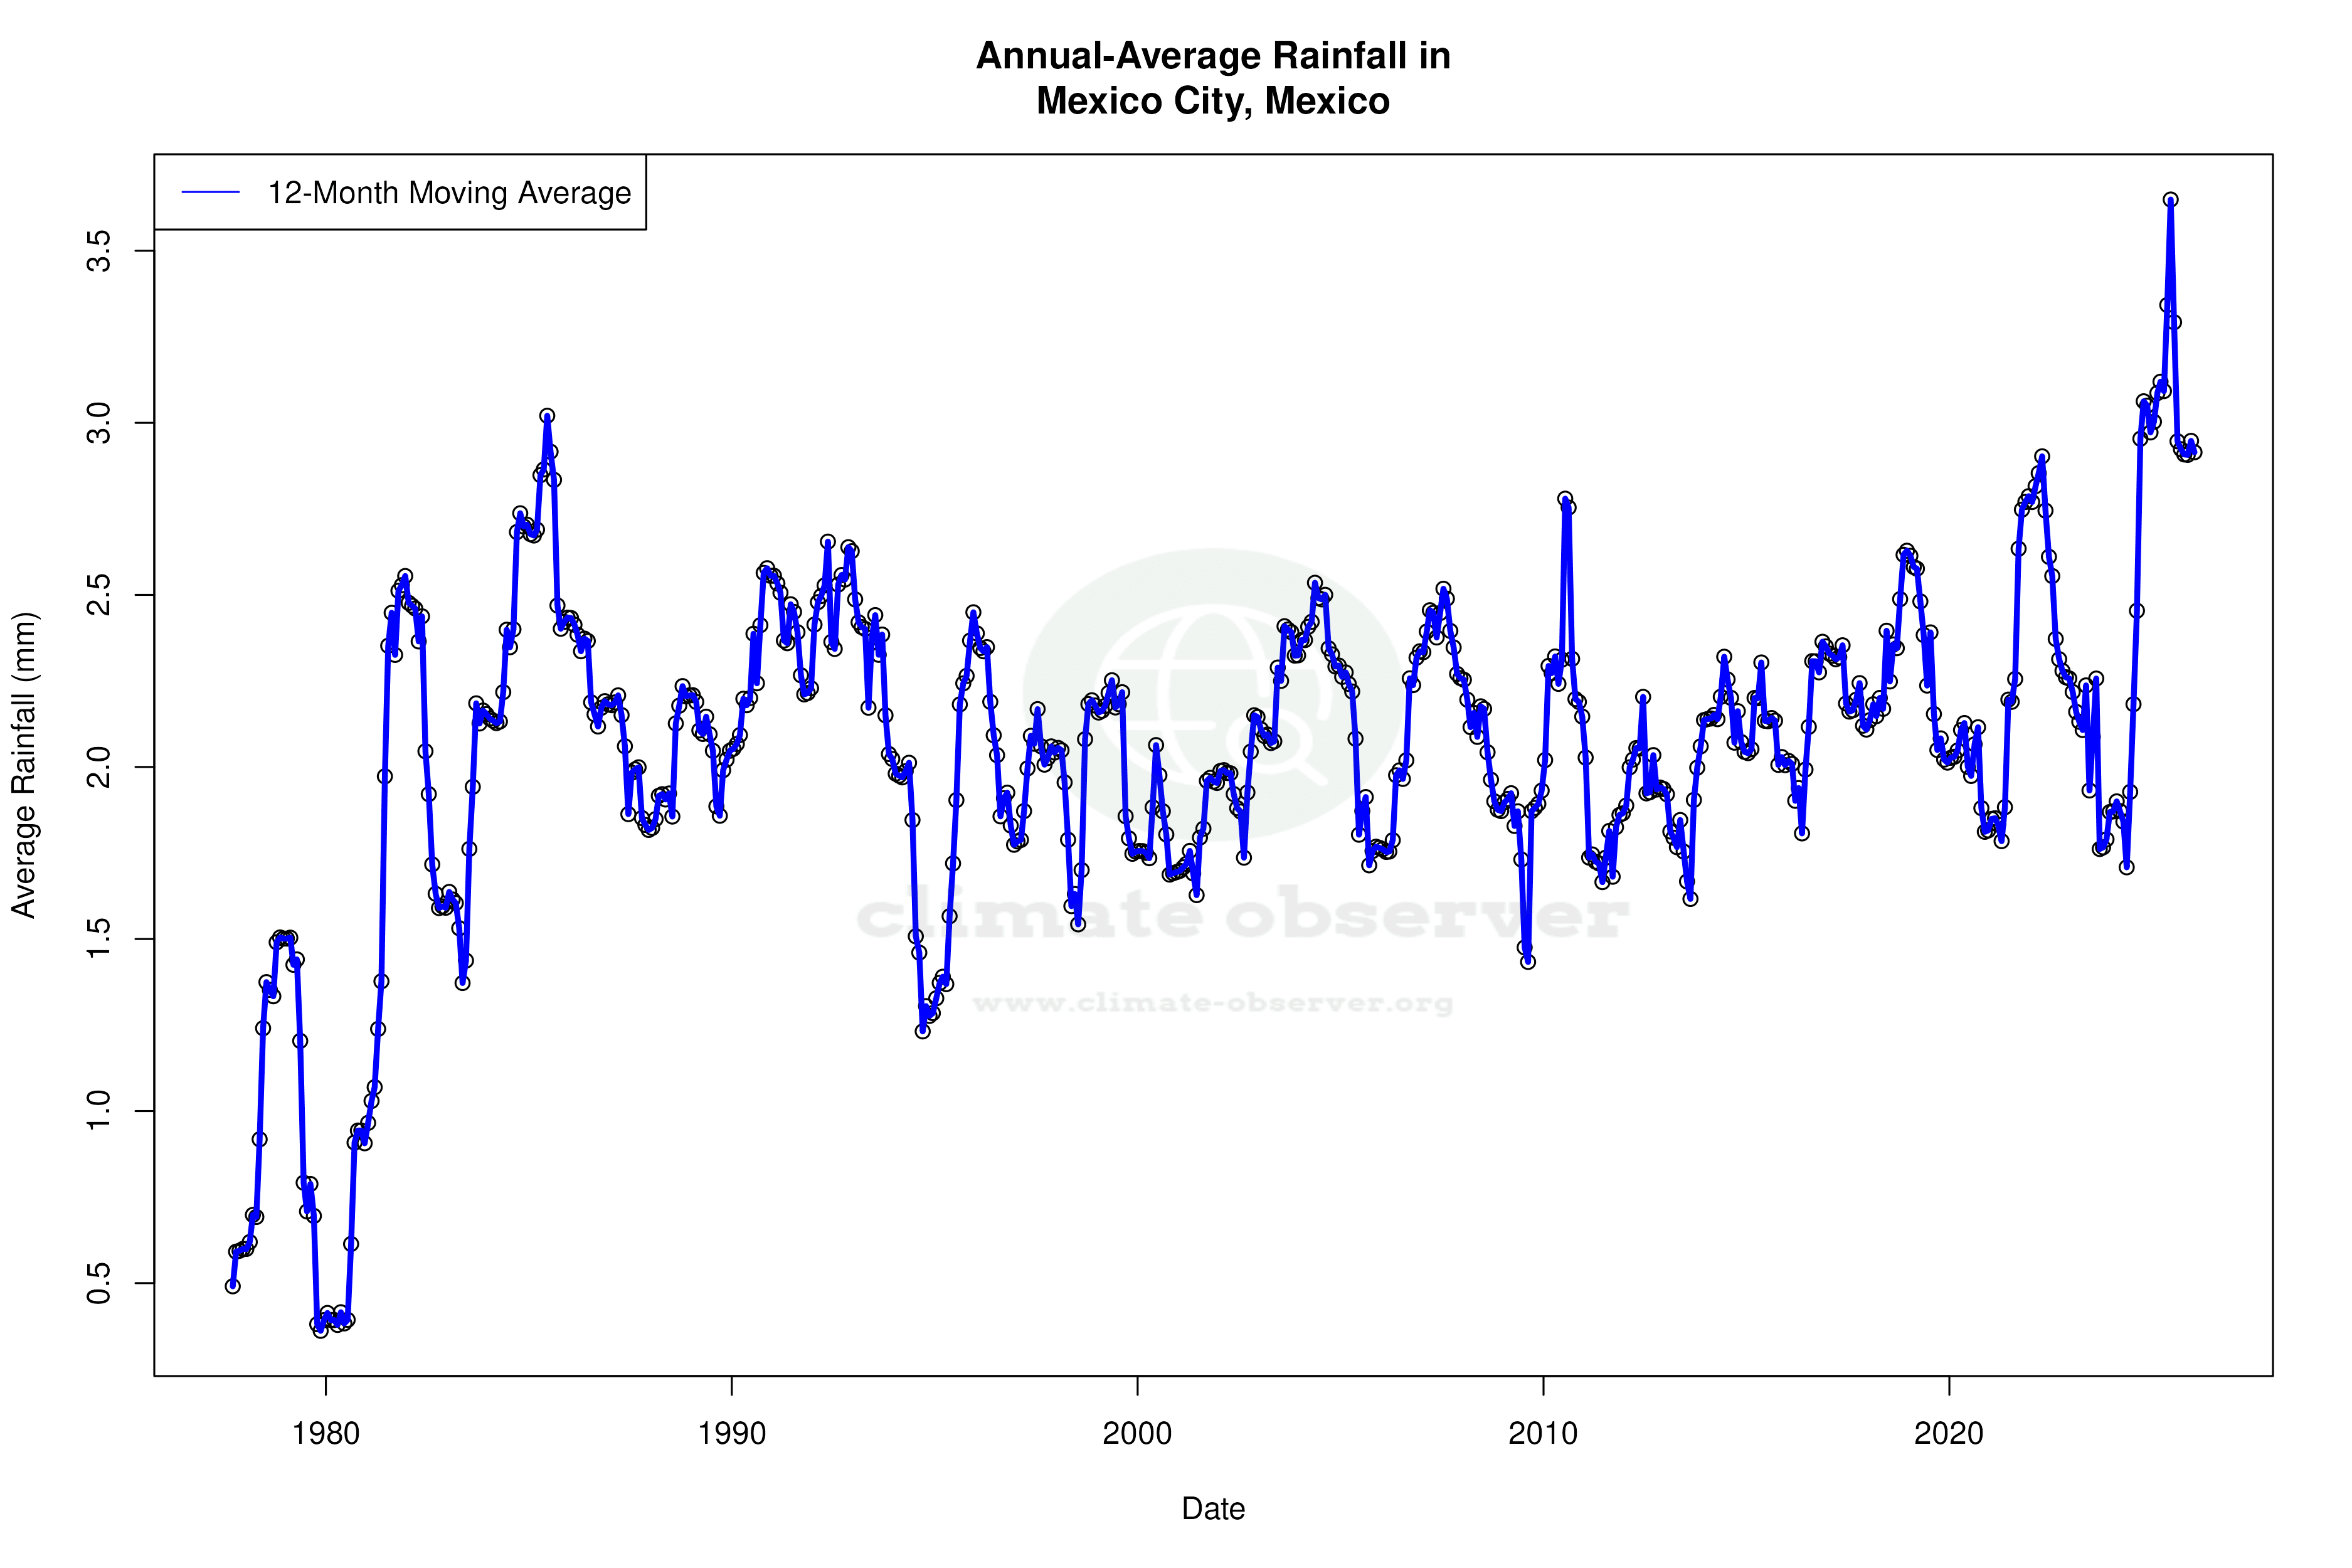
Precipitation Patterns
The Precipitation Concentration Index (PCI) for Mexico City has decreased from a baseline of 17.7 to a current value of 16.5. This indicates a marginal shift towards more evenly distributed rainfall events. A lower PCI suggests that precipitation is less concentrated in intense, short-lived events, which could reduce the risk of flooding and improve water management strategies. This shift aligns with Mexico's broader climate adaptation goals, aiming to mitigate the impacts of climate change on urban environments.
Implications for Urban Planning
The warming trends and changes in precipitation patterns have significant implications for Mexico City's urban planning and sustainability efforts. The city's infrastructure must adapt to accommodate rising temperatures and altered rainfall distribution. This includes enhancing green spaces to mitigate heat and improving drainage systems to handle changing precipitation dynamics. As Mexico City continues to grow, integrating climate resilience into its development plans will be essential to ensure the well-being of its inhabitants and the sustainability of its environment.
Regional Climate Context
Mexico City's climate trends are part of a larger regional pattern influenced by global climate change. The city's efforts to adapt to these changes are critical in the context of Mexico's national climate goals, which focus on reducing greenhouse gas emissions and enhancing climate resilience. Recent weather events, such as prolonged heatwaves and unexpected rainfall, underscore the urgency of these efforts. By understanding and addressing these climate trends, Mexico City can better prepare for the challenges ahead.
Station Statistics
10-Year Trend
High: +1.73 °F/decade
Low: +4.02 °F/decade
Rain: +0.023 in/decade
25-Year Trend
High: +3.24 °F/decade
Low: +4.38 °F/decade
Rain: +0.008 in/decade
50-Year Trend
High: +0.84 °F/decade
Low: +1.26 °F/decade
Rain: +0.006 in/decade
All-Time Trend
High: +0.84 °F/decade
Low: +1.26 °F/decade
Rain: +0.006 in/decade
Percentage Above-Average Days
Last 12 Months: 54.8%
This Year: 46.2%
Precipitation Concentration Index (PCI) ℹ️
Last 12 Months: 13.6
Historical Average: 17.1
Percentile Rank of Last 12 Months ℹ️
High: 80th percentile
Low: 97th percentile
Rain: 98th percentile
Change in Variance ℹ️
High: -18.6%
Low: -38.8%
Intraday: -24.3%
Data Coverage
99.0%
First Year of Data
1973
Station Location
Historical Weather Records
| Max High | Avg High | Min High | Max Avg | Avg Avg | Min Avg | Max Low | Avg Low | Min Low | Max Precipitation | Avg Precipitation | Max Snow | Avg Snow | |
|---|---|---|---|---|---|---|---|---|---|---|---|---|---|
| Record | 99.68 °F | — | 45.63 °F | 84.38 °F | — | 34.56 °F | 69.08 °F | — | 24.21 °F | 2.54 in | — | — | — |
| January | 83.84 °F | 70.26 °F | 45.93 °F | 70.88 °F | 56.18 °F | 34.56 °F | 55.22 °F | 43.16 °F | 24.21 °F | 0.61 in | 0.01 in | — | — |
| February | 87.44 °F | 73.67 °F | 48.07 °F | 75.02 °F | 59.15 °F | 42.13 °F | 58.28 °F | 45.20 °F | 26.15 °F | 1.32 in | 0.01 in | — | — |
| March | 91.94 °F | 77.60 °F | 53.82 °F | 78.98 °F | 62.59 °F | 41.04 °F | 64.58 °F | 48.08 °F | 24.21 °F | 0.84 in | 0.02 in | — | — |
| April | 97.52 °F | 80.09 °F | 57.33 °F | 84.38 °F | 65.34 °F | 51.28 °F | 69.08 °F | 51.76 °F | 37.13 °F | 0.66 in | 0.03 in | — | — |
| May | 99.68 °F | 80.39 °F | 62.64 °F | 84.02 °F | 66.24 °F | 52.79 °F | 68.36 °F | 53.84 °F | 36.64 °F | 2.01 in | 0.07 in | — | — |
| June | 92.84 °F | 76.96 °F | 60.80 °F | 83.48 °F | 64.59 °F | 52.86 °F | 67.28 °F | 54.45 °F | 39.69 °F | 1.53 in | 0.18 in | — | — |
| July | 85.28 °F | 74.12 °F | 61.45 °F | 73.40 °F | 62.16 °F | 53.24 °F | 60.80 °F | 52.65 °F | 39.79 °F | 2.54 in | 0.19 in | — | — |
| August | 95.00 °F | 74.27 °F | 57.09 °F | 75.56 °F | 62.20 °F | 52.41 °F | 60.80 °F | 52.98 °F | 39.58 °F | 2.24 in | 0.18 in | — | — |
| September | 85.46 °F | 72.75 °F | 55.80 °F | 75.92 °F | 61.45 °F | 48.94 °F | 60.80 °F | 52.64 °F | 32.99 °F | 2.44 in | 0.19 in | — | — |
| October | 84.92 °F | 72.29 °F | 45.63 °F | 72.50 °F | 60.29 °F | 43.47 °F | 60.80 °F | 50.10 °F | 30.67 °F | 1.43 in | 0.08 in | — | — |
| November | 86.36 °F | 71.71 °F | 49.26 °F | 73.76 °F | 58.56 °F | 39.43 °F | 59.72 °F | 46.43 °F | 25.93 °F | 0.56 in | 0.02 in | — | — |
| December | 82.58 °F | 70.04 °F | 50.13 °F | 70.34 °F | 56.24 °F | 41.90 °F | 55.76 °F | 43.92 °F | 26.85 °F | 0.58 in | 0.01 in | — | — |
Data Visualisations
Remove WatermarksCurrent Year Climate Trends vs Historical


Max Temperature this Year | 1 of 6
Climate 12-Month Moving Averages


Max Temperature 12-Month MA | 1 of 6
Daily Data Points and Averages Throughout the Year


Average Max Temperature Throughout Year | 1 of 5
