Climate for Station: Christchurch Intl, Canterbury, New Zealand
Loading live weather...
Climate Analysis & Overview
Christchurch International Airport's climate data reveals a nuanced picture of warming and cooling trends over different timescales. While the all-time data shows a slight warming in high temperatures, the past decade has seen a cooling trend. Precipitation patterns have become more evenly distributed, reflecting a modest change in local climate dynamics.
A Tale of Two Temperature Trends
Christchurch International Airport, located at -43.49° latitude and 172.53° longitude, experiences a temperate oceanic climate (Cfb) under the Köppen classification. The surrounding geography, including the Southern Alps and the Canterbury Plains, significantly influences local weather patterns. Over the past decade, the airport has observed a cooling trend in both high and low temperatures, with highs decreasing by 0.47°C (0.85°F) and lows by 0.43°C (0.77°F). This contrasts with the all-time data, which shows a slight warming trend in high temperatures by 0.20°C (0.36°F), while lows have fallen by 0.07°C (0.13°F). This divergence highlights the complex interplay between short-term climatic fluctuations and longer-term trends.
Precipitation Patterns: A More Even Distribution
The Precipitation Concentration Index (PCI) at Christchurch has seen a decrease from a baseline of 10.65 to a current value of 8.75. This indicates that rainfall is now more evenly distributed throughout the year, as a PCI under 10 suggests a very even spread of precipitation events. This marginal change in PCI reflects a shift towards more consistent rainfall, which can have significant implications for agriculture and water management in the region.
Record Extremes: The Temperature Bookends
Christchurch International Airport has recorded some notable temperature extremes, with an all-time high of 37.1°C (98.8°F) and a record low of -7.0°C (19.4°F). These extremes underscore the variability inherent in the region's climate, influenced by both local geographical features and broader climatic systems. Such variability is critical for understanding the potential impacts of climate change on local weather patterns.
Regional Climate Context and Implications
New Zealand's commitment to reducing greenhouse gas emissions and adapting to climate change provides a backdrop to these observations. The country's climate goals aim to mitigate the impacts of such temperature and precipitation changes. Recent weather events, such as increased rainfall intensity and frequency, align with the observed decrease in PCI, suggesting that the region is experiencing shifts in its precipitation regime. These changes necessitate adaptive strategies to manage water resources and agricultural practices effectively.
Navigating the Climate Future
As Christchurch continues to navigate its climate future, understanding these trends is crucial for local policymakers and stakeholders. The interplay between short-term cooling and long-term warming trends, coupled with more evenly distributed precipitation, paints a complex picture of climate dynamics at Christchurch International Airport. This data-driven approach provides a foundation for informed decision-making in the face of evolving climatic conditions.
Station Statistics
10-Year Trend
High: -0.73 °F/decade
Low: -1.19 °F/decade
Rain: +0.024 in/decade
25-Year Trend
High: +0.85 °F/decade
Low: +0.13 °F/decade
Rain: +0.013 in/decade
50-Year Trend
High: +0.50 °F/decade
Low: -0.12 °F/decade
Rain: -0.010 in/decade
All-Time Trend
High: +0.37 °F/decade
Low: -0.16 °F/decade
Rain: -0.010 in/decade
Percentage Above-Average Days
Last 12 Months: 53.6%
This Year: 50.3%
Precipitation Concentration Index (PCI) ℹ️
Last 12 Months: 9.9
Historical Average: 11.3
Percentile Rank of Last 12 Months ℹ️
High: 70th percentile
Low: 56th percentile
Rain: 70th percentile
Change in Variance ℹ️
High: +20.3%
Low: +9.3%
Intraday: +33.5%
Data Coverage
88.3%
First Year of Data
1954
Station Location
Historical Weather Records
| Max High | Avg High | Min High | Max Avg | Avg Avg | Min Avg | Max Low | Avg Low | Min Low | Max Precipitation | Avg Precipitation | Max Snow | Avg Snow | |
|---|---|---|---|---|---|---|---|---|---|---|---|---|---|
| Record | 98.78 °F | — | 34.70 °F | 85.46 °F | — | 29.12 °F | 69.80 °F | — | 19.40 °F | 2.91 in | — | — | — |
| January | 98.78 °F | 71.11 °F | 55.94 °F | 80.78 °F | 62.06 °F | 40.64 °F | 68.00 °F | 52.92 °F | 33.80 °F | 2.36 in | 0.08 in | — | — |
| February | 96.80 °F | 70.68 °F | 53.42 °F | 85.46 °F | 61.41 °F | 36.32 °F | 68.00 °F | 52.55 °F | 34.70 °F | 2.36 in | 0.08 in | — | — |
| March | 89.60 °F | 67.46 °F | 52.34 °F | 76.82 °F | 58.40 °F | 42.26 °F | 68.54 °F | 49.49 °F | 29.66 °F | 1.85 in | 0.08 in | — | — |
| April | 85.82 °F | 63.07 °F | 45.68 °F | 74.12 °F | 53.40 °F | 37.22 °F | 63.50 °F | 44.30 °F | 24.80 °F | 2.91 in | 0.09 in | — | — |
| May | 79.88 °F | 58.04 °F | 41.36 °F | 68.36 °F | 48.37 °F | 33.44 °F | 58.64 °F | 39.61 °F | 20.48 °F | 2.49 in | 0.09 in | — | — |
| June | 72.50 °F | 53.43 °F | 38.66 °F | 62.24 °F | 43.53 °F | 29.12 °F | 55.40 °F | 35.54 °F | 21.02 °F | 2.83 in | 0.11 in | — | — |
| July | 72.32 °F | 52.63 °F | 37.78 °F | 61.16 °F | 42.60 °F | 30.38 °F | 52.34 °F | 34.36 °F | 19.40 °F | 2.59 in | 0.10 in | — | — |
| August | 71.96 °F | 54.41 °F | 34.70 °F | 61.88 °F | 44.92 °F | 31.82 °F | 53.96 °F | 36.51 °F | 21.02 °F | 2.44 in | 0.09 in | — | — |
| September | 79.16 °F | 58.21 °F | 41.54 °F | 66.20 °F | 48.72 °F | 35.24 °F | 59.00 °F | 39.61 °F | 23.36 °F | 1.57 in | 0.07 in | — | — |
| October | 84.38 °F | 61.72 °F | 42.80 °F | 73.40 °F | 52.51 °F | 37.94 °F | 60.80 °F | 43.09 °F | 24.80 °F | 2.03 in | 0.08 in | — | — |
| November | 88.52 °F | 65.12 °F | 46.76 °F | 75.02 °F | 56.09 °F | 37.58 °F | 65.48 °F | 46.64 °F | 27.14 °F | 2.52 in | 0.08 in | — | — |
| December | 96.80 °F | 68.45 °F | 50.54 °F | 78.08 °F | 59.75 °F | 42.08 °F | 69.80 °F | 50.79 °F | 32.18 °F | 2.68 in | 0.09 in | — | — |
Data Visualisations
Remove WatermarksCurrent Year Climate Trends vs Historical


Max Temperature this Year | 1 of 6
Climate 12-Month Moving Averages


Max Temperature 12-Month MA | 1 of 6
Daily Data Points and Averages Throughout the Year

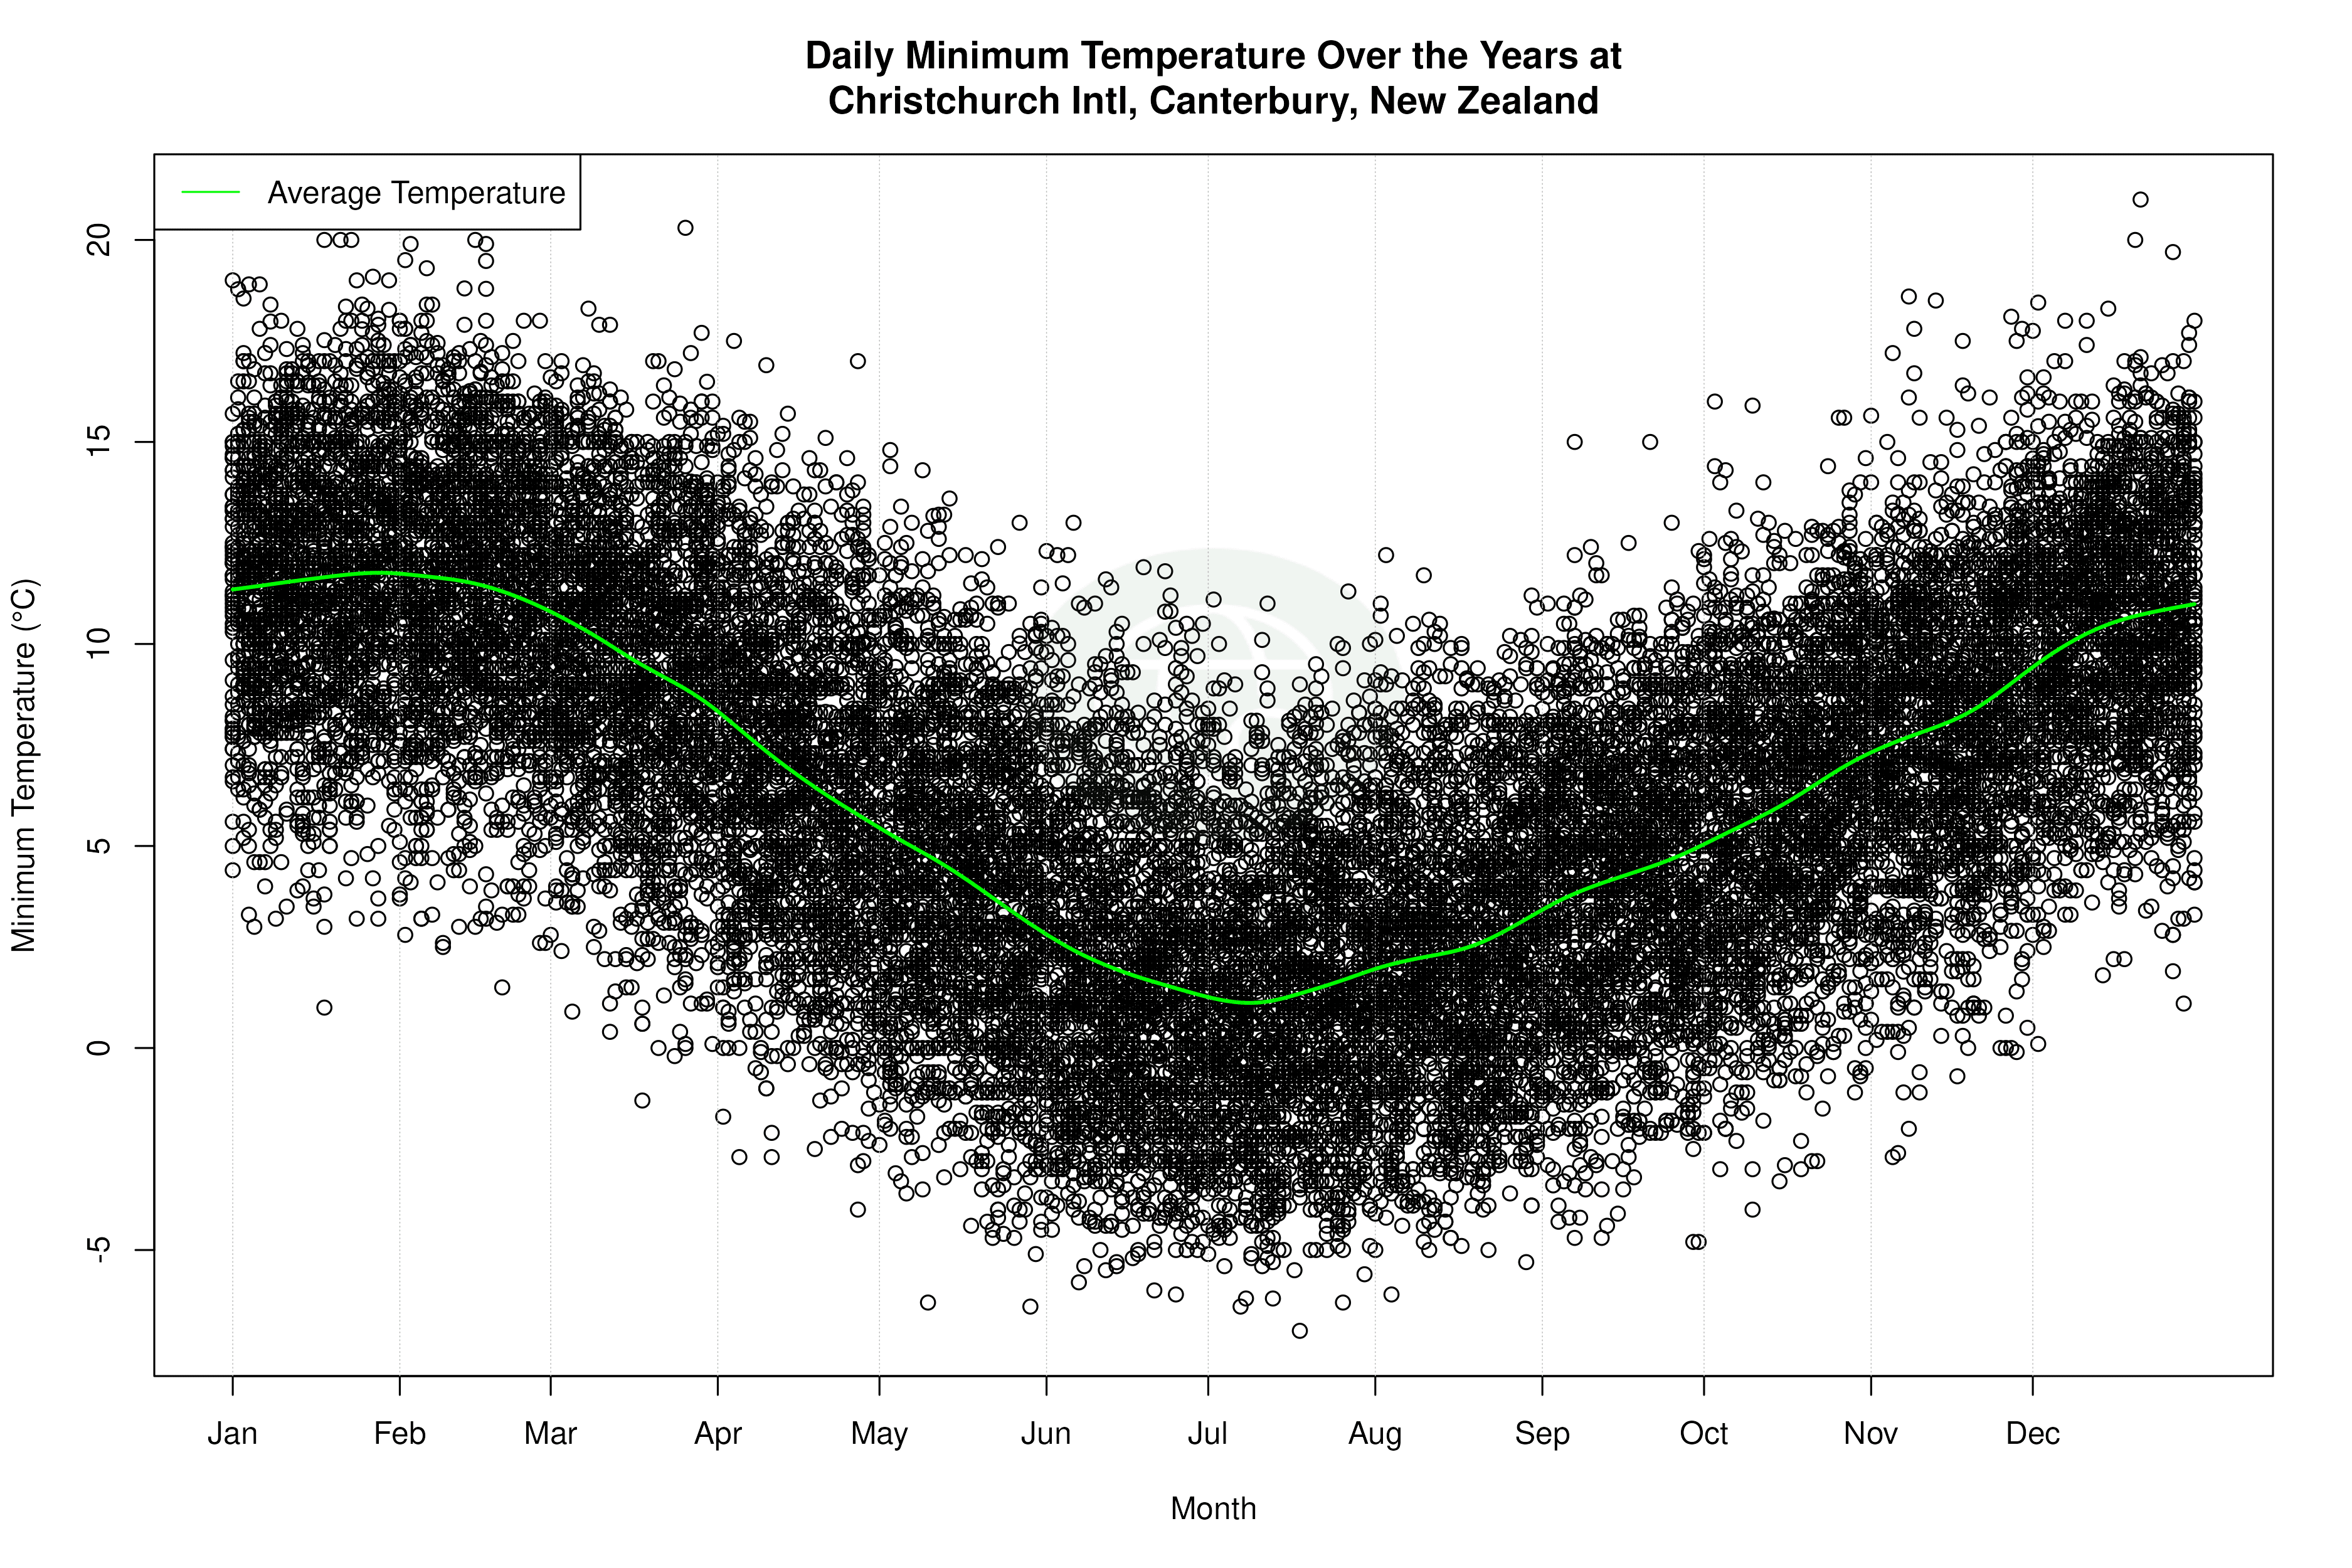

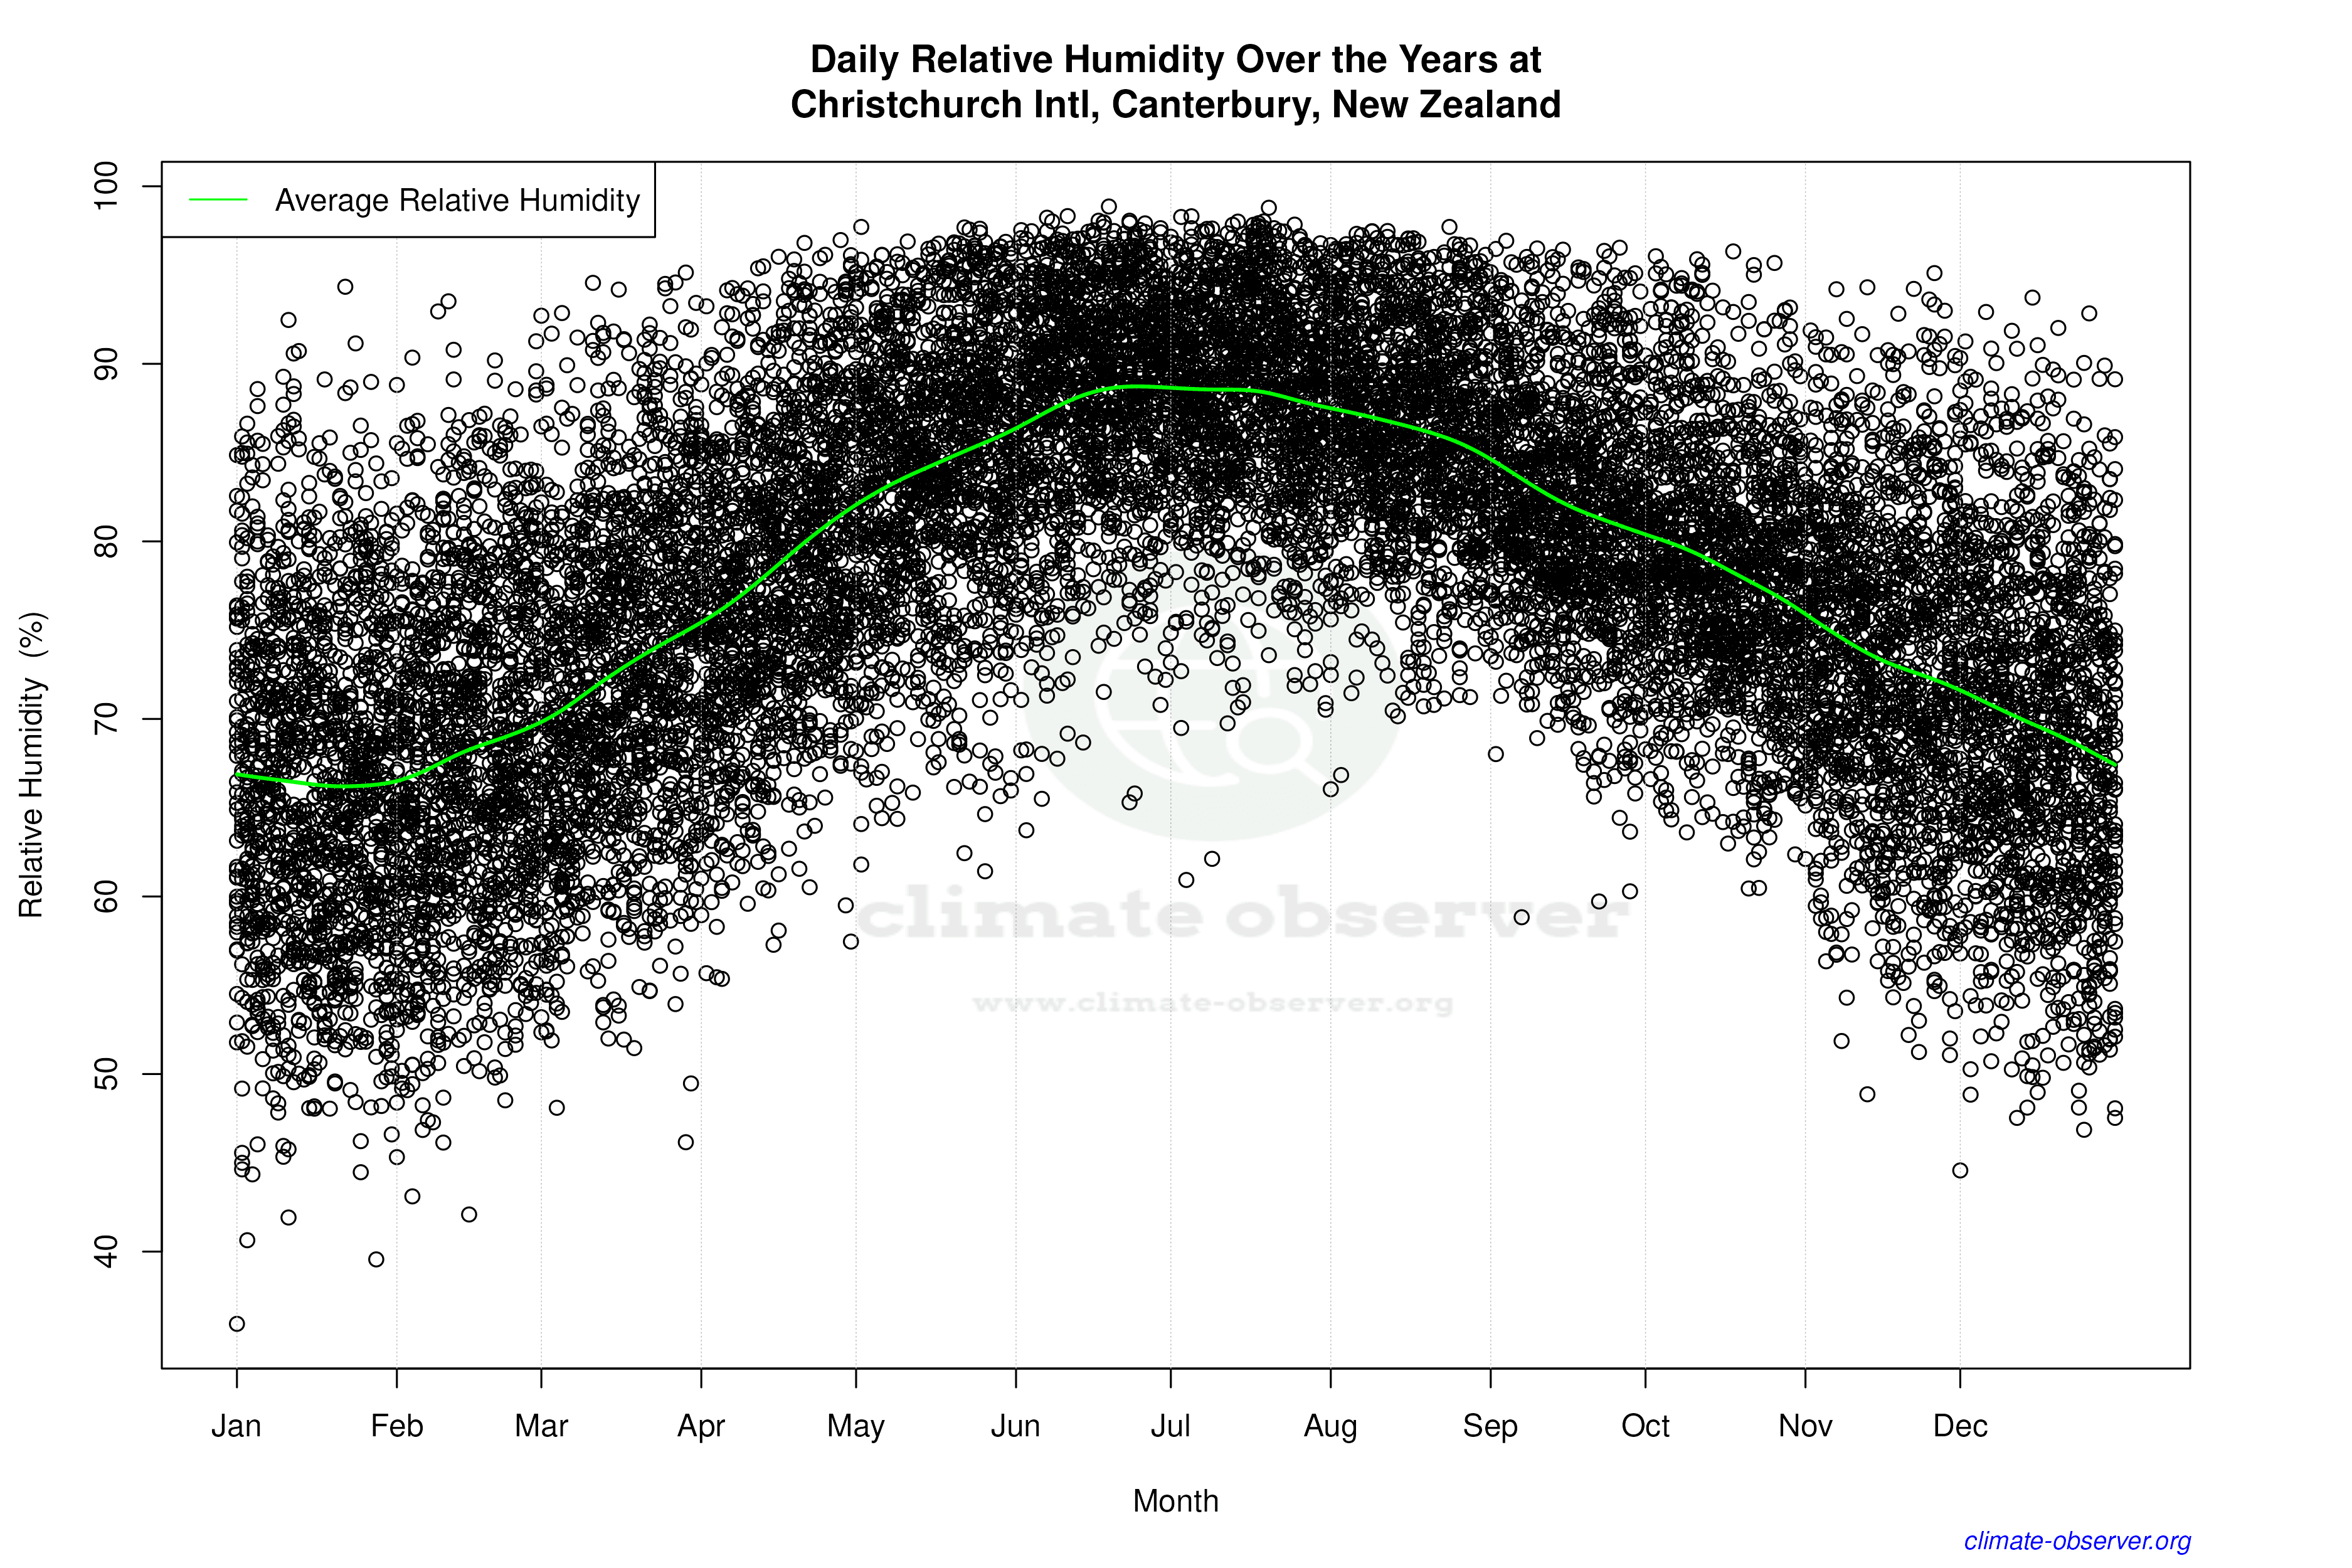

Average Max Temperature Throughout Year | 1 of 5
