Climate for Station: Balikesir, Balıkesir, Turkey
Loading live weather...
Climate Analysis & Overview
The climate profile of Balıkesir, Türkiye, reveals a warming trend in both high and low temperatures over the past decade, with a more pronounced increase in daily highs. The precipitation pattern has become slightly more evenly distributed, indicating a shift in rainfall dynamics. These changes align with regional climate goals aimed at understanding and adapting to climate variability.
Geographical Context and Climate Classification
Balıkesir, located in the Marmara Region of Türkiye, is characterised by a Mediterranean climate (Csa) according to the Köppen classification. This climate type is marked by hot, dry summers and mild, wet winters. The city's position near the Aegean Sea and the surrounding mountainous terrain significantly influence its weather patterns, contributing to distinct seasonal variations. These geographical features can enhance the warming trends observed, as they often lead to temperature inversions and localised weather phenomena.
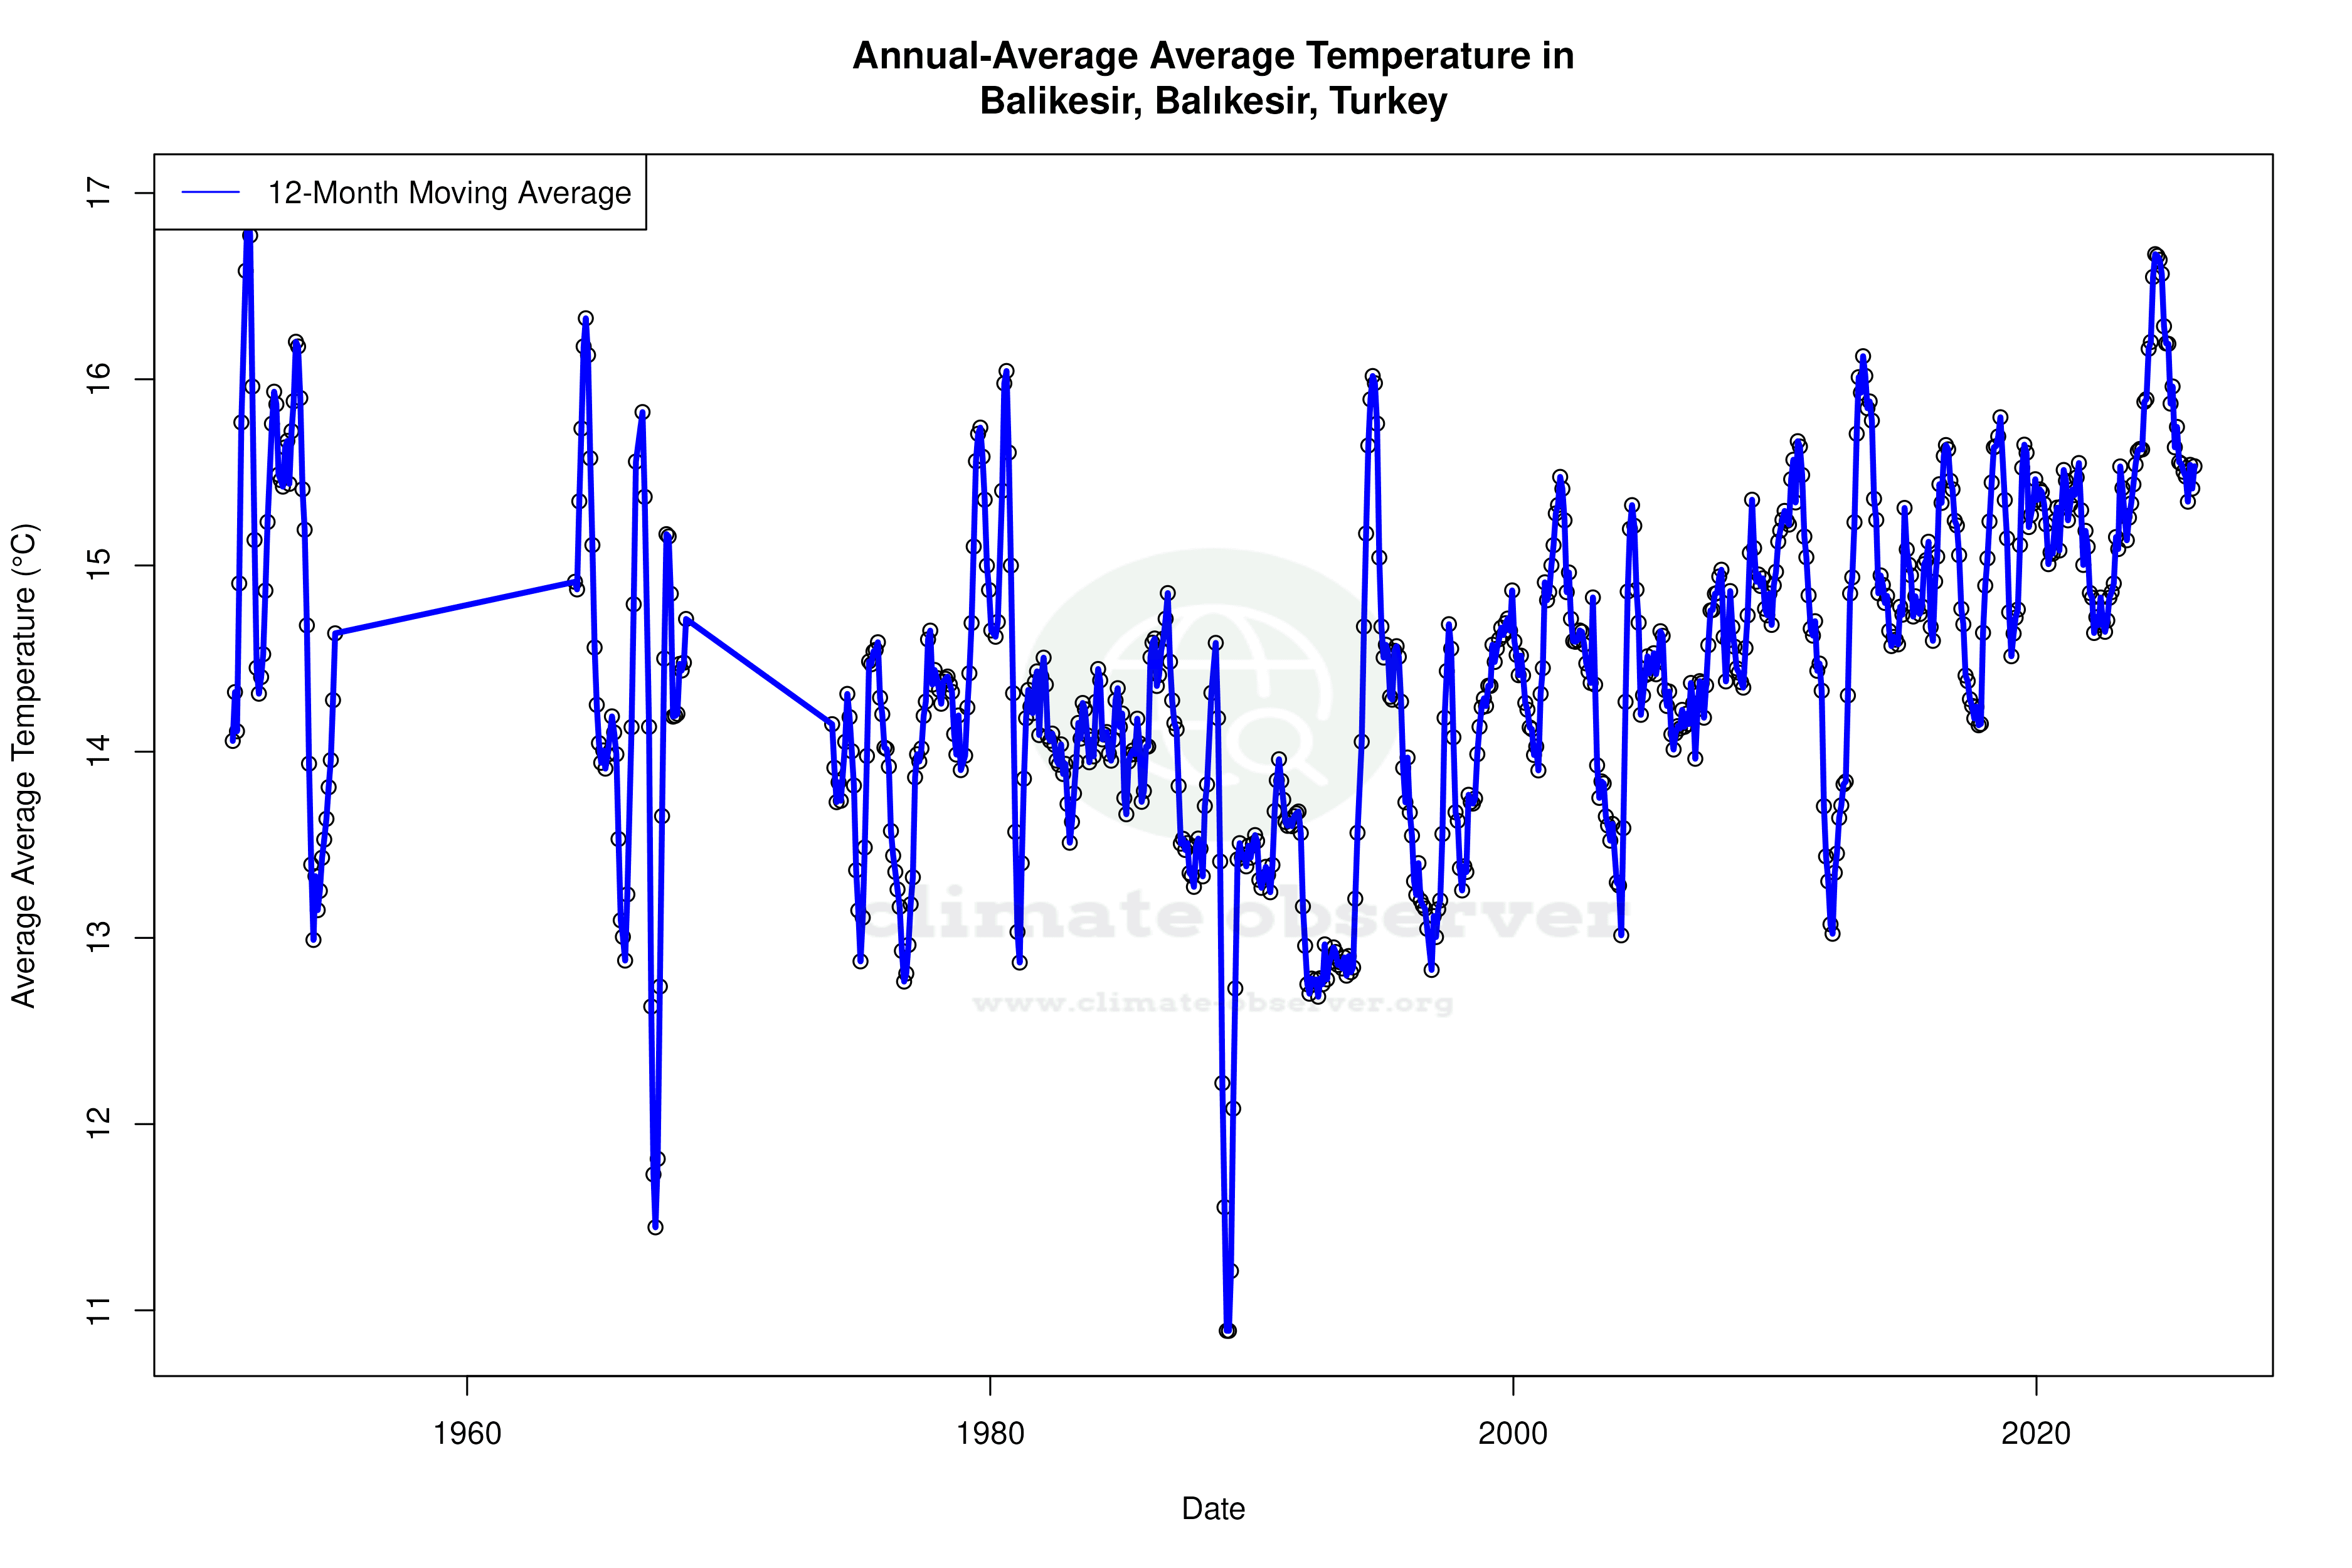
Temperature Trends: A Decade of Change
Over the past ten years, Balıkesir has experienced a noticeable rise in temperatures. The highs have increased by 0.65°C (1.17°F), while the lows have risen by 0.36°C (0.65°F). This warming trend is more pronounced in the daily highs, suggesting that daytime temperatures are becoming increasingly warmer. When considering the all-time trends, the increase is slightly less pronounced, with highs rising by 0.34°C (0.61°F) and lows by 0.35°C (0.63°F). This consistent warming aligns with broader regional trends and highlights the importance of monitoring these changes in the context of global climate dynamics.
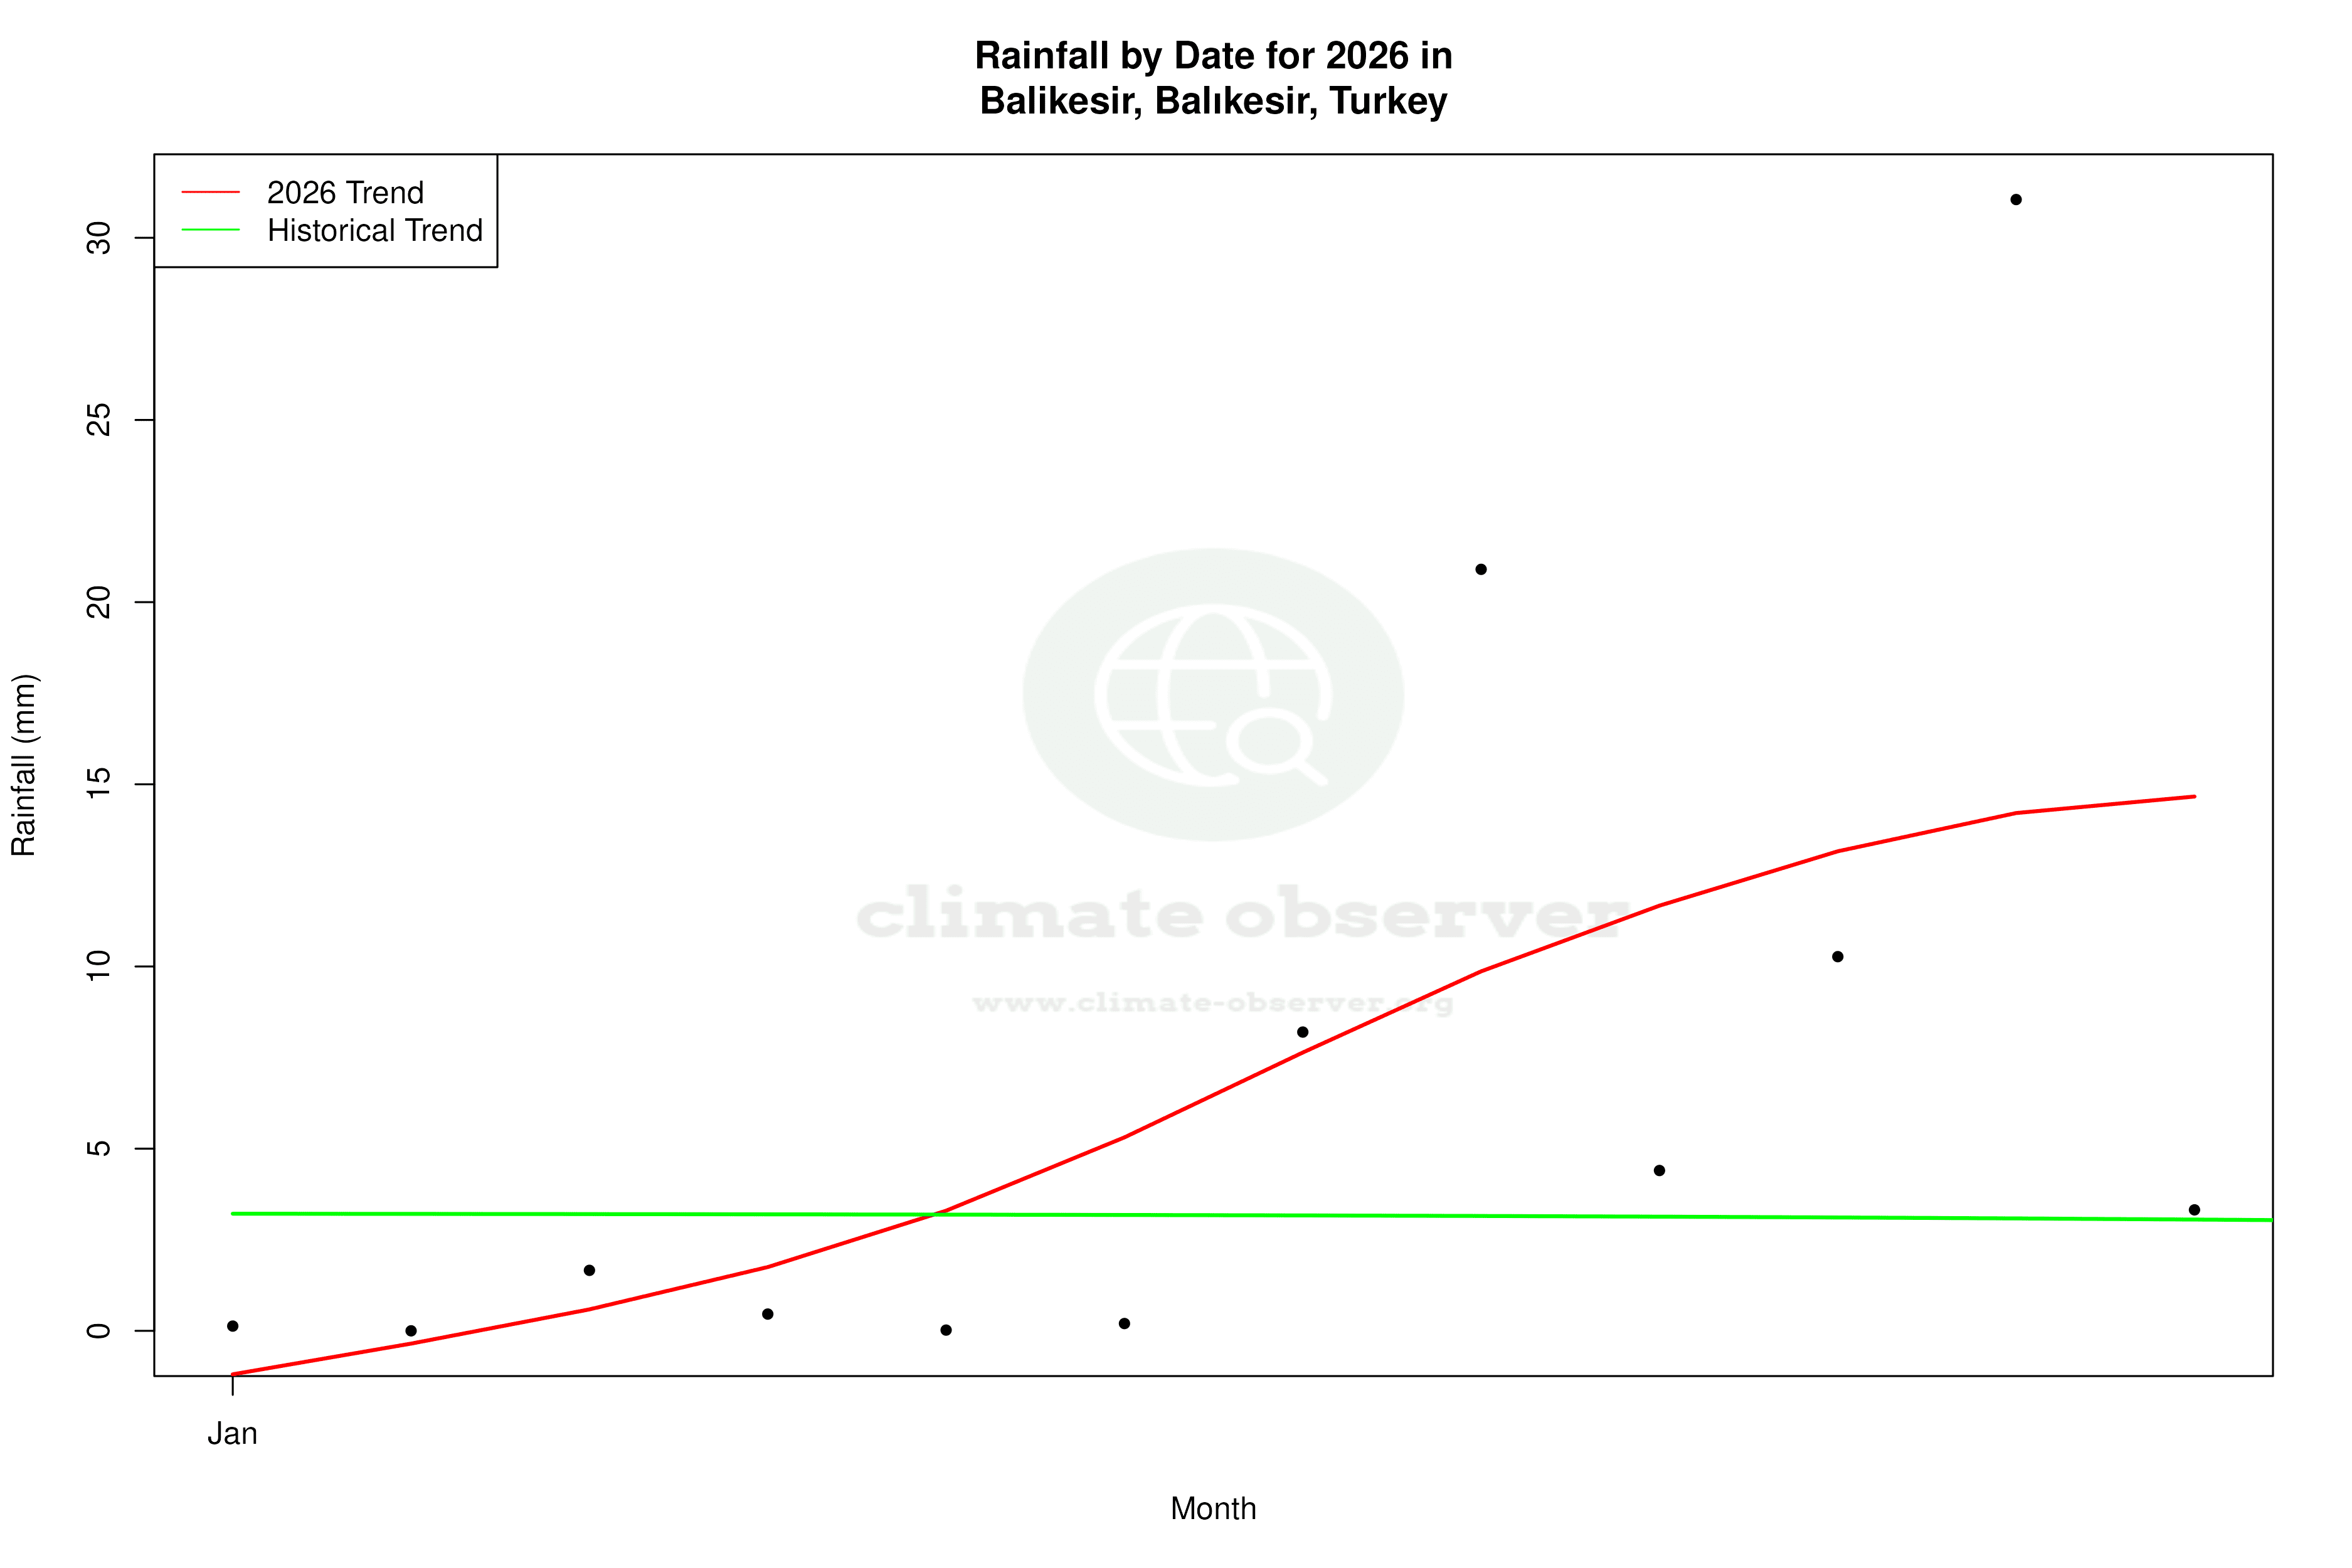
Precipitation Patterns: Shifting Dynamics
The Precipitation Concentration Index (PCI) for Balıkesir has shown a decrease from a baseline of 15.13 to the current value of 13.75. The PCI measures how rainfall is distributed over time, with lower values indicating more evenly spread precipitation. This slight decrease suggests that rainfall events in Balıkesir are becoming more evenly distributed, potentially reducing the risk of flooding from intense, concentrated rainfalls. Such changes can have significant implications for water resource management and agricultural planning in the region.
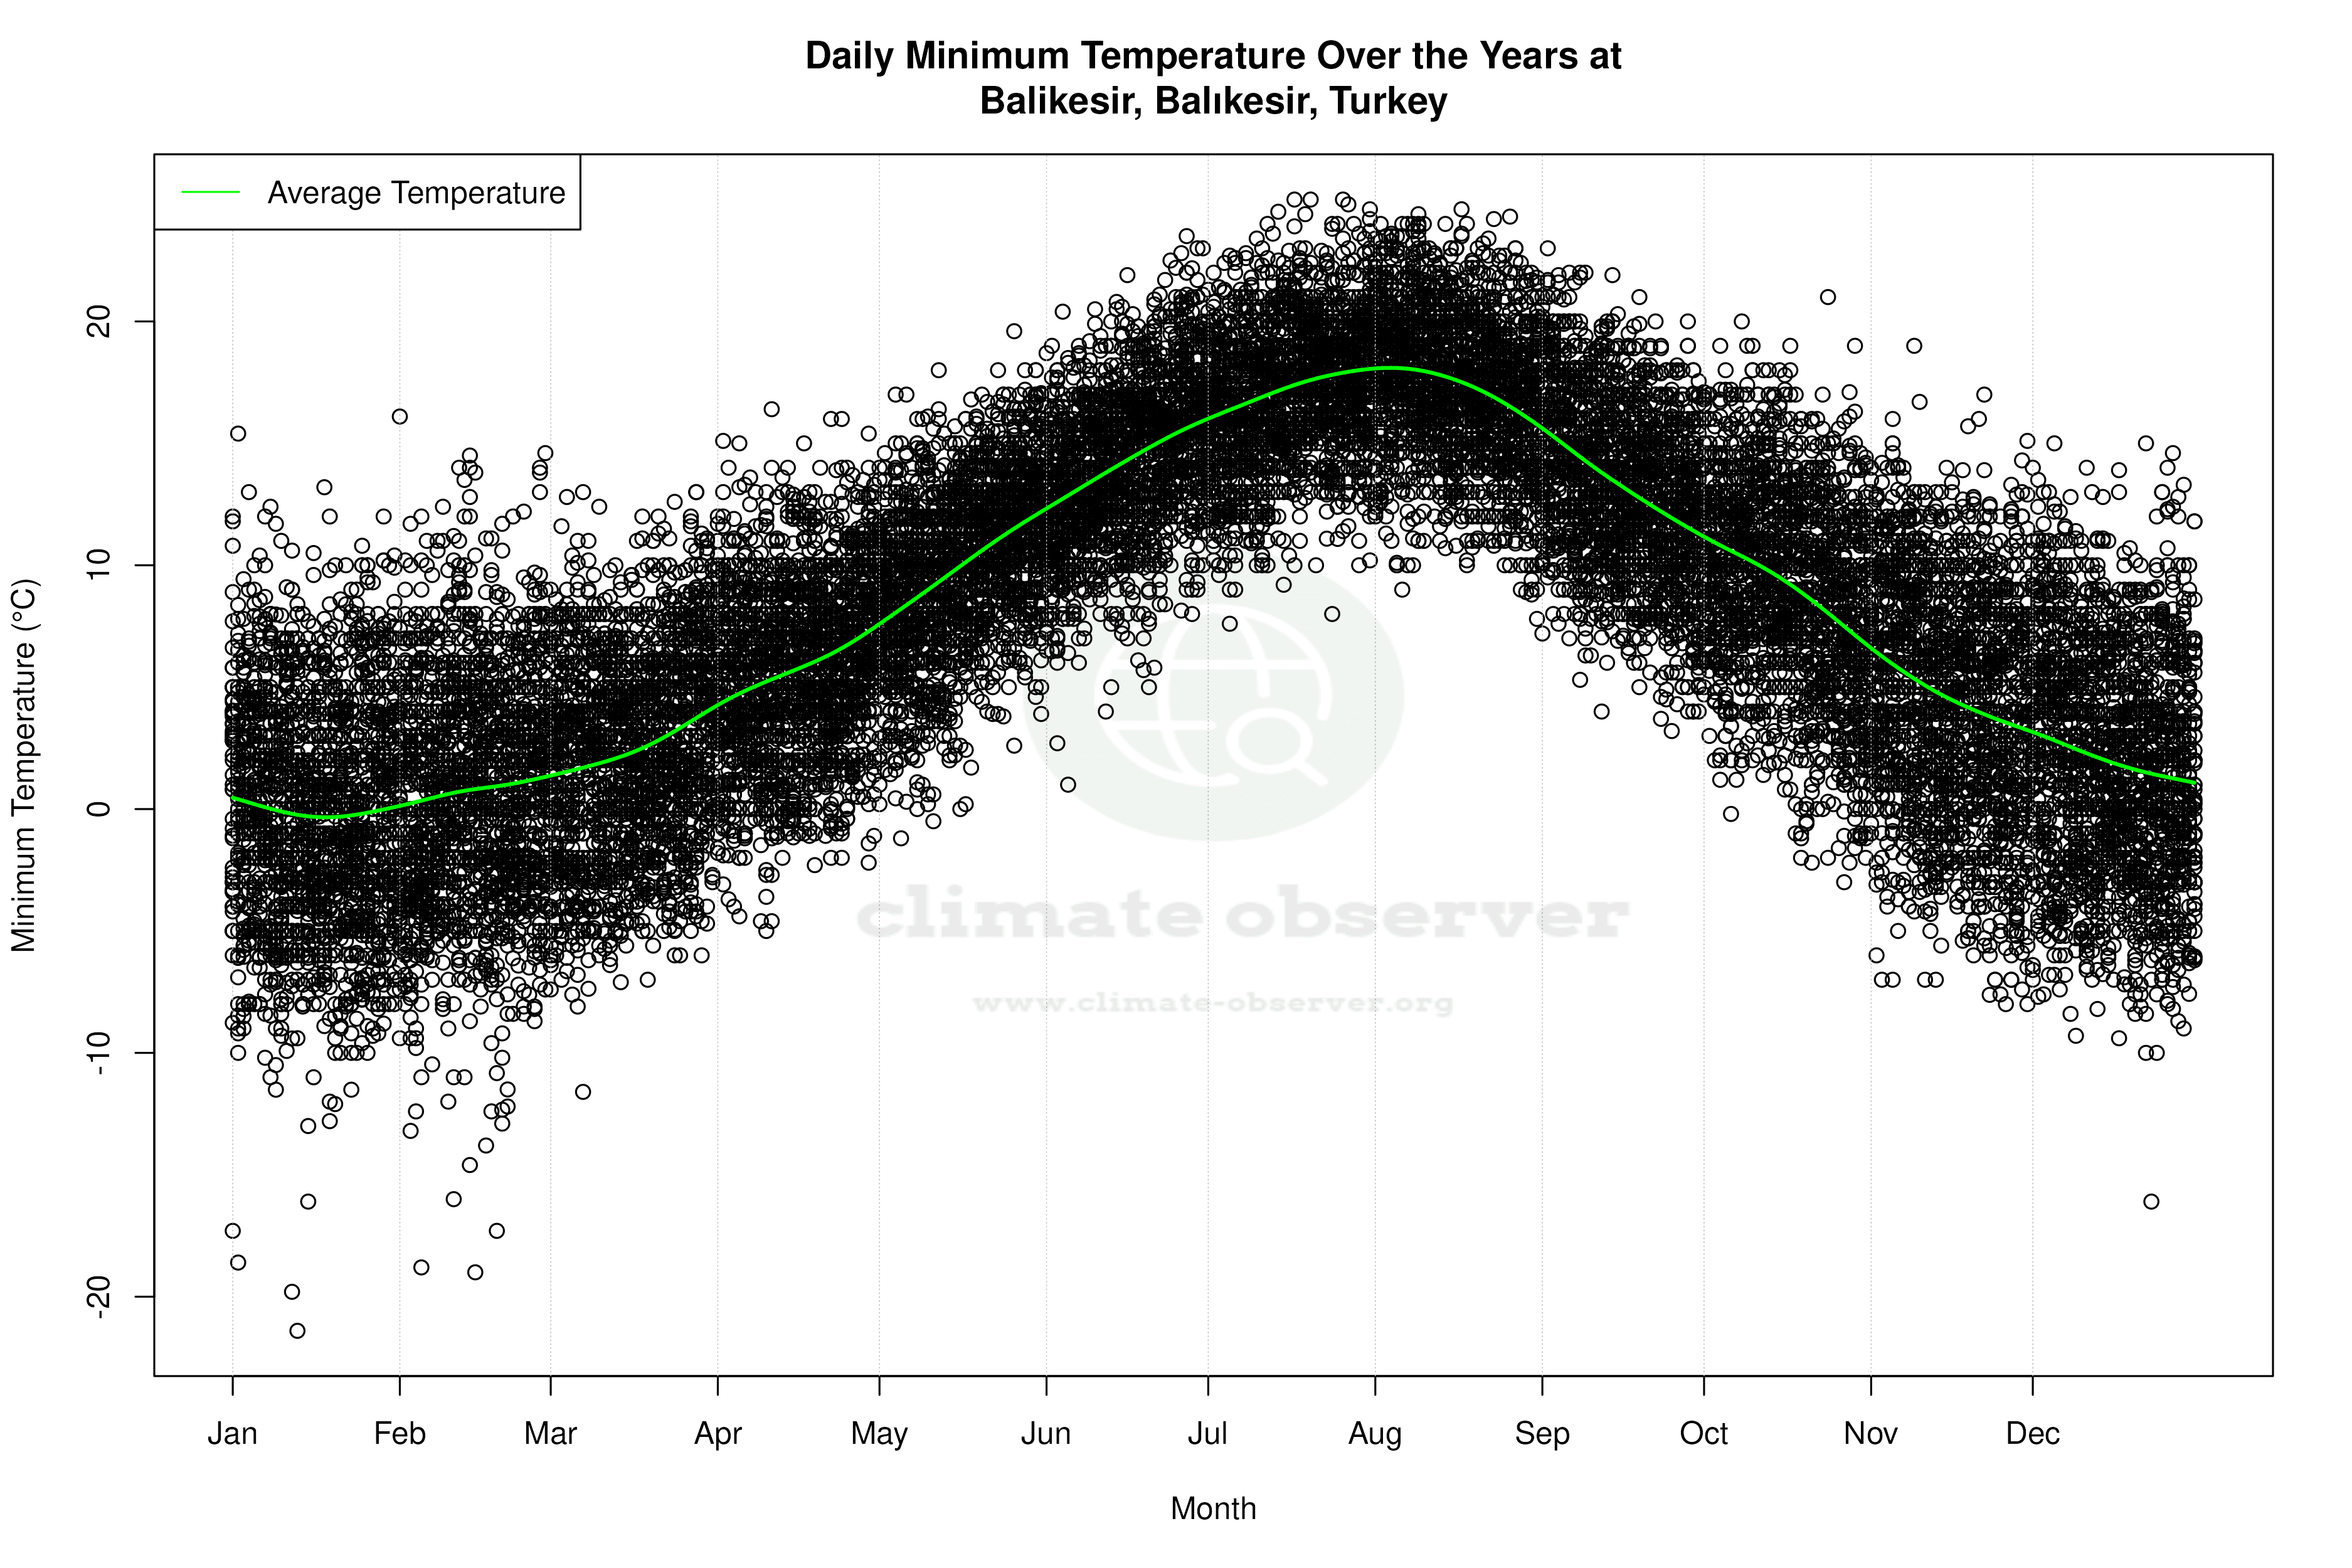
Record Extremes: A Historical Perspective
Balıkesir has experienced significant temperature extremes, with a record high of 43.2°C (109.8°F) and a record low of -21.4°C (-6.5°F). These extremes underscore the city's vulnerability to both heatwaves and cold snaps, which are critical considerations for infrastructure and public health planning. As the climate continues to warm, the frequency and intensity of these extremes may increase, necessitating proactive adaptation strategies.
Regional Implications and Climate Goals
The observed trends in Balıkesir are consistent with Türkiye's national climate goals, which focus on enhancing resilience to climate change and reducing greenhouse gas emissions. Recent regional weather events, such as heatwaves and unseasonal rainfall, further highlight the urgency of these goals. Understanding local climate dynamics is crucial for developing effective adaptation and mitigation strategies that can safeguard the region's environmental and economic well-being.
Station Statistics
10-Year Trend
High: +0.84 °F/decade
Low: +0.45 °F/decade
Rain: +0.013 in/decade
25-Year Trend
High: +0.86 °F/decade
Low: +1.27 °F/decade
Rain: +0.006 in/decade
50-Year Trend
High: +0.89 °F/decade
Low: +0.83 °F/decade
Rain: +0.001 in/decade
All-Time Trend
High: +0.57 °F/decade
Low: +0.61 °F/decade
Rain: -0.000 in/decade
Percentage Above-Average Days
Last 12 Months: 47.8%
This Year: 45.0%
Precipitation Concentration Index (PCI) ℹ️
Last 12 Months: 13.0
Historical Average: 15.0
Percentile Rank of Last 12 Months ℹ️
High: 82nd percentile
Low: 80th percentile
Rain: 59th percentile
Change in Variance ℹ️
High: -5.0%
Low: +3.9%
Intraday: +2.5%
Data Coverage
78.3%
First Year of Data
1950
Station Location
Historical Weather Records
| Max High | Avg High | Min High | Max Avg | Avg Avg | Min Avg | Max Low | Avg Low | Min Low | Max Precipitation | Avg Precipitation | Max Snow | Avg Snow | |
|---|---|---|---|---|---|---|---|---|---|---|---|---|---|
| Record | 109.76 °F | — | 19.76 °F | 90.68 °F | — | 11.12 °F | 77.00 °F | — | -6.52 °F | 6.10 in | — | — | — |
| January | 74.30 °F | 48.42 °F | 19.76 °F | 63.68 °F | 40.18 °F | 11.12 °F | 59.72 °F | 31.95 °F | -6.52 °F | 3.58 in | 0.11 in | — | — |
| February | 86.00 °F | 51.71 °F | 21.92 °F | 66.02 °F | 42.39 °F | 15.26 °F | 60.98 °F | 33.42 °F | -2.20 °F | 2.09 in | 0.09 in | — | — |
| March | 86.72 °F | 57.71 °F | 22.23 °F | 78.26 °F | 46.85 °F | 23.54 °F | 55.40 °F | 36.41 °F | 11.12 °F | 1.93 in | 0.08 in | — | — |
| April | 91.58 °F | 67.07 °F | 41.00 °F | 82.04 °F | 54.80 °F | 32.90 °F | 61.52 °F | 42.40 °F | 23.00 °F | 6.10 in | 0.08 in | — | — |
| May | 99.32 °F | 76.08 °F | 44.17 °F | 79.16 °F | 63.27 °F | 42.21 °F | 67.28 °F | 50.04 °F | 29.84 °F | 1.61 in | 0.05 in | — | — |
| June | 109.40 °F | 85.13 °F | 56.12 °F | 90.14 °F | 72.02 °F | 51.80 °F | 74.30 °F | 57.57 °F | 33.80 °F | 1.18 in | 0.03 in | — | — |
| July | 109.76 °F | 89.31 °F | 66.56 °F | 88.34 °F | 76.75 °F | 62.60 °F | 77.00 °F | 62.85 °F | 45.68 °F | 1.06 in | 0.01 in | — | — |
| August | 109.40 °F | 89.07 °F | 68.36 °F | 90.68 °F | 76.48 °F | 61.34 °F | 76.28 °F | 63.33 °F | 46.04 °F | 2.01 in | 0.01 in | — | — |
| September | 104.54 °F | 82.98 °F | 55.04 °F | 86.54 °F | 69.45 °F | 53.42 °F | 73.40 °F | 56.01 °F | 37.76 °F | 3.55 in | 0.03 in | — | — |
| October | 100.40 °F | 72.60 °F | 41.58 °F | 79.34 °F | 60.07 °F | 39.02 °F | 69.80 °F | 48.59 °F | 26.60 °F | 1.85 in | 0.06 in | — | — |
| November | 88.16 °F | 60.80 °F | 35.42 °F | 74.12 °F | 50.22 °F | 27.32 °F | 66.20 °F | 40.28 °F | 17.60 °F | 2.60 in | 0.10 in | — | — |
| December | 78.98 °F | 51.46 °F | 26.96 °F | 66.02 °F | 43.61 °F | 17.78 °F | 59.00 °F | 35.60 °F | 3.02 °F | 2.36 in | 0.12 in | — | — |
Data Visualisations
Remove WatermarksCurrent Year Climate Trends vs Historical


Max Temperature this Year | 1 of 6
Climate 12-Month Moving Averages


Max Temperature 12-Month MA | 1 of 6
Daily Data Points and Averages Throughout the Year


Average Max Temperature Throughout Year | 1 of 5
