Climate for Station: Tamdy, Navoiy, Uzbekistan
Loading live weather...
Climate Analysis & Overview
Tamdy, located in the heart of Uzbekistan's arid landscape, is experiencing contrasting thermal trends. While the all-time temperature data suggests a slight warming, recent years have seen a marked divergence with cooling highs and warming lows. The significant increase in precipitation concentration indicates a shift towards more intense rainfall events, challenging the region's water management strategies.
Geographical and Climatic Context
Tamdy is situated in Tomdi tumani, Navoiy Viloyati, characterised by a desert climate (Köppen classification BWk), with hot summers and cold winters. The region's flat terrain and distance from large water bodies contribute to its extreme temperature variations. The local geography plays a pivotal role in shaping Tamdy's climate, with limited moisture sources leading to infrequent but intense rainfall events.
Divergent Thermal Trends
Examining the temperature trends, Tamdy presents an intriguing dichotomy. Over the past decade, the high temperatures have shown a cooling trend of -0.34°C (-0.61°F), contrasting sharply with the warming trend in low temperatures, which have increased by 2.36°C (4.24°F). This divergence suggests a narrowing of the daily temperature range, which could impact local agricultural practices and energy consumption patterns. In the broader context, the all-time data reveals a modest warming of 0.17°C (0.31°F) in highs and 0.41°C (0.74°F) in lows, indicating a general rise in temperatures over a longer period.
Precipitation Concentration Intensifies
The Precipitation Concentration Index (PCI) has seen a dramatic increase from a baseline of 20.63 to a current value of 57.31. This shift signifies a substantial concentration of rainfall into fewer, more intense events. Such a pattern poses significant challenges for water management and flood control, as infrastructure may not be equipped to handle sudden, heavy downpours. This trend towards concentrated precipitation could exacerbate drought conditions between events, impacting agriculture and water supply.
Temperature Extremes
Tamdy's climate is marked by its extreme temperatures, with a record high of 48.4°C (119.1°F) and a record low of -30.1°C (-22.2°F). These extremes highlight the region's vulnerability to both heatwaves and cold snaps, necessitating robust adaptation strategies to protect local communities and ecosystems.
Regional Climate Implications
In the context of Uzbekistan's broader climate goals, which include enhancing resilience to climate change and improving water resource management, Tamdy's evolving climate patterns underscore the need for targeted interventions. The increasing concentration of precipitation events aligns with regional concerns about water scarcity and the need for sustainable agricultural practices. As Uzbekistan continues to navigate its climate challenges, understanding and adapting to these localised trends will be crucial for future resilience.
Station Statistics
10-Year Trend
High: +3.61 °F/decade
Low: +7.89 °F/decade
Rain: -0.000 in/decade
25-Year Trend
High: -0.19 °F/decade
Low: +0.36 °F/decade
Rain: +0.001 in/decade
50-Year Trend
High: +0.61 °F/decade
Low: +0.54 °F/decade
Rain: -0.000 in/decade
All-Time Trend
High: +0.21 °F/decade
Low: +0.65 °F/decade
Rain: +0.000 in/decade
Percentage Above-Average Days
Last 12 Months: 58.8%
This Year: 67.8%
Precipitation Concentration Index (PCI) ℹ️
Last 12 Months: 21.7
Historical Average: 20.2
Percentile Rank of Last 12 Months ℹ️
High: 75th percentile
Low: 94th percentile
Rain: 76th percentile
Change in Variance ℹ️
High: -3.6%
Low: +3.4%
Intraday: -16.5%
Data Coverage
99.2%
First Year of Data
1932
Station Location
Historical Weather Records
| Max High | Avg High | Min High | Max Avg | Avg Avg | Min Avg | Max Low | Avg Low | Min Low | Max Precipitation | Avg Precipitation | Max Snow | Avg Snow | |
|---|---|---|---|---|---|---|---|---|---|---|---|---|---|
| Record | 119.12 °F | — | -11.92 °F | 104.90 °F | — | -16.96 °F | 93.92 °F | — | -22.18 °F | 1.44 in | — | — | — |
| January | 73.04 °F | 36.34 °F | -4.72 °F | 63.86 °F | 28.49 °F | -13.18 °F | 60.44 °F | 21.88 °F | -18.76 °F | 0.71 in | 0.02 in | — | — |
| February | 82.40 °F | 42.55 °F | -11.92 °F | 66.20 °F | 33.24 °F | -16.96 °F | 60.26 °F | 25.61 °F | -22.18 °F | 0.89 in | 0.02 in | — | — |
| March | 93.20 °F | 56.02 °F | 14.00 °F | 79.52 °F | 45.05 °F | 1.04 °F | 68.54 °F | 35.92 °F | -12.82 °F | 1.33 in | 0.03 in | — | — |
| April | 104.18 °F | 72.33 °F | 36.68 °F | 90.68 °F | 60.48 °F | 28.58 °F | 83.48 °F | 49.68 °F | 17.60 °F | 1.44 in | 0.03 in | — | — |
| May | 118.40 °F | 85.43 °F | 51.80 °F | 97.52 °F | 73.20 °F | 42.26 °F | 87.26 °F | 60.47 °F | 32.72 °F | 0.96 in | 0.01 in | — | — |
| June | 114.80 °F | 95.50 °F | 69.26 °F | 101.30 °F | 83.32 °F | 59.90 °F | 89.60 °F | 69.36 °F | 32.00 °F | 0.96 in | 0.00 in | — | — |
| July | 119.12 °F | 99.45 °F | 67.82 °F | 104.90 °F | 87.53 °F | 64.40 °F | 93.92 °F | 73.83 °F | 52.70 °F | 1.01 in | 0.00 in | — | — |
| August | 114.44 °F | 95.62 °F | 73.04 °F | 100.58 °F | 83.08 °F | 61.16 °F | 89.78 °F | 69.23 °F | 45.32 °F | 0.57 in | 0.00 in | — | — |
| September | 108.86 °F | 84.11 °F | 51.44 °F | 93.56 °F | 70.73 °F | 41.00 °F | 81.14 °F | 57.57 °F | 28.76 °F | 0.19 in | 0.00 in | — | — |
| October | 100.76 °F | 68.42 °F | 31.82 °F | 84.02 °F | 55.68 °F | 22.28 °F | 76.28 °F | 44.61 °F | 12.02 °F | 0.61 in | 0.01 in | — | — |
| November | 87.62 °F | 51.54 °F | 9.14 °F | 72.32 °F | 41.31 °F | -2.38 °F | 68.36 °F | 32.90 °F | -12.64 °F | 0.63 in | 0.01 in | — | — |
| December | 72.50 °F | 39.18 °F | -7.96 °F | 64.94 °F | 31.23 °F | -12.64 °F | 57.92 °F | 24.57 °F | -18.76 °F | 1.28 in | 0.02 in | — | — |
Data Visualisations
Remove WatermarksCurrent Year Climate Trends vs Historical


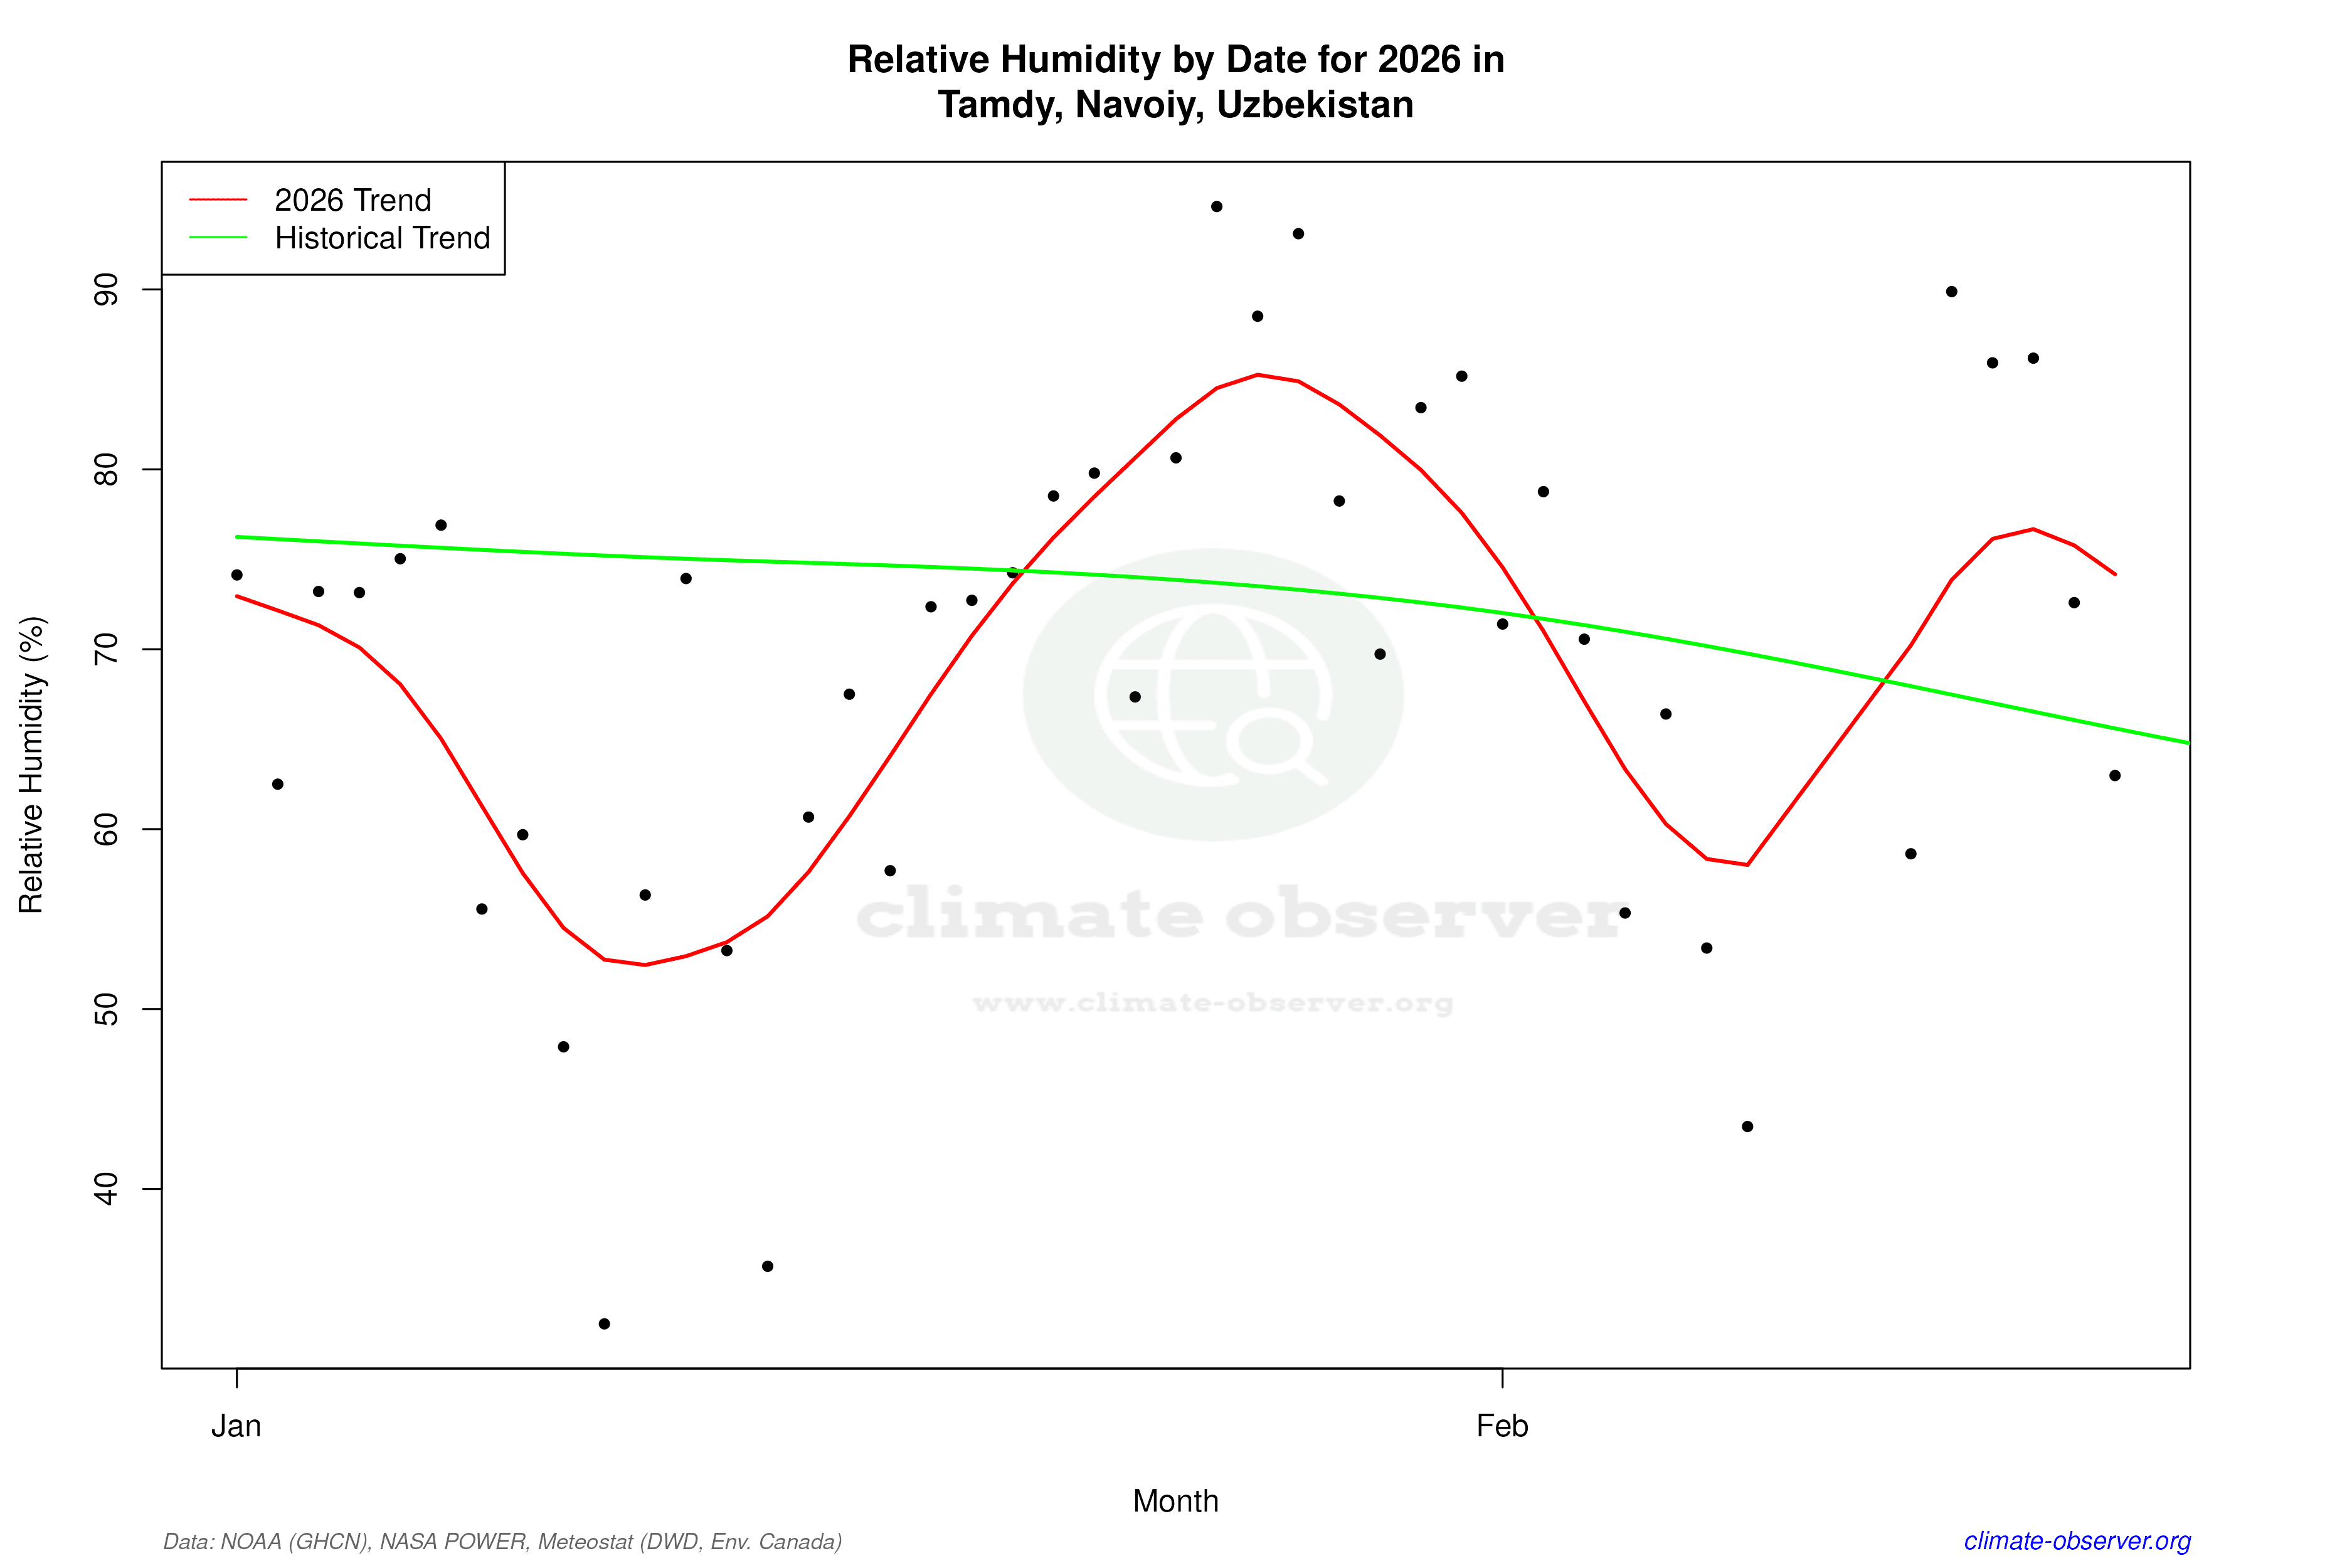

Max Temperature this Year | 1 of 6
Climate 12-Month Moving Averages


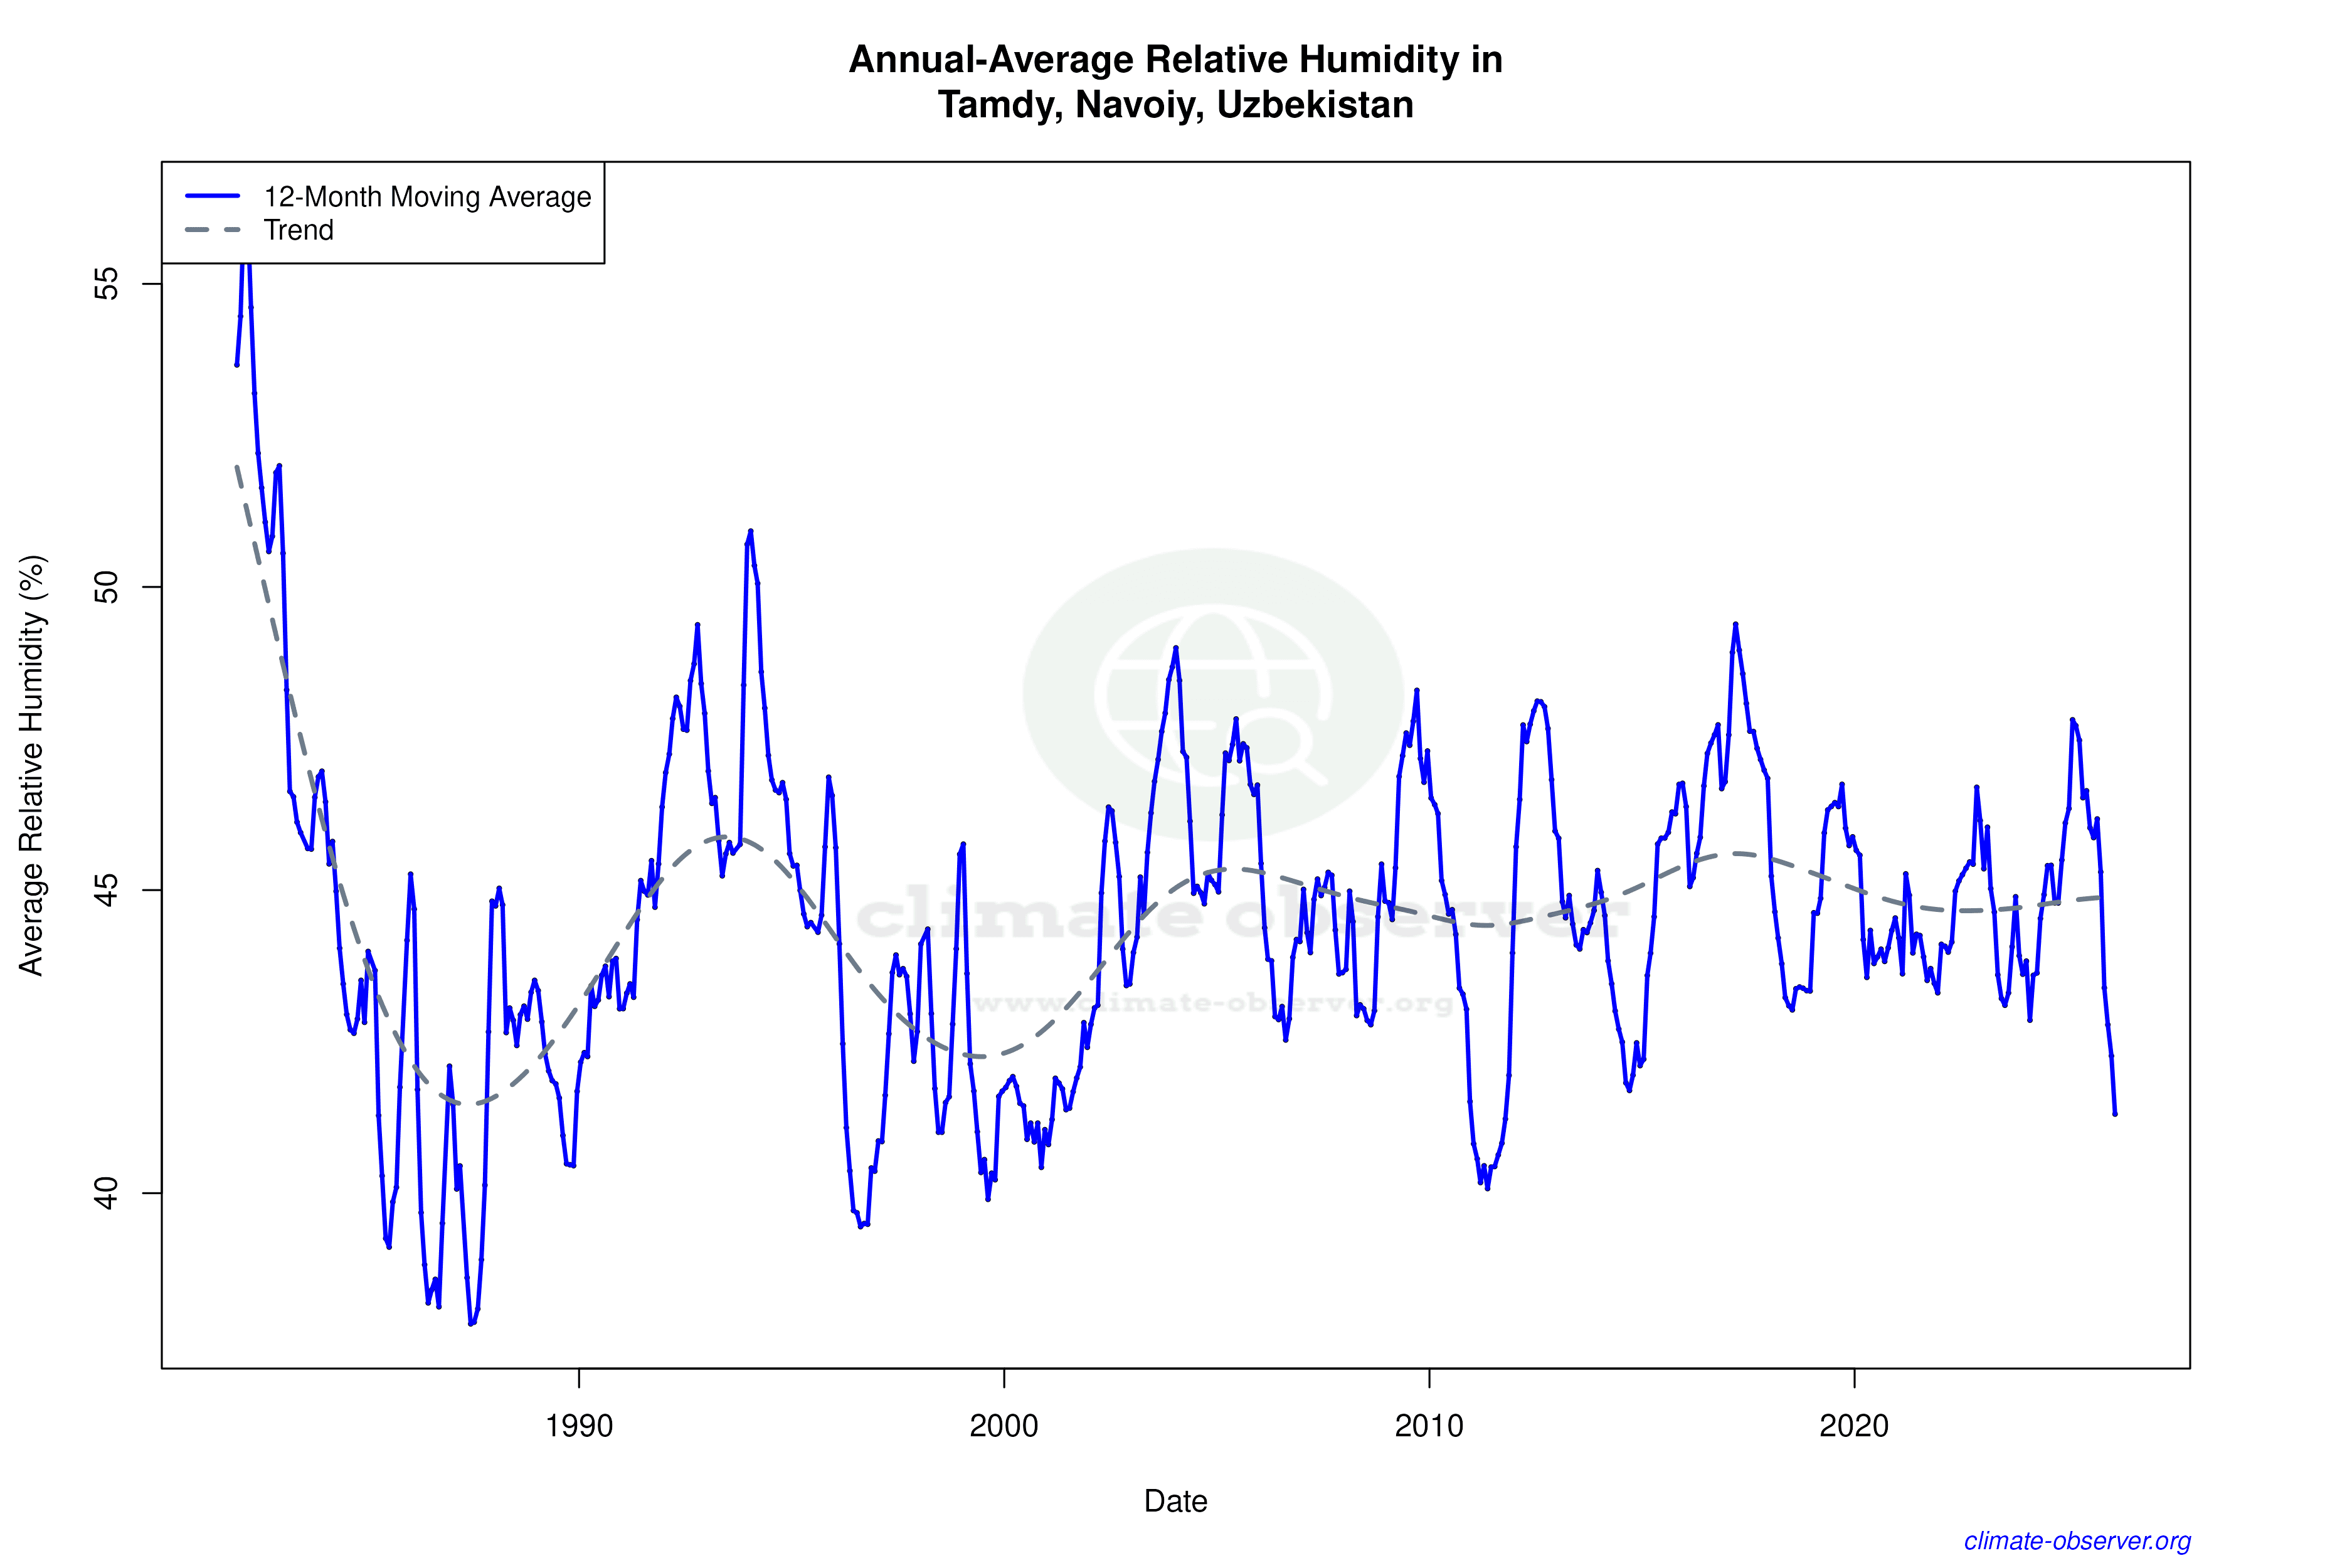

Max Temperature 12-Month MA | 1 of 6
Daily Data Points and Averages Throughout the Year


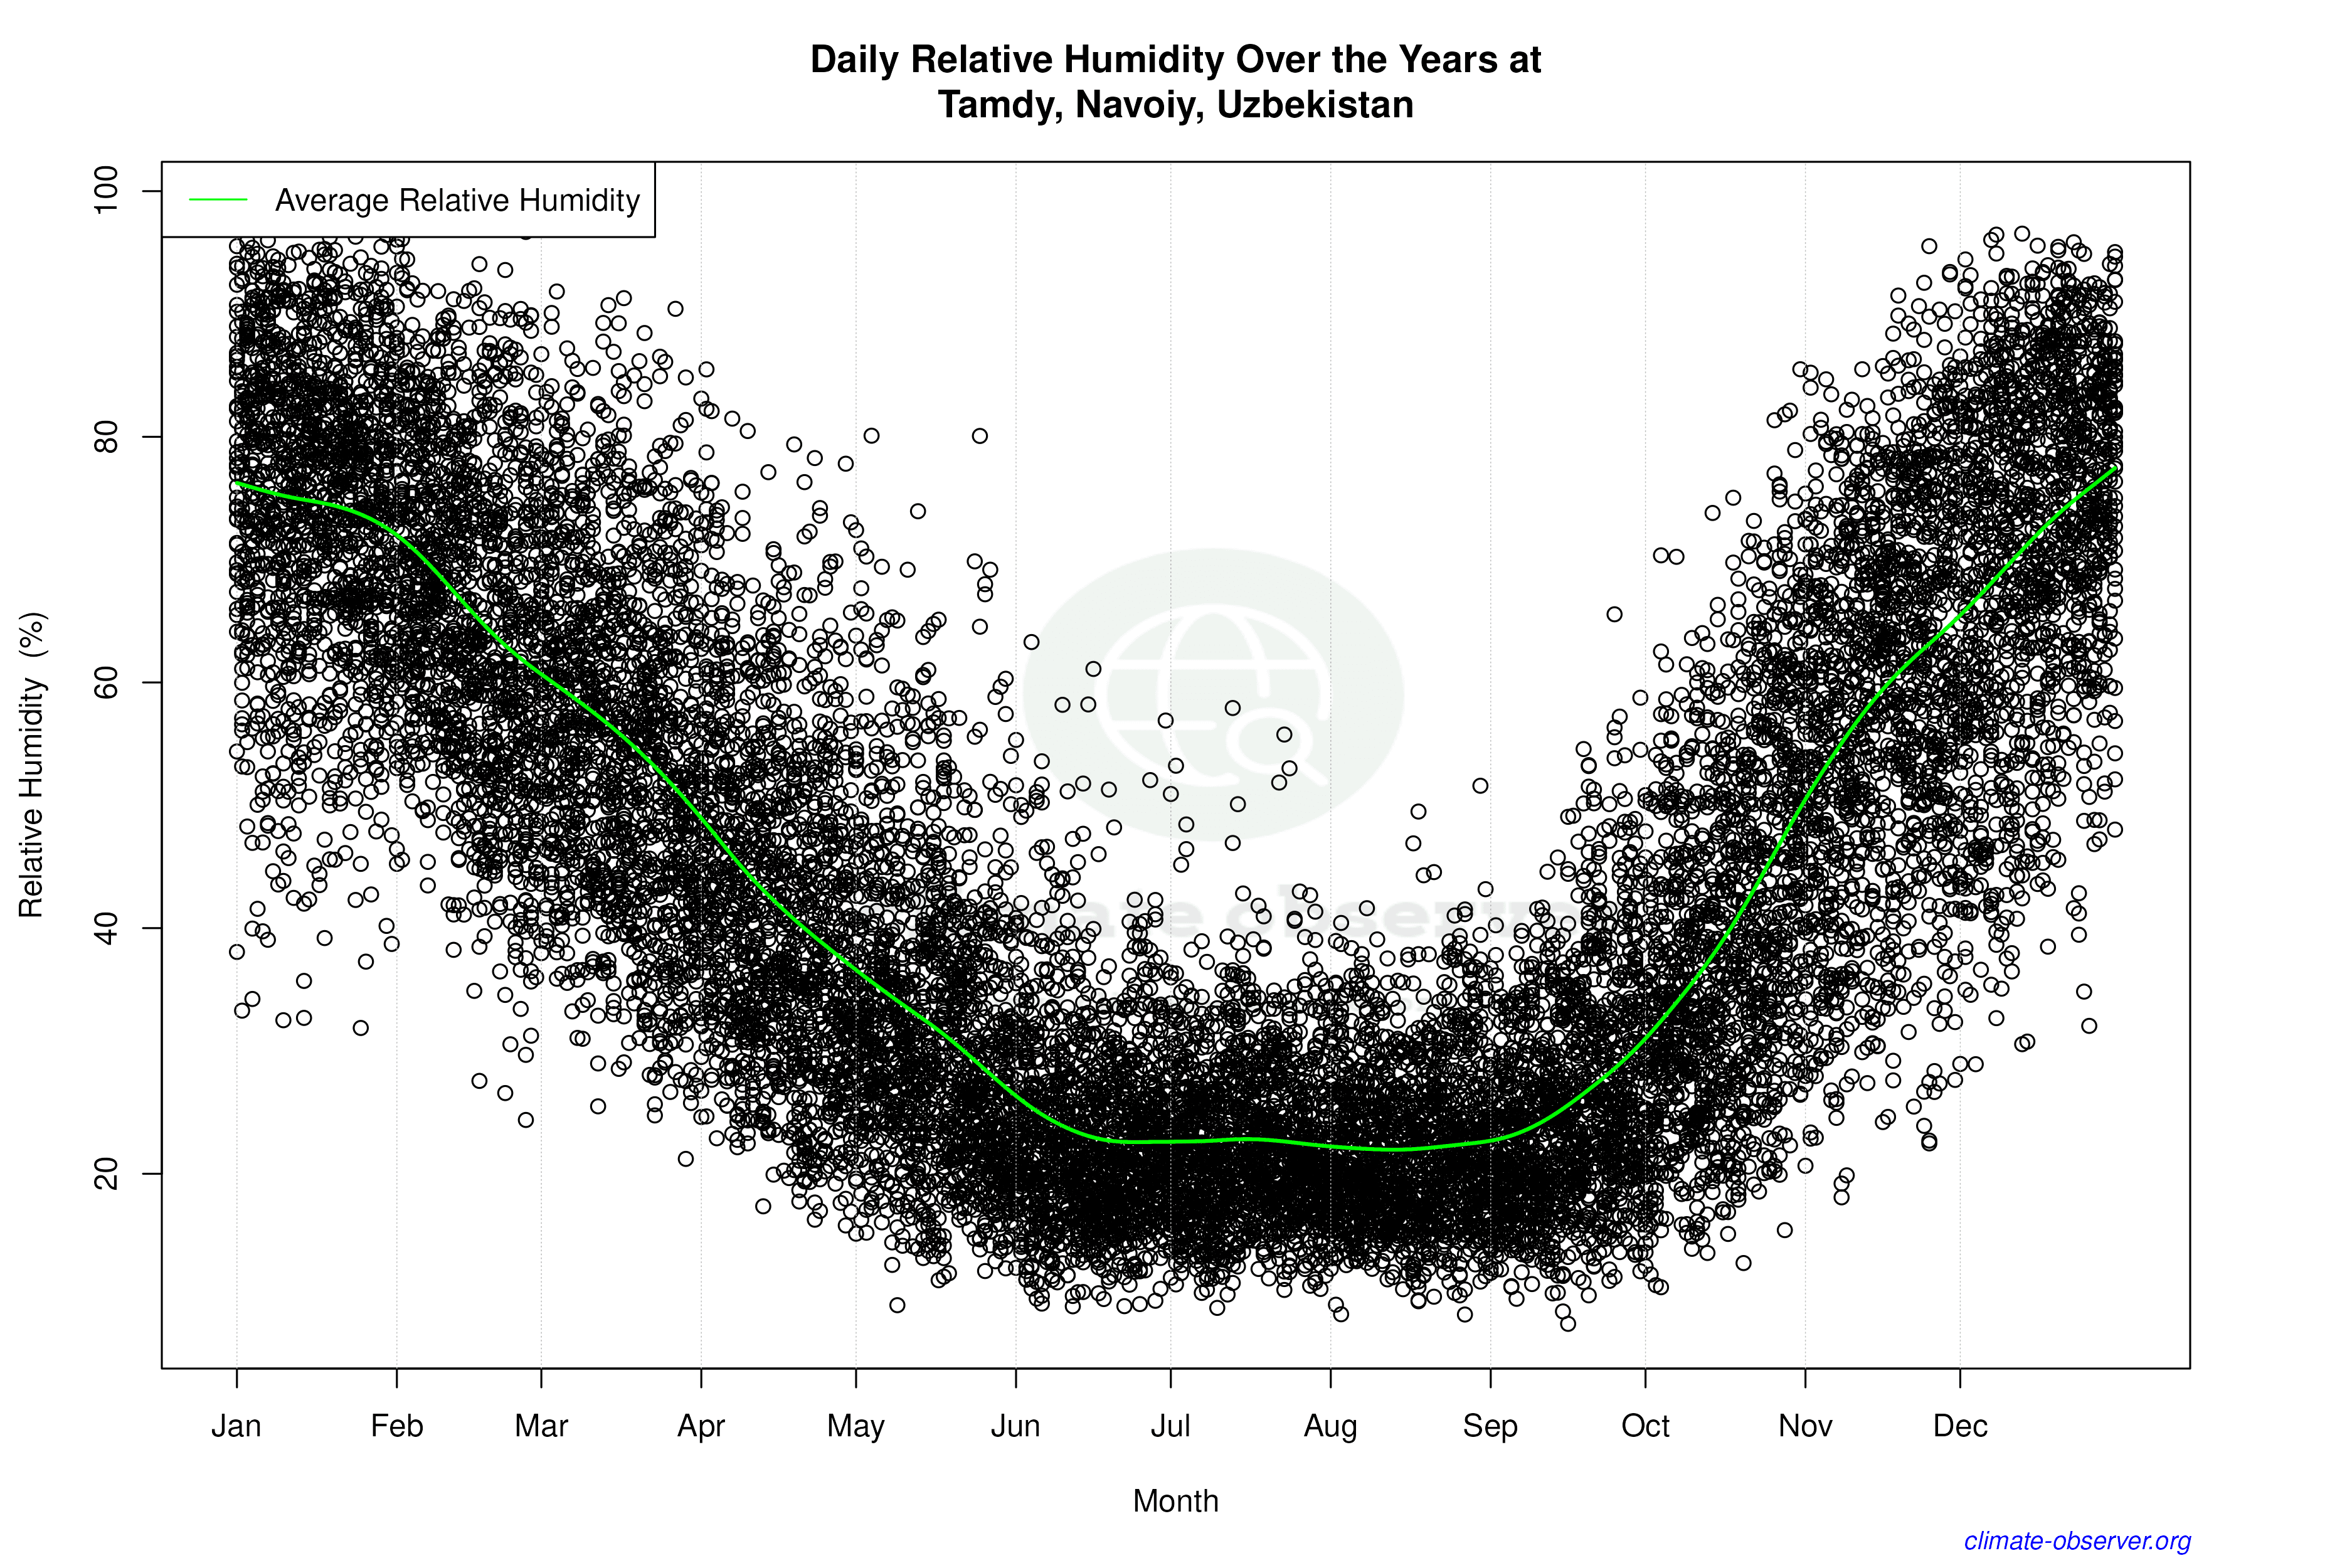

Average Max Temperature Throughout Year | 1 of 5
