Climate for Station: Livingstone, Southern, Zambia
Loading live weather...
Climate Analysis & Overview
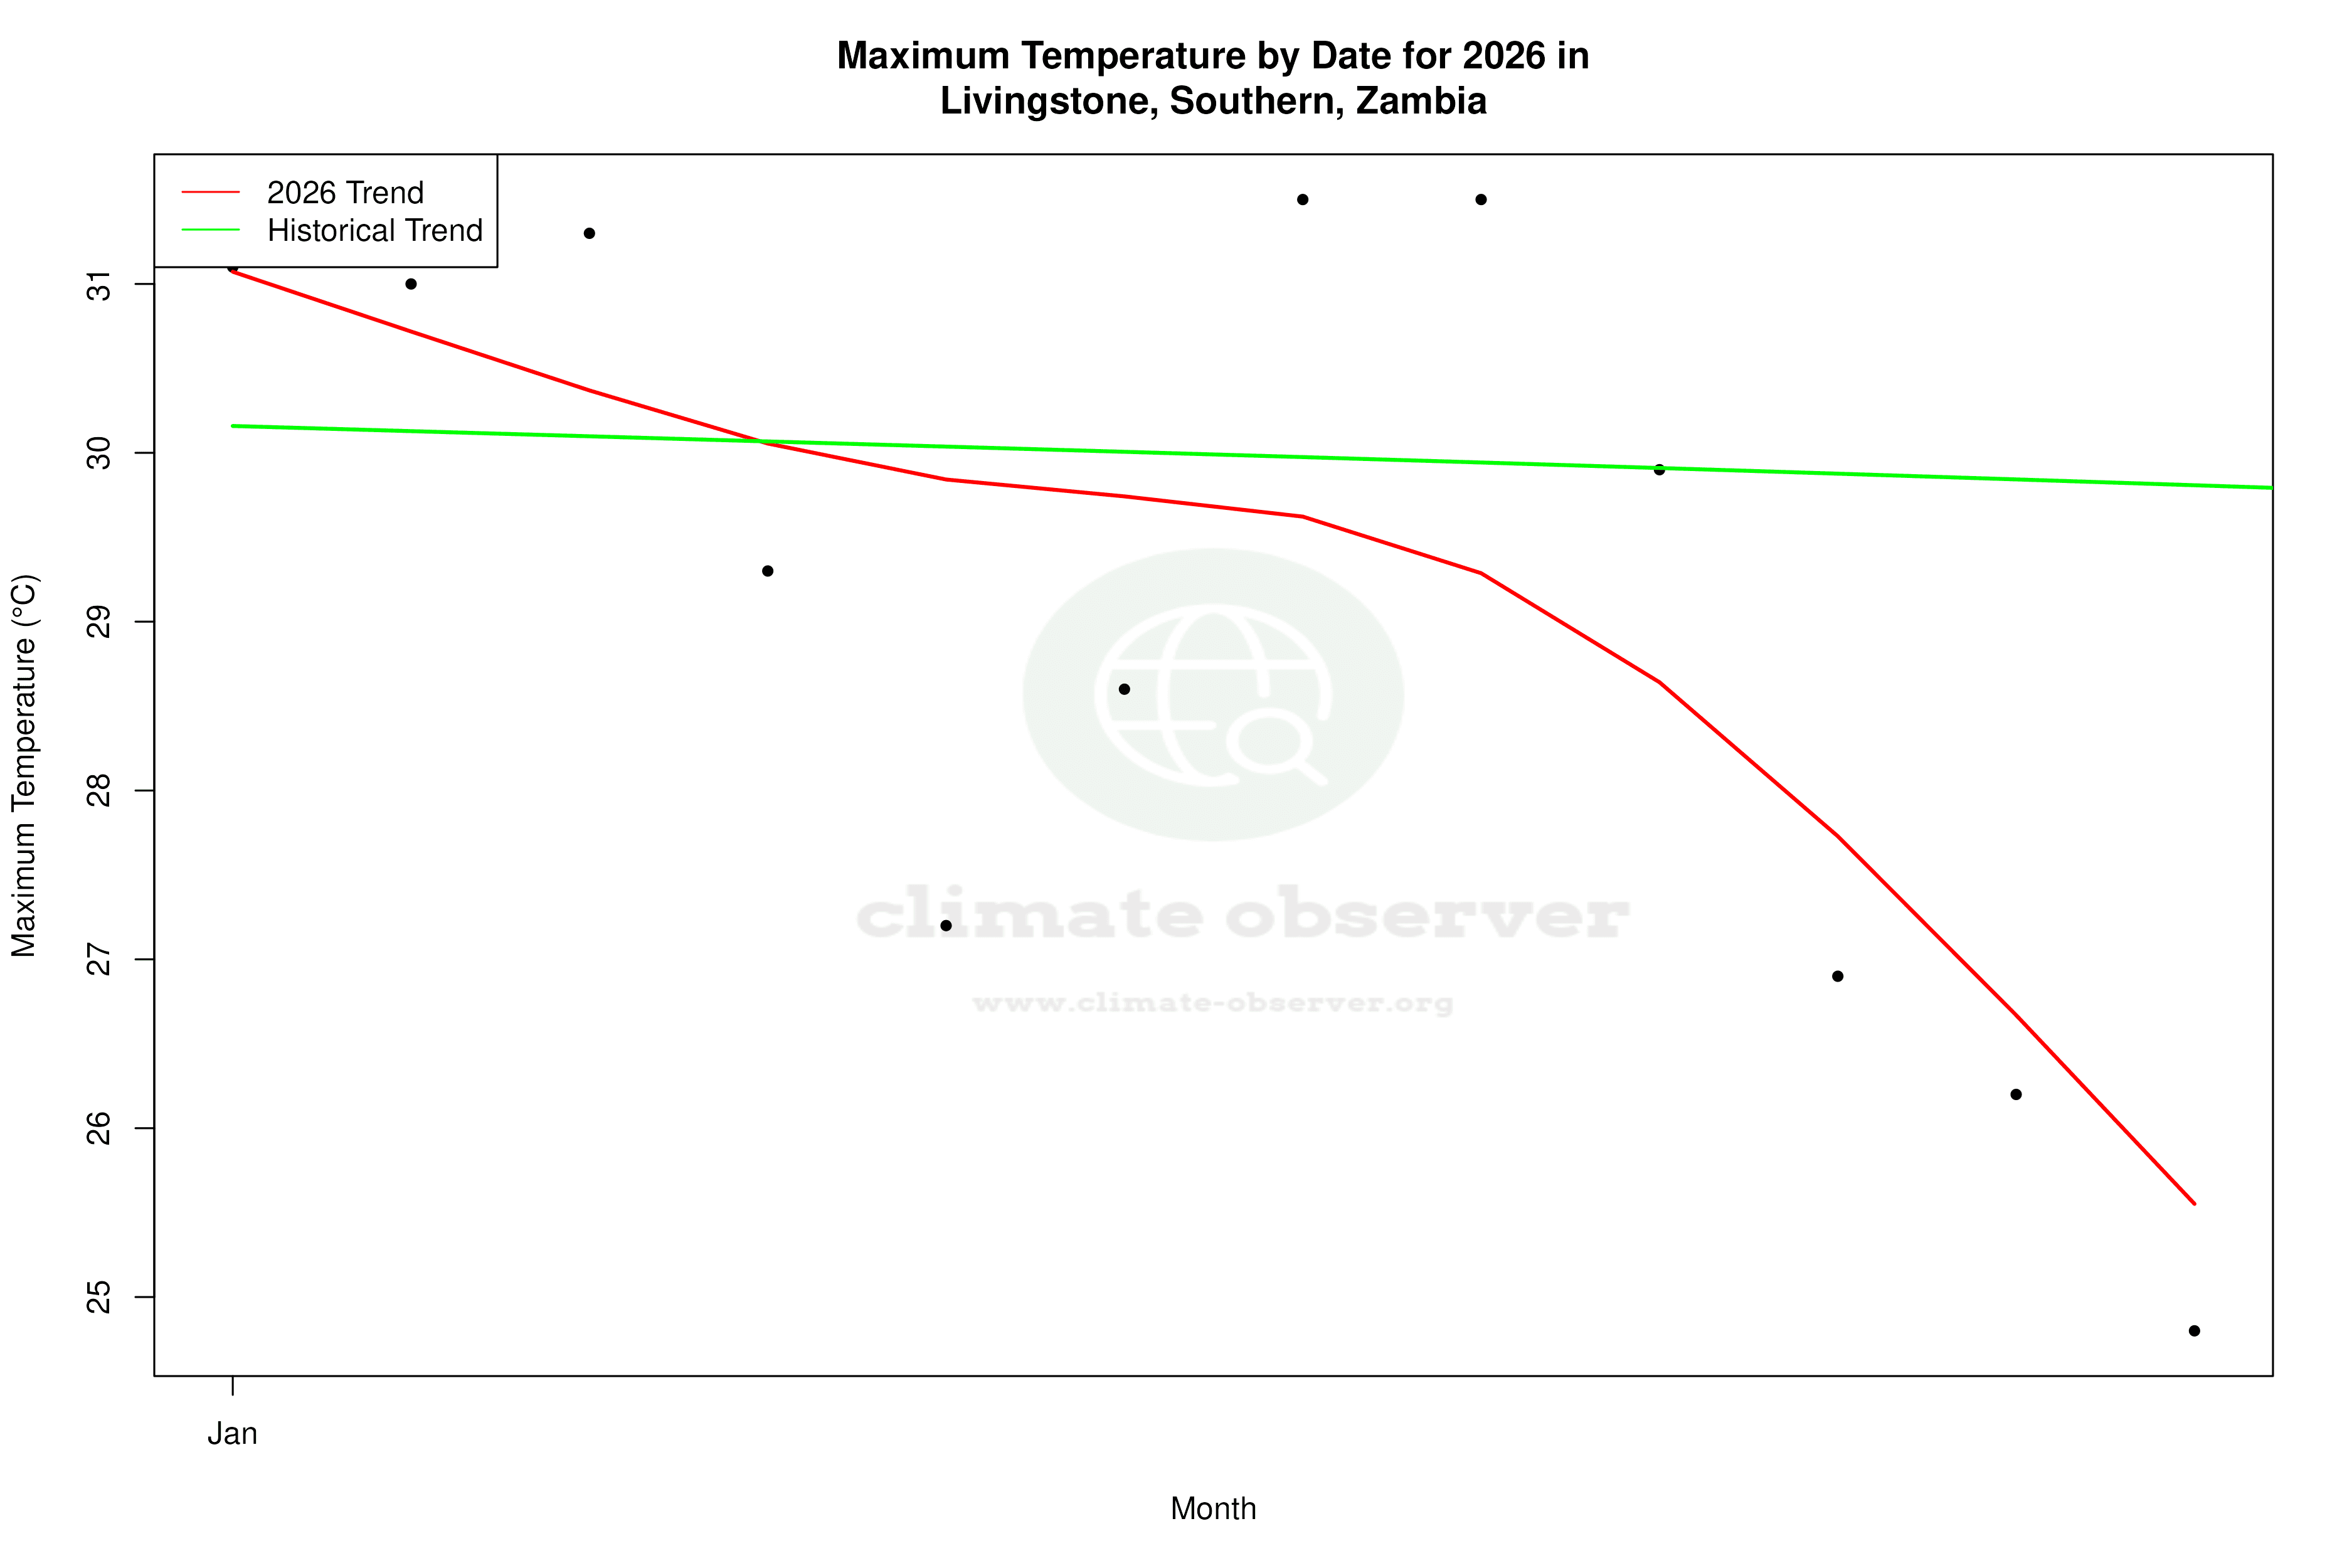
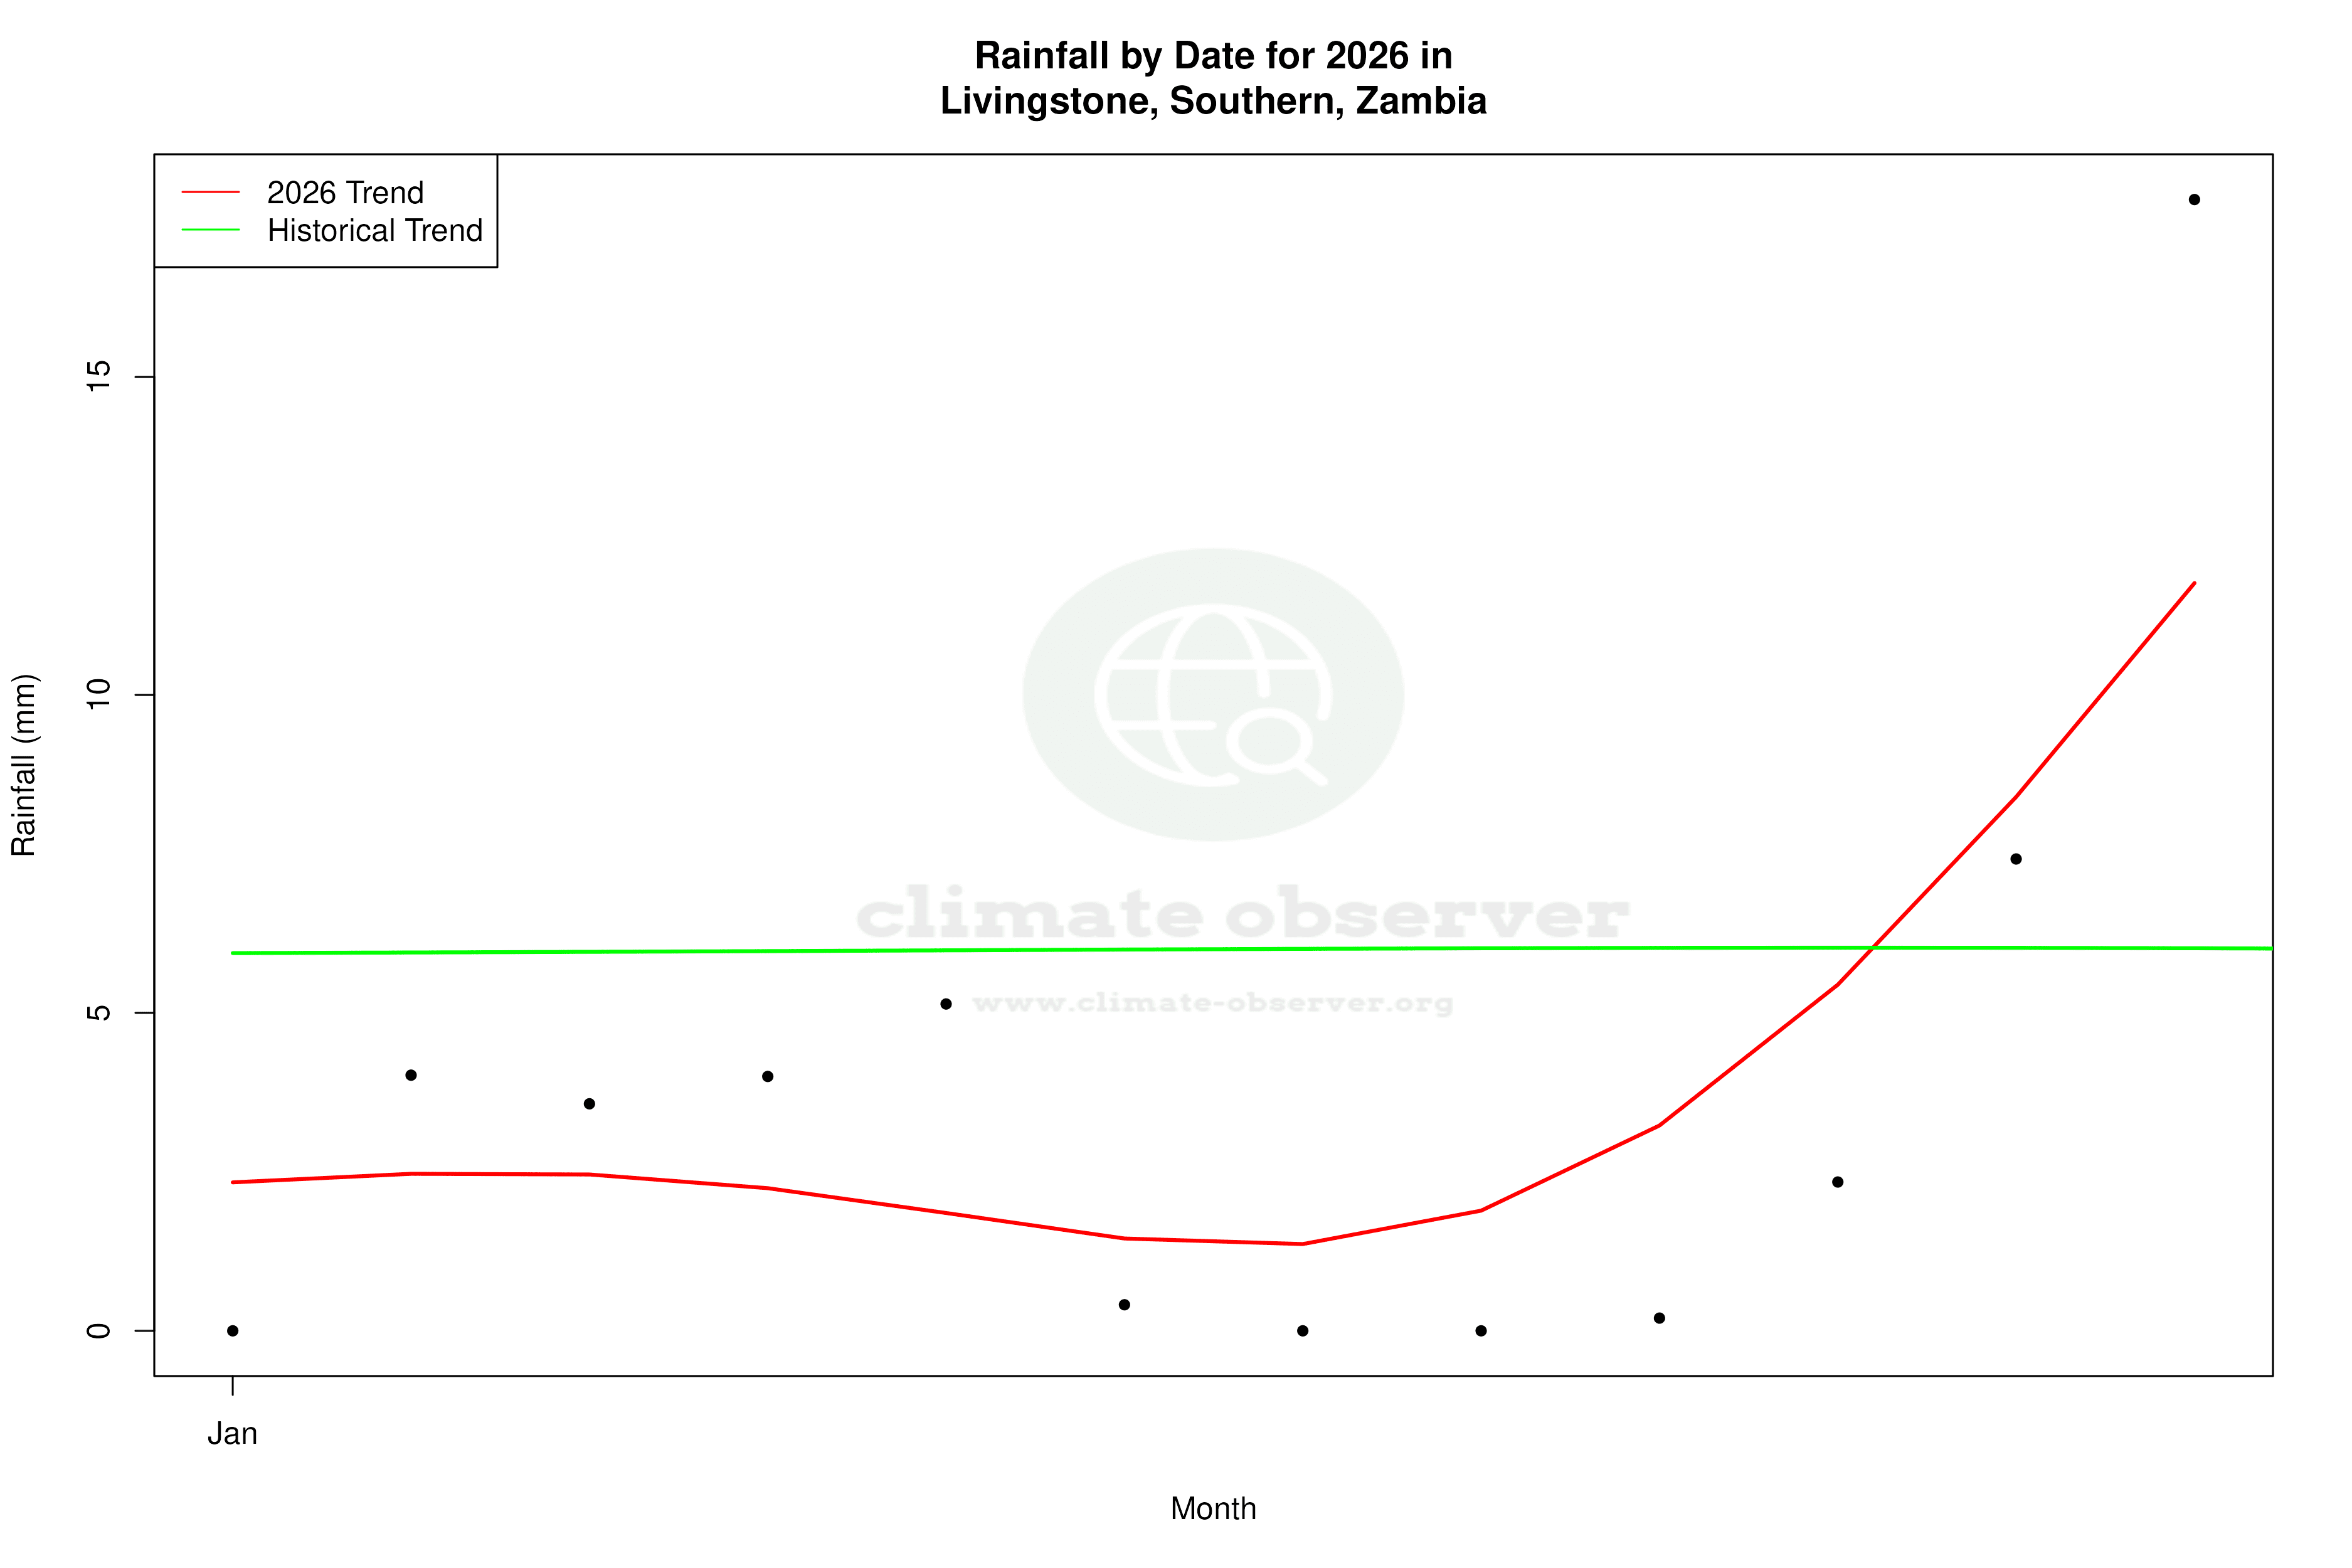
Livingstone, located in the Southern Province of Zambia, is experiencing a complex climate narrative marked by a slight warming in long-term lows and a cooling trend in recent high temperatures. The region's precipitation patterns have become more evenly distributed, suggesting changes in local weather dynamics.
Geographical Influences and Climate Classification
Livingstone, positioned at -17.817, 25.817, is nestled near the Zambezi River and the renowned Victoria Falls. This geographical setting contributes to its Köppen climate classification as a tropical savanna climate (Aw), characterised by distinct wet and dry seasons. The proximity to the Zambezi River moderates temperatures, providing a relatively stable climate despite the broader regional variability.
Temperature Trends: A Mixed Picture
Over the last decade, Livingstone has experienced a cooling trend in high temperatures, with a decrease of 0.78°C (1.40°F). This contrasts with the all-time trend, which shows a slight warming of 0.24°C (0.43°F) in highs. Meanwhile, low temperatures have risen by 0.60°C (1.08°F) over the past ten years, aligning with the long-term increase of 0.64°C (1.15°F). This dual narrative of cooling highs and warming lows suggests a complex interplay of local and global climatic factors affecting the region.
Precipitation Patterns: Towards Even Distribution
The Precipitation Concentration Index (PCI) for Livingstone has shifted from a baseline of 22.98 to a current value of 18.47. This indicates a significant change towards more evenly distributed rainfall events. A PCI above 20 typically signifies highly concentrated rainfall in fewer events, while a drop below this threshold points to a more balanced precipitation pattern. This shift could influence agricultural practices and water resource management in the region.
Record Extremes: A Tale of Contrasts
Livingstone's climate extremes are marked by a record high of 43.6°C (110.5°F) and a record low of -3.0°C (26.6°F). These extremes highlight the variability inherent in the region's climate, potentially exacerbated by broader climatic changes. Such temperature fluctuations can have significant implications for local ecosystems and human activities.
Regional Climate Goals and Implications
Zambia has been proactive in addressing climate change impacts, focusing on sustainable development and resilience-building strategies. The observed trends in Livingstone's climate data underscore the importance of these efforts. As the region adapts to its evolving climate, understanding these nuanced changes becomes crucial for policymakers and stakeholders aiming to mitigate adverse effects and leverage opportunities for sustainable growth.
Station Statistics
10-Year Trend
High: -1.44 °F/decade
Low: +1.02 °F/decade
Rain: -0.022 in/decade
25-Year Trend
High: -1.34 °F/decade
Low: +0.41 °F/decade
Rain: +0.008 in/decade
50-Year Trend
High: +0.19 °F/decade
Low: +1.20 °F/decade
Rain: +0.001 in/decade
All-Time Trend
High: +0.41 °F/decade
Low: +1.15 °F/decade
Rain: -0.003 in/decade
Percentage Above-Average Days
Last 12 Months: 34.8%
This Year: 33.6%
Precipitation Concentration Index (PCI) ℹ️
Last 12 Months: 21.2
Historical Average: 24.3
Percentile Rank of Last 12 Months ℹ️
High: 11th percentile
Low: 85th percentile
Rain: 65th percentile
Change in Variance ℹ️
High: -2.6%
Low: -12.7%
Intraday: -0.0%
Data Coverage
77.8%
First Year of Data
1950
Station Location
Historical Weather Records
| Max High | Avg High | Min High | Max Avg | Avg Avg | Min Avg | Max Low | Avg Low | Min Low | Max Precipitation | Avg Precipitation | Max Snow | Avg Snow | |
|---|---|---|---|---|---|---|---|---|---|---|---|---|---|
| Record | 110.48 °F | — | 59.54 °F | 99.14 °F | — | 45.50 °F | 80.96 °F | — | 26.60 °F | 5.82 in | — | — | — |
| January | 104.74 °F | 85.38 °F | 69.08 °F | 92.30 °F | 76.38 °F | 66.97 °F | 76.82 °F | 66.41 °F | 54.50 °F | 4.06 in | 0.23 in | — | — |
| February | 104.09 °F | 85.09 °F | 69.26 °F | 91.40 °F | 75.82 °F | 66.74 °F | 79.16 °F | 65.75 °F | 52.16 °F | 3.33 in | 0.17 in | — | — |
| March | 110.48 °F | 86.01 °F | 66.02 °F | 90.14 °F | 75.97 °F | 61.52 °F | 75.92 °F | 64.32 °F | 51.98 °F | 2.65 in | 0.08 in | — | — |
| April | 99.36 °F | 85.28 °F | 68.07 °F | 87.44 °F | 73.58 °F | 59.72 °F | 73.04 °F | 59.62 °F | 43.34 °F | 1.72 in | 0.02 in | — | — |
| May | 96.80 °F | 82.58 °F | 66.92 °F | 87.44 °F | 69.46 °F | 52.52 °F | 70.39 °F | 52.53 °F | 32.00 °F | 0.76 in | 0.00 in | — | — |
| June | 90.32 °F | 78.12 °F | 63.32 °F | 81.86 °F | 64.58 °F | 45.50 °F | 63.14 °F | 47.10 °F | 30.20 °F | 3.07 in | 0.00 in | — | — |
| July | 89.76 °F | 77.69 °F | 62.24 °F | 84.20 °F | 63.79 °F | 47.84 °F | 64.40 °F | 45.91 °F | 26.60 °F | 0.06 in | 0.00 in | — | — |
| August | 97.43 °F | 83.88 °F | 59.54 °F | 89.24 °F | 69.62 °F | 50.90 °F | 69.80 °F | 50.92 °F | 33.98 °F | 0.29 in | 0.00 in | — | — |
| September | 103.53 °F | 91.24 °F | 62.96 °F | 96.80 °F | 77.49 °F | 60.10 °F | 77.00 °F | 59.17 °F | 39.20 °F | 1.27 in | 0.00 in | — | — |
| October | 107.38 °F | 94.46 °F | 67.46 °F | 99.14 °F | 82.40 °F | 62.78 °F | 79.52 °F | 66.08 °F | 48.20 °F | 2.99 in | 0.04 in | — | — |
| November | 107.94 °F | 91.60 °F | 63.32 °F | 98.06 °F | 81.19 °F | 62.78 °F | 80.96 °F | 67.59 °F | 52.34 °F | 3.49 in | 0.13 in | — | — |
| December | 104.92 °F | 87.30 °F | 67.10 °F | 94.46 °F | 78.21 °F | 60.98 °F | 80.78 °F | 66.95 °F | 52.70 °F | 5.82 in | 0.20 in | — | — |
Data Visualisations
Remove WatermarksCurrent Year Climate Trends vs Historical


Max Temperature this Year | 1 of 6
Climate 12-Month Moving Averages


Max Temperature 12-Month MA | 1 of 6
Daily Data Points and Averages Throughout the Year


Average Max Temperature Throughout Year | 1 of 5
